10 Results and feedback for all participants
Most CAMS stations function on each clear night, even partial clear nights, with moonlight or any severe weather. Some people have organized themselves in such a way that they can continue their cameras even from some holiday resort abroad, using remote access and Auto-Cams.
To monitor the meteor activity on a continuous bases it is indeed important to cover as many nights as possible and in spite of the rather unfavorable climate in the BeNeLux, most participants manage to capture meteors in about 50% of all nights or even more. With a continuous flow of data it is important that no backlog is generated in order to keep the co-ordination workable. As the network is expanding, the amount of data increases as well as the risk to potential delays due to the workload. Until now most of the data is being reported within 24 hours with only few delays due to circumstances preventing participants from processing their CAMS data.
All participants receive an overview, about once a week with the latest update of reported data, showing which stations could work and how many orbits were obtained for the current month. This overview allows checking if all the mails with reported data effectively reached the network coordinator. This weekly overview encourages anyone who got behind to get back in line with the other CAMS stations to report any missing data (Figure 78).
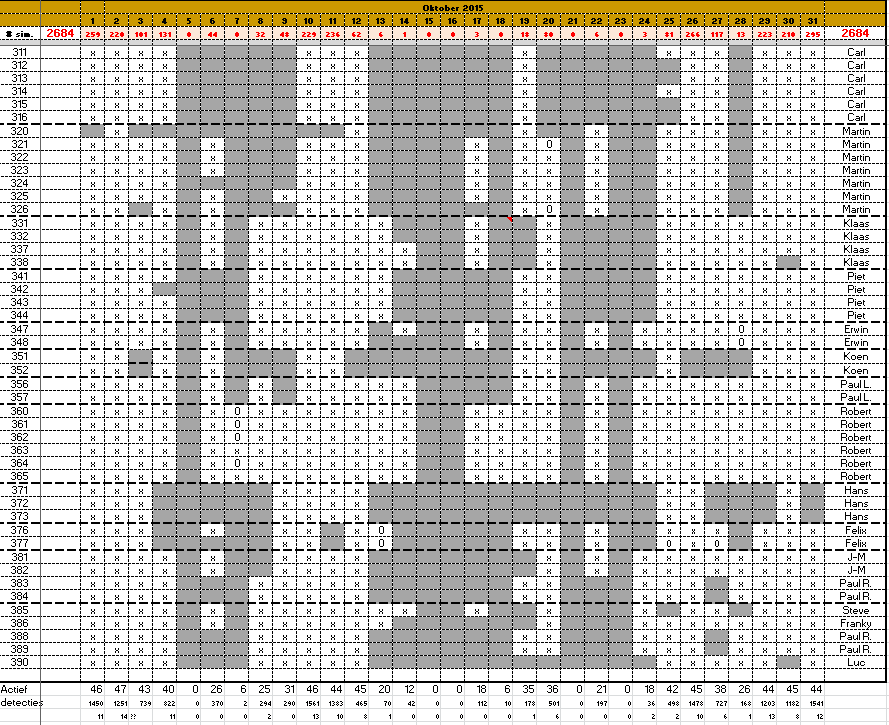
Figure 78 – Screenshot of a weekly update of all nights reported to all CAMS participants.
Few days after the end of each month a list with all the multiple station meteors is sent to each participant, which allows to check which meteors were double station and with who (Figure 79). The table with the accumulated number of orbits since 2012 (see CAMS network) clearly proves that CAMS Benelux is well on the way to achieve the initial target of Peter Jenniskens: “To obtain at least 100 precise orbits per degree of solar longitude in three years of CAMS operation.” Although we will take a bit more than 3 years to achieve this challenge.
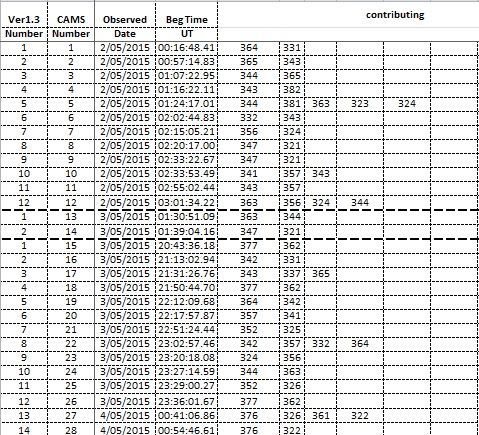
Figure 79 – Screenshot of a monthly listing with details for all multiple station meteors.
Finally the network coordinator circulates results from the Coincidence procedure for any peculiar meteors. The graphical display shows the light curves as derived from the different cameras, the beginning- and ending height with the length of the meteor as well as the projected ground track in geographical coordinates. Any deviant timing will show up as a shift on the projected trails (Figure 80).
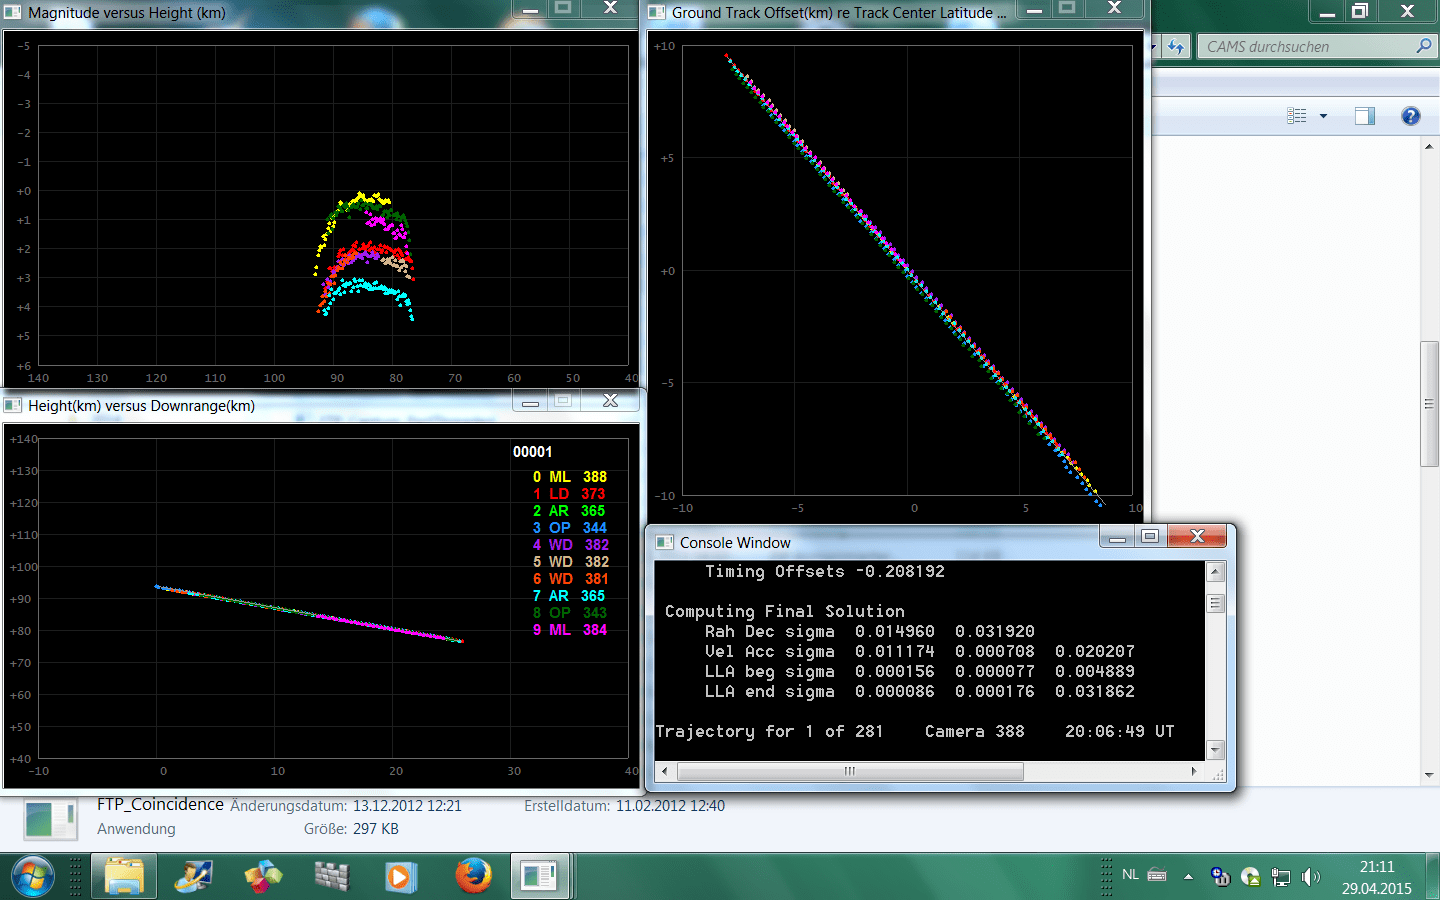
Figure 80 – Screenshot of an individual 5-multanious meteor captured by 7 cameras.
It is possible to see last night’s meteor detections by the BeNeLux network by Martin Breukers and Carl Johannink. Just go to http://cams.seti.org/FDL/ and choose the date from the “Pick a date” window.
Attention: this tool does not function in Internet Explorer. Use Chrome as browser.
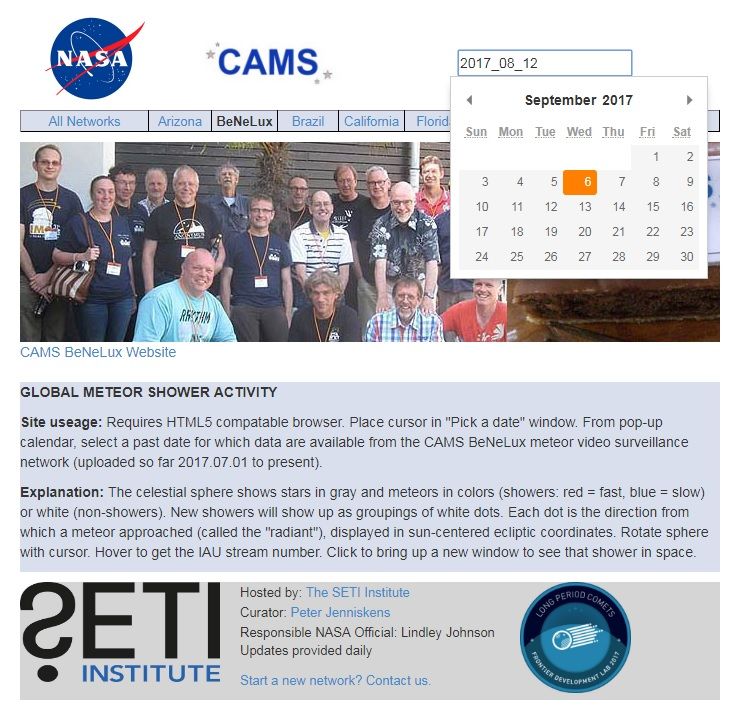
Figure 81 – Online tool to see the radiant distribution detected by CAMS.
This tool allows you to see the radiant distribution based on the CAMS data of any of the CAMS networks, with a plot of the radiant points on a sphere (see Figure 82). With your cursor you can drag the sphere and look at the entire hemisphere. You may choose to see the combined data of all networks together and you can visualize the past data.
Known meteor streams are marked with a color. Sporadic radiants are displayed as white dots. The CAMS radiant distribution can be compared with the CMOR radiant distribution, available online: https://fireballs.ndc.nasa.gov/cmor-radiants/.
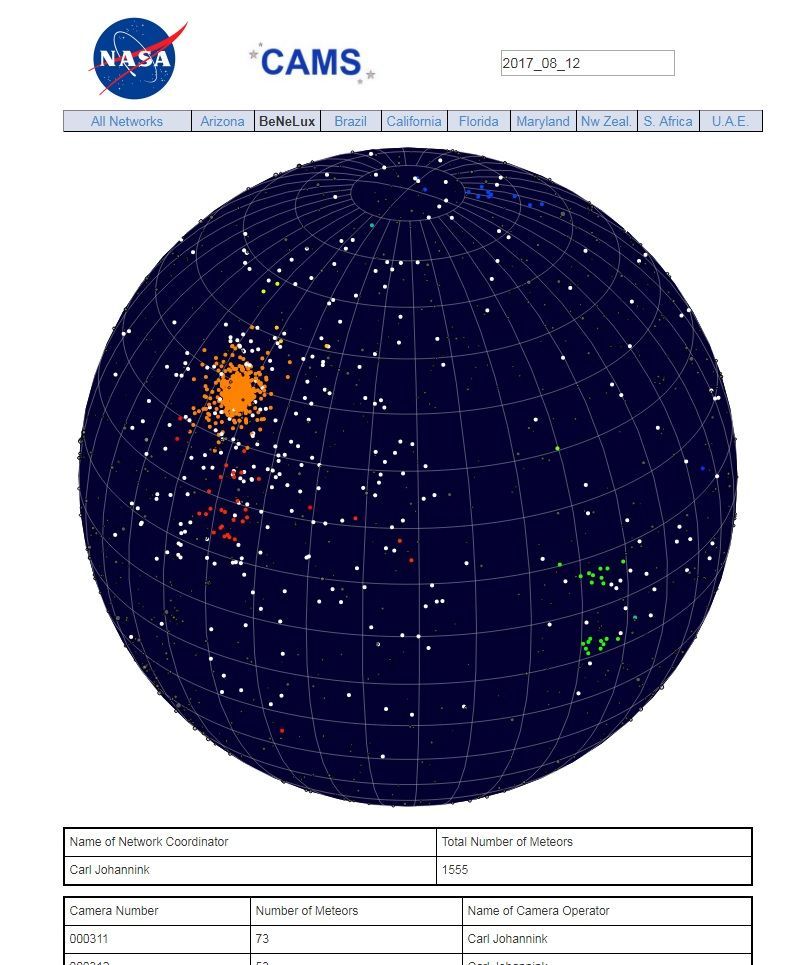
Figure 82 – Online tool with the radiant distribution registered by CAMS-BeNeLux on 12-13 August 2017.
