An overview of the radio observations during August 2018 is given.
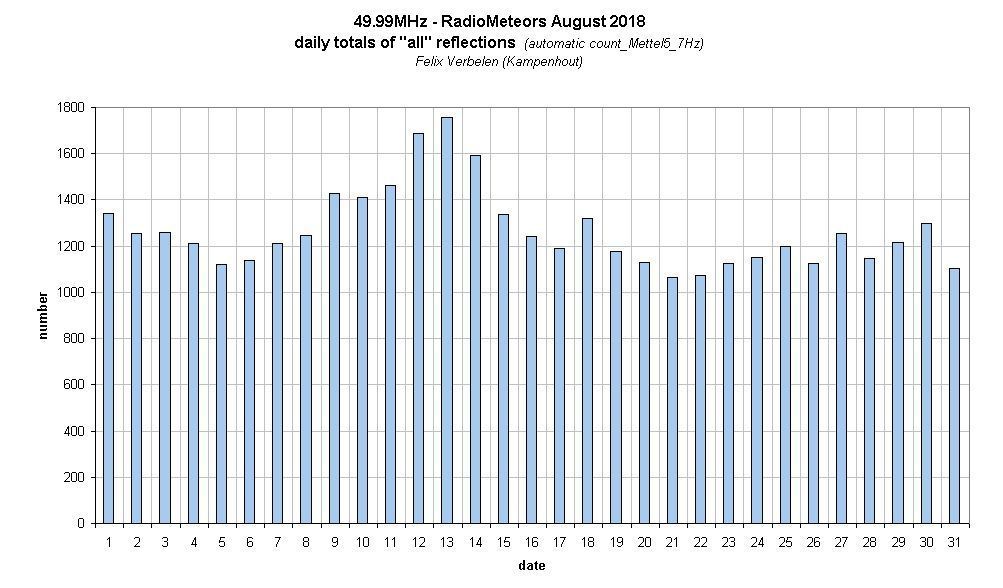
The graphs show both the daily totals (Figure 1) and the hourly numbers (Figure 2) of “all” reflections counted automatically, and of manually counted “overdense” reflections, overdense reflections longer than 10 seconds and longer than 1 minute, as observed here at Kampenhout (BE) on the frequency of our VVS-beacon (49.99 MHz) during August 2018.
The hourly numbers for echoes shorter than 1 minute, are weighted averages(*).
Especially the automatic counts were hampered a few times by (local) interference, by thunderstorms (on 8 days with sometimes strong lightning activity) and by sporadic E (7 days with Es), but most of these counting errors have been corrected manually.
Eye-catchers were of course the Perseids with their maximum around 13 August: they not only provided numerous long-lasting echoes, but also determined the much stronger activity during the first half of the month compared to the second half.
The hourly numbers, for echoes shorter than 1 minute, are weighted averages derived from:
N(h) = n(h-1)/4 + n(h)/2 + n(h+1)/4
If you are interested in the actual figures, please send me an e-mail: felix.verbelen at skynet.be.
Figure 1 – The daily totals of “all” reflections counted automatically, and of manually counted “overdense” reflections, overdense reflections longer than 10 seconds and longer than 1 minute, as observed here at Kampenhout (BE) on the frequency of our VVS-beacon (49.99 MHz) during August 2018.
Figure 2 – The hourly numbers of “all” reflections counted automatically, and of manually counted “overdense” reflections, overdense reflections longer than 10 seconds and longer than 1 minute, as observed here at Kampenhout (BE) on the frequency of our VVS-beacon (49.99 MHz) during August 2018.
