Introduction
The first quarter moon on August 12 meant that the Perseid maximum would be well observable in 2024. According to the IMO Meteor Shower Calendar (Rendtel, 2024), the Perseids would have their maximum on August 12 between 13h and 16h UT (λꙨ = 140.0° and 140.1°). This time is especially favorable for the western American coast and the Pacific. In addition, some extra activity was expected by a number of astronomers. Jéremie Vaubaillon calculated that on August 12 between 4h and 11h UT, the Earth would pass through five very old dust trails of comet 109P/Swift-Tuttle (Rendtel, 2024). Four of these were older than 1300 years. According to Peter Jenniskens, the Earth would pass through a weak filament on August 12 around 9h UT, resulting in a population index r of 1.9 and an extra ZHR of 16 (Jenniskens, 2006).
Finally, the remark that in the years 2018–2022, increased Perseid activity was regularly observed up to 36 hours after the maximum (Jenniskens and Miskotte, 2021; Miskotte, 2019a; 2019b; 2020a; 2020b; 2021; Miskotte and Vandeputte, 2020a; 2020b; Miskotte et al., 2021a; 2021b; Roggemans, 2023). This year, too, this seems to have been the case according to radio observations (Ogawa and Sugimoto, 2024). In this analysis, it was examined whether anything was visually observed of the above-mentioned three phenomena.
Data
A considerable amount of data was uploaded by the observers to the IMO website. For example, exactly 150 observers counted 20637 Perseids during 562 sessions. All data was checked to the quality requirements described above. A good Cp determination could be made for a few new observers. In the end, almost 72% of the data remained, which were 14852 meteors.
In this analysis, we will only discuss the meteor activity above Europe and America. This has one simple reason: there are hardly any visual observers active on the other continents. Figure 1 gives a nice overview of the locations where observers were active.
In addition to data from the IMO website, data from one observer who does not report to IMO was also added.
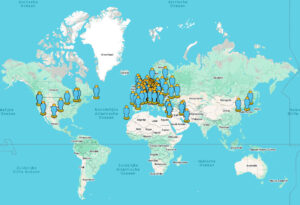 Figure 1. All locations where observers were active during the Perseids 2024 campaign (source: IMO website).
Population index r
Before calculating the ZHR, the population index r must first be calculated. The population index r was calculated according to the method of Steyaert (1981). This resulted in Table 1 and Figure 2.
Table 1. Population index r Perseids 2024 based on the magnitude range -2 to +5.
| Year | Month | Day | t/m UT | λꙨ | r[-2:5] | ± |
| 2024 | 7 | 29 | 22.21 | 126.92 | 1.91 | 0.35 |
| 2024 | 7 | 30 | 22.46 | 127.89 | 2.22 | 0.37 |
| 2024 | 8 | 3 | 23.13 | 131.75 | 2.34 | 0.33 |
| 2024 | 8 | 5 | 23.43 | 133.67 | 2.27 | 0.15 |
| 2024 | 8 | 6 | 22.93 | 134.61 | 2.06 | 0.18 |
| 2024 | 8 | 8 | 1.50 | 135.67 | 1.77 | 0.36 |
| 2024 | 8 | 8 | 23.57 | 136.56 | 2.17 | 0.29 |
| 2024 | 8 | 9 | 23.40 | 137.51 | 2.15 | 0.18 |
| 2024 | 8 | 10 | 20.66 | 138.36 | 2.16 | 0.26 |
| 2024 | 8 | 10 | 21.78 | 138.40 | 2.33 | 0.18 |
| 2024 | 8 | 10 | 22.59 | 138.43 | 2.30 | 0.18 |
| 2024 | 8 | 10 | 23.71 | 138.48 | 2.29 | 0.10 |
| 2024 | 8 | 11 | 0.48 | 138.51 | 2.24 | 0.10 |
| 2024 | 8 | 11 | 1.18 | 138.54 | 2.25 | 0.10 |
| 2024 | 8 | 11 | 1.23 | 138.54 | 2.34 | 0.14 |
| 2024 | 8 | 11 | 5.82 | 138.72 | 2.70 | 0.32 |
| 2024 | 8 | 11 | 20.91 | 139.33 | 2.30 | 0.16 |
| 2024 | 8 | 11 | 21.55 | 139.35 | 2.15 | 0.11 |
| 2024 | 8 | 11 | 22.47 | 139.39 | 2.21 | 0.07 |
| 2024 | 8 | 11 | 23.54 | 139.43 | 2.29 | 0.06 |
| 2024 | 8 | 12 | 0.53 | 139.47 | 2.09 | 0.06 |
| 2024 | 8 | 12 | 1.52 | 139.51 | 2.06 | 0.07 |
| 2024 | 8 | 12 | 2.30 | 139.54 | 2.06 | 0.11 |
| 2024 | 8 | 12 | 3.86 | 139.60 | 2.07 | 0.38 |
| 2024 | 8 | 12 | 5.97 | 139.69 | 1.83 | 0.36 |
| 2024 | 8 | 12 | 7.56 | 139.75 | 1.82 | 0.32 |
| 2024 | 8 | 12 | 8.00 | 139.77 | 1.77 | 0.23 |
| 2024 | 8 | 12 | 9.48 | 139.83 | 2.27 | 0.24 |
| 2024 | 8 | 12 | 10.55 | 139.87 | 1.99 | 0.23 |
| 2024 | 8 | 12 | 19.70 | 140.24 | 2.11 | 0.56 |
| 2024 | 8 | 12 | 20.83 | 140.28 | 1.97 | 0.12 |
| 2024 | 8 | 12 | 21.53 | 140.31 | 2.16 | 0.08 |
| 2024 | 8 | 12 | 22.50 | 140.35 | 2.12 | 0.07 |
| 2024 | 8 | 12 | 23.48 | 140.39 | 2.18 | 0.06 |
| 2024 | 8 | 13 | 0.44 | 140.43 | 2.13 | 0.07 |
| 2024 | 8 | 13 | 1.53 | 140.47 | 2.02 | 0.08 |
| 2024 | 8 | 13 | 2.43 | 140.51 | 2.20 | 0.12 |
| 2024 | 8 | 13 | 4.30 | 140.58 | 2.52 | 0.29 |
| 2024 | 8 | 13 | 6.30 | 140.66 | 3.03 | 0.18 |
| 2024 | 8 | 13 | 8.33 | 140.74 | 2.60 | 0.20 |
| 2024 | 8 | 13 | 10.33 | 140.82 | 1.85 | 0.22 |
| 2024 | 8 | 13 | 21.58 | 141.27 | 1.66 | 0.19 |
| 2024 | 8 | 13 | 22.10 | 141.29 | 1.93 | 0.19 |
| 2024 | 8 | 13 | 22.59 | 141.31 | 2.02 | 0.14 |
| 2024 | 8 | 13 | 23.23 | 141.34 | 2.02 | 0.14 |
| 2024 | 8 | 14 | 0.38 | 141.39 | 2.34 | 0.20 |
| 2024 | 8 | 14 | 1.48 | 141.43 | 2.22 | 0.24 |
| 2024 | 8 | 14 | 9.00 | 141.73 | 2.54 | 0.26 |
| 2024 | 8 | 14 | 23.30 | 142.30 | 2.19 | 0.12 |
| 2024 | 8 | 15 | 9.90 | 142.73 | 1.97 | 0.56 |
| 2024 | 8 | 17 | 1.75 | 144.32 | 2.01 | 0.39 |

Figure 2. The population index r of the Perseids between July 28 and August 30, 2024.
In Figure 3 we zoom in on the period from 10 August 2024 20h UT to 14 August 02h UT. Added to this are the filament passage expected by Peter Jenniskens at 9h UT (black cross with predicted r = 1.9) and the period in which Jéremie Vaubaillon expected the old dust trails (green line). This clearly shows that the population index r was well below the normal value of 2.2 during the period of both predictions. An indication that the predictions were quite good. Also striking is the very high population index r near λꙨ = 140.67° (13 August 2024, 06h18m UT) and the sharp drop afterwards to low values. The start of the night of 13–14 August near λꙨ = 141.3° also shows very low r values. We will go into this in more detail in the next section.
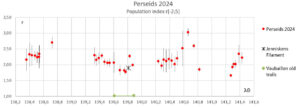
Figure 3. Population index r Perseids 2024 and the expected position of the filament of Peter Jenniskens (2006) and the old dust trails of Jéremie Vaubaillion (Rendtel, 2024).
Zenital Hourly Rate
To determine the Zenital Hourly Rate (ZHR) the meteor counts were used. The formula to calculate the ZHR is this:
 For the period from 15 July to 10 August (0h UT) hourly counts were used (0.67 to 2 hours), between 10 and 15 August shorter intervals were used (0.36 to 0.7 hours). This depends somewhat on how the data was supplied. Because some observers supply 30-minute counts, others 10-minute counts. For the latter, these are combined into 30-minute counts.
From all individual ZHR values that were calculated, the average ZHR was then calculated according to the principle of the weighted average. Table 2 and Figure 4 could be obtained from all ZHR calculations. The values calculated above were used as population index r values, all determined in the magnitude interval –2 to +5. For the single night in which this was not possible, the standard population index r for the Perseids (2.2) was used.
Table 2: ZHR of the Perseids in 2024.
| Year | Month | Day | t/m | λꙨ | periods | PER | Stream | ZHR | Dev | OBS |
| 2024 | 7 | 15 | 0.50 | 112.697 | 3 | 2 | PER | 1.3 | 0.9 | 1 |
| 2024 | 7 | 28 | 21.95 | 125.958 | 9 | 30 | PER | 10.3 | 1.9 | 5 |
| 2024 | 7 | 29 | 22.39 | 126.931 | 18 | 49 | PER | 8.1 | 1.2 | 9 |
| 2024 | 7 | 30 | 22.52 | 127.893 | 12 | 30 | PER | 6.5 | 1.2 | 6 |
| 2024 | 7 | 31 | 8.50 | 128.292 | 3 | 13 | PER | 7.8 | 2.2 | 1 |
| 2024 | 7 | 31 | 21.85 | 128.823 | 1 | 3 | PER | 9.1 | 5.3 | 1 |
| 2024 | 8 | 1 | 8.99 | 129.267 | 2 | 7 | PER | 8.6 | 3.3 | 1 |
| 2024 | 8 | 2 | 7.25 | 130.155 | 1 | 7 | PER | 14.3 | 5.4 | 1 |
| 2024 | 8 | 2 | 23.31 | 130.788 | 4 | 10 | PER | 5.0 | 1.6 | 2 |
| 2024 | 8 | 3 | 7.61 | 131.127 | 2 | 11 | PER | 17.7 | 5.3 | 1 |
| 2024 | 8 | 3 | 23.32 | 131.753 | 10 | 50 | PER | 9.9 | 1.4 | 3 |
| 2024 | 8 | 4 | 6.86 | 132.054 | 2 | 10 | PER | 13.1 | 4.1 | 1 |
| 2024 | 8 | 4 | 23.06 | 132.701 | 2 | 18 | PER | 23.8 | 5.6 | 2 |
| 2024 | 8 | 5 | 23.36 | 133.670 | 29 | 173 | PER | 12.5 | 1.0 | 9 |
| 2024 | 8 | 6 | 23.10 | 134.619 | 21 | 140 | PER | 16.3 | 1.4 | 6 |
| 2024 | 8 | 7 | 6.94 | 134.932 | 3 | 28 | PER | 13.1 | 2.5 | 1 |
| 2024 | 8 | 8 | 1.50 | 135.674 | 3 | 44 | PER | 17.1 | 2.6 | 1 |
| 2024 | 8 | 8 | 7.50 | 135.913 | 7 | 69 | PER | 19.9 | 2.4 | 3 |
| 2024 | 8 | 8 | 23.77 | 136.563 | 18 | 163 | PER | 24.4 | 1.9 | 6 |
| 2024 | 8 | 9 | 8.26 | 136.902 | 3 | 37 | PER | 30.2 | 5.0 | 2 |
| 2024 | 8 | 9 | 23.89 | 137.527 | 24 | 227 | PER | 22.4 | 1.5 | 7 |
| 2024 | 8 | 10 | 7.12 | 137.816 | 5 | 58 | PER | 24.0 | 3.2 | 2 |
| 2024 | 8 | 10 | 20.92 | 138.368 | 9 | 56 | PER | 31.7 | 4.2 | 7 |
| 2024 | 8 | 10 | 21.45 | 138.389 | 10 | 63 | PER | 33.8 | 4.3 | 8 |
| 2024 | 8 | 10 | 22.04 | 138.412 | 12 | 86 | PER | 31.4 | 3.4 | 6 |
| 2024 | 8 | 10 | 22.41 | 138.427 | 12 | 80 | PER | 29.2 | 3.3 | 7 |
| 2024 | 8 | 10 | 23.18 | 138.458 | 19 | 170 | PER | 33.4 | 2.6 | 12 |
| 2024 | 8 | 10 | 23.51 | 138.471 | 24 | 236 | PER | 36.7 | 2.4 | 9 |
| 2024 | 8 | 11 | 0.03 | 138.492 | 24 | 250 | PER | 32.7 | 2.1 | 9 |
| 2024 | 8 | 11 | 0.49 | 138.511 | 23 | 241 | PER | 30.7 | 2.0 | 10 |
| 2024 | 8 | 11 | 0.99 | 138.531 | 26 | 293 | PER | 29.1 | 1.7 | 12 |
| 2024 | 8 | 11 | 1.39 | 138.547 | 29 | 215 | PER | 27.9 | 1.9 | 11 |
| 2024 | 8 | 11 | 1.94 | 138.568 | 14 | 211 | PER | 29.6 | 2.0 | 7 |
| 2024 | 8 | 11 | 2.37 | 138.586 | 9 | 143 | PER | 32.9 | 2.8 | 5 |
| 2024 | 8 | 11 | 4.65 | 138.676 | 2 | 39 | PER | 46.1 | 7.4 | 1 |
| 2024 | 8 | 11 | 5.82 | 138.724 | 2 | 27 | PER | 37.6 | 7.2 | 1 |
| 2024 | 8 | 11 | 6.60 | 138.755 | 2 | 16 | PER | 41.4 | 10.4 | 2 |
| 2024 | 8 | 11 | 7.29 | 138.782 | 3 | 22 | PER | 33.5 | 7.1 | 2 |
| 2024 | 8 | 11 | 8.19 | 138.818 | 3 | 39 | PER | 23.5 | 3.8 | 2 |
| 2024 | 8 | 11 | 21.17 | 139.337 | 29 | 255 | PER | 53.8 | 3.4 | 13 |
| 2024 | 8 | 11 | 21.54 | 139.352 | 44 | 415 | PER | 52.1 | 2.6 | 15 |
| 2024 | 8 | 11 | 22.03 | 139.372 | 53 | 590 | PER | 56.6 | 2.3 | 16 |
| 2024 | 8 | 11 | 22.52 | 139.391 | 66 | 823 | PER | 59.0 | 2.1 | 23 |
| 2024 | 8 | 11 | 23.00 | 139.411 | 71 | 981 | PER | 58.4 | 1.9 | 27 |
| 2024 | 8 | 11 | 23.49 | 139.430 | 79 | 1170 | PER | 55.7 | 1.6 | 28 |
| 2024 | 8 | 11 | 23.91 | 139.447 | 69 | 1069 | PER | 53.2 | 1.6 | 26 |
| 2024 | 8 | 12 | 0.48 | 139.470 | 64 | 1108 | PER | 54.2 | 1.6 | 22 |
| 2024 | 8 | 12 | 0.93 | 139.488 | 57 | 1113 | PER | 56.5 | 1.7 | 23 |
| 2024 | 8 | 12 | 1.42 | 139.507 | 42 | 827 | PER | 54.0 | 1.9 | 16 |
| 2024 | 8 | 12 | 1.85 | 139.525 | 26 | 502 | PER | 50.2 | 2.2 | 11 |
| 2024 | 8 | 12 | 2.29 | 139.542 | 13 | 270 | PER | 48.5 | 3.0 | 10 |
| 2024 | 8 | 12 | 2.96 | 139.569 | 7 | 143 | PER | 43.8 | 3.7 | 4 |
| 2024 | 8 | 12 | 3.62 | 139.595 | 5 | 93 | PER | 45.9 | 4.8 | 2 |
| 2024 | 8 | 12 | 7.27 | 139.741 | 4 | 54 | PER | 68.7 | 9.3 | 2 |
| 2024 | 8 | 12 | 7.96 | 139.769 | 5 | 93 | PER | 81.8 | 8.5 | 2 |
| 2024 | 8 | 12 | 8.51 | 139.791 | 6 | 147 | PER | 94.8 | 7.8 | 2 |
| 2024 | 8 | 12 | 8.93 | 139.808 | 6 | 148 | PER | 88.8 | 7.3 | 2 |
| 2024 | 8 | 12 | 9.44 | 139.828 | 4 | 106 | PER | 93.5 | 9.1 | 2 |
| 2024 | 8 | 12 | 10.07 | 139.853 | 6 | 158 | PER | 81.5 | 6.5 | 2 |
| 2024 | 8 | 12 | 10.36 | 139.865 | 7 | 199 | PER | 89.1 | 6.3 | 2 |
| 2024 | 8 | 12 | 10.95 | 139.888 | 5 | 129 | PER | 82.5 | 7.3 | 1 |
| 2024 | 8 | 12 | 20.11 | 140.255 | 3 | 34 | PER | 111.4 | 19.1 | 2 |
| 2024 | 8 | 12 | 20.61 | 140.275 | 6 | 76 | PER | 105.0 | 12.0 | 3 |
| 2024 | 8 | 12 | 21.14 | 140.296 | 25 | 318 | PER | 90.3 | 5.1 | 14 |
| 2024 | 8 | 12 | 21.56 | 140.313 | 44 | 614 | PER | 87.8 | 3.5 | 15 |
| 2024 | 8 | 12 | 22.04 | 140.332 | 58 | 807 | PER | 76.7 | 2.7 | 19 |
| 2024 | 8 | 12 | 22.47 | 140.349 | 63 | 908 | PER | 72.7 | 2.4 | 20 |
| 2024 | 8 | 12 | 23.05 | 140.372 | 74 | 1221 | PER | 72.0 | 2.1 | 21 |
| 2024 | 8 | 12 | 23.48 | 140.390 | 80 | 1506 | PER | 74.8 | 1.9 | 27 |
| 2024 | 8 | 12 | 23.98 | 140.409 | 70 | 1373 | PER | 71.0 | 1.9 | 22 |
| 2024 | 8 | 13 | 0.48 | 140.429 | 61 | 1090 | PER | 65.6 | 2.0 | 20 |
| 2024 | 8 | 13 | 0.96 | 140.449 | 51 | 1094 | PER | 63.0 | 1.9 | 19 |
| 2024 | 8 | 13 | 1.47 | 140.469 | 43 | 1093 | PER | 67.9 | 2.1 | 19 |
| 2024 | 8 | 13 | 1.88 | 140.485 | 28 | 777 | PER | 68.0 | 2.4 | 10 |
| 2024 | 8 | 13 | 2.31 | 140.503 | 15 | 442 | PER | 61.9 | 2.9 | 6 |
| 2024 | 8 | 13 | 2.78 | 140.522 | 7 | 189 | PER | 74.1 | 5.4 | 4 |
| 2024 | 8 | 13 | 3.62 | 140.555 | 3 | 67 | PER | 84.4 | 10.3 | 2 |
| 2024 | 8 | 13 | 4.20 | 140.578 | 3 | 40 | PER | 72.6 | 11.5 | 1 |
| 2024 | 8 | 13 | 4.71 | 140.599 | 3 | 47 | PER | 63.0 | 9.2 | 1 |
| 2024 | 8 | 13 | 5.04 | 140.612 | 3 | 52 | PER | 60.4 | 8.4 | 1 |
| 2024 | 8 | 13 | 5.47 | 140.629 | 3 | 68 | PER | 68.7 | 8.3 | 2 |
| 2024 | 8 | 13 | 6.05 | 140.652 | 4 | 115 | PER | 78.9 | 7.4 | 2 |
| 2024 | 8 | 13 | 6.54 | 140.672 | 5 | 169 | PER | 86.5 | 6.7 | 2 |
| 2024 | 8 | 13 | 7.09 | 140.694 | 6 | 189 | PER | 89.1 | 6.5 | 2 |
| 2024 | 8 | 13 | 7.49 | 140.710 | 6 | 193 | PER | 85.8 | 6.2 | 2 |
| 2024 | 8 | 13 | 8.74 | 140.760 | 5 | 190 | PER | 87.8 | 6.4 | 3 |
| 2024 | 8 | 13 | 9.12 | 140.775 | 6 | 185 | PER | 80.8 | 5.9 | 3 |
| 2024 | 8 | 13 | 10.17 | 140.817 | 4 | 108 | PER | 64.8 | 6.2 | 1 |
| 2024 | 8 | 13 | 10.50 | 140.830 | 4 | 104 | PER | 58.9 | 5.8 | 1 |
| 2024 | 8 | 13 | 10.83 | 140.844 | 4 | 93 | PER | 50.1 | 5.2 | 1 |
| 2024 | 8 | 13 | 20.58 | 141.234 | 2 | 16 | PER | 39.3 | 9.8 | 2 |
| 2024 | 8 | 13 | 21.62 | 141.275 | 6 | 78 | PER | 51.3 | 5.8 | 4 |
| 2024 | 8 | 13 | 22.08 | 141.293 | 8 | 109 | PER | 58.9 | 5.6 | 6 |
| 2024 | 8 | 13 | 22.60 | 141.314 | 12 | 123 | PER | 42.6 | 3.8 | 8 |
| 2024 | 8 | 13 | 23.09 | 141.334 | 15 | 167 | PER | 39.4 | 3.0 | 10 |
| 2024 | 8 | 13 | 23.39 | 141.346 | 13 | 141 | PER | 40.9 | 3.4 | 8 |
| 2024 | 8 | 13 | 23.88 | 141.361 | 10 | 106 | PER | 32.3 | 3.1 | 6 |
| 2024 | 8 | 14 | 0.42 | 141.387 | 9 | 84 | PER | 27.5 | 3.0 | 5 |
| 2024 | 8 | 14 | 1.08 | 141.414 | 9 | 95 | PER | 31.4 | 3.2 | 4 |
| 2024 | 8 | 14 | 1.40 | 141.426 | 7 | 81 | PER | 32.2 | 3.6 | 4 |
| 2024 | 8 | 14 | 6.71 | 141.639 | 1 | 23 | PER | 39.8 | 8.3 | 1 |
| 2024 | 8 | 14 | 7.39 | 141.666 | 2 | 55 | PER | 48.2 | 6.5 | 2 |
| 2024 | 8 | 14 | 9.27 | 141.741 | 2 | 25 | PER | 23.4 | 4.7 | 2 |
| 2024 | 8 | 14 | 10.17 | 141.777 | 1 | 9 | PER | 16.5 | 5.5 | 1 |
| 2024 | 8 | 14 | 11.17 | 141.817 | 1 | 15 | PER | 20.9 | 5.4 | 1 |
| 2024 | 8 | 14 | 22.40 | 142.267 | 3 | 11 | PER | 21.1 | 6.4 | 2 |
| 2024 | 8 | 14 | 23.41 | 142.307 | 5 | 45 | PER | 24.1 | 3.6 | 4 |
| 2024 | 8 | 15 | 0.53 | 142.352 | 9 | 83 | PER | 25.5 | 2.8 | 7 |
| 2024 | 8 | 15 | 1.50 | 142.391 | 12 | 120 | PER | 21.3 | 1.9 | 6 |
| 2024 | 8 | 15 | 9.42 | 142.707 | 4 | 35 | PER | 18.6 | 3.1 | 3 |
| 2024 | 8 | 16 | 1.29 | 143.343 | 15 | 133 | PER | 20.4 | 1.8 | 5 |
| 2024 | 8 | 16 | 9.98 | 143.691 | 4 | 15 | PER | 8.6 | 2.2 | 2 |
| 2024 | 8 | 17 | 1.75 | 144.322 | 3 | 39 | PER | 15.1 | 2.4 | 1 |
| 2024 | 8 | 25 | 20.91 | 152.793 | 1 | 1 | PER | 2.3 | 2.3 | 1 |
| 2024 | 8 | 26 | 20.67 | 153.748 | 2 | 4 | PER | 6.0 | 3.0 | 1 |
| 2024 | 8 | 28 | 20.83 | 155.686 | 2 | 1 | PER | 1.4 | 1.4 | 1 |
| 2024 | 8 | 30 | 22.38 | 157.682 | 3 | 12 | PER | 8.6 | 2.5 | 1 |

Figure 4. ZHR Perseids in 2024
At first glance it seems like a normal Perseid year with a normal ZHR progression. However, this is more nuanced. We zoom in again to the period 10 to 15 August in Europe and America.
August 10/11: Europe & America
For this night we find the ZHR values that are normal around that period. Slowly increasing ZHRs between 30 and 40.
August 11/12: Europe & America
This night the observers in both Europe and America were also “treated” to a beautiful aurora show in addition to the Perseids. Especially the observers in the northern part of Europe saw the phenomenon, but the author also saw the aurora from the south of France.
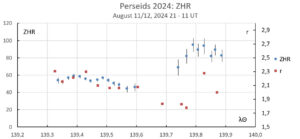
Figure 5. ZHR and population index r of the Perseids on August 11/12, 2024.
Figure 5 shows the zoomed-in ZHR graph with the population index r added based on the magnitude interval [–2;5]. The Perseids ZHR over Europe was fairly stable with an average ZHR of 50 and values around the average population index r. At the end of the night, the ZHR and r value dropped slightly. In America it then got dark (from λꙨ = 139.7° onwards) and the ZHR appeared to be a lot higher. The ZHR increased from 70 to 90. Unfortunately, this concerned data from only two experienced observers, but both have been active for a very long time. A striking number of bright meteors resulted in a lower population index r, especially on August 12, 2024 between 7h and 9h UT respectively between λꙨ = 139.730° and 139.810°. This coincided with the highest ZHR values that night (ZHR 95). After that, the ZHR decreased slightly, but not as fast as the rising edge increased. This may be related to the approaching annual Perseid maximum between solar longitude 140.0° and 140.1°, whereby the decrease was partly undone by the increase in Perseids belonging to the annual maximum. The increasing population index r could also be explained by this. Incidentally, the annual maximum was not observed because it ultimately fell after sunrise in America.
Peter Jenniskens gave a filament passage around 9h UT with an extra ZHR of 16 (Rendtel, 2024). With the maximum ZHR of 95, this means that the ZHR without the filament was 80, a value that you would expect a few hours before the maximum. So, it seems like a consistent story. But in all fairness, we must also admit that the dust trail prediction of Jéremie Vaubaillon also fits in. In particular, the appearance of bright Perseids (old dust trails) confirmed his prediction. It can be compared with the old dust trail story in 2023 on 12 Aug around 01h UT, with the old dust trail from 68 BC. It leads to barely an increase in ZHR, but to a clearly lower population index r with a part of the bright Perseids belonging to the old dust trail.
Figure 6 shows the same graph as in Figure 4, but now supplemented with the radio ZHRr curve. From the radio ZHRr calculated by Hirofumi Sugimoto (Sugimoto,2017; Sugimoto and Ogawa, 2023) there is a peak around solar longitude 139.75° and a second peak around 140.03°. The latter may be the annual maximum, the first the filament of Peter Jenniskens and/or the old dust trails of Jéremie Vaubaillon. The first radio ZHRr peak did not fall at exactly the same time as the visual peak. This may have to do with the brightness distribution of the meteors, where for example the radio peak consisted of many weak Perseids. But the latter remains speculation of course.
It must be said that the radio observation method is a completely different observation method. The numerical results cannot be compared with each other. The point here is to see whether the shape of the graph from the observed radio activity can be compared with what has been observed visually.
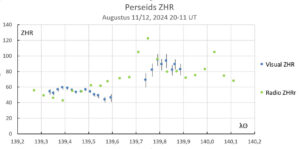 Figure 6. Perseid visual ZHR and radio ZHRr between 11 August 2024, 21h UT and 12 August 2024, 11h UT. The error bars of the US observers are larger because smaller numbers of meteors were used. The green points are the radio ZHRr points. The annual maximum of the Perseids is usually between λꙨ = 140.0° and 140.1°.
August 12/13, 2024: Europe & America
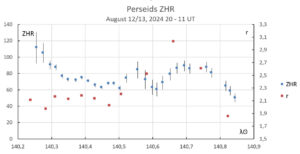
Figure 7. Population index r and ZHR of the Perseids on August 12/13, 2024
Also, this night, aurora was visible from a large part of Europe. This night went as you would expect for Europe: decreasing ZHRs from 110 to 60, see Figure 7. However, as seen from America the ZHR started to rise again. A weak peak was detected on August 13, 2024 around 07h–08h UT (solar longitude ~140.7°) with a ZHR of 90. Maybe this was a recurrence of the peaks that previously occurred between 2018 and 2022? The population index r value behaved rather strangely, from a very high population index r = 3.0 a value of 1.8 was reached at the end of the night.
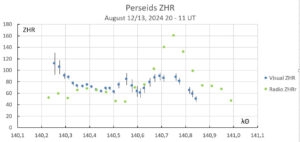
Figure 8. Visual ZHR and Radio ZHRr compared.
Radio observations confirmed the peak more clearly than the visual data, see Figure 8. This suggests that the peak consisted of fainter Perseids, just like in 2018. Bob Lunsford’s observations at the end of the American night showed a low population index r: many bright Perseids. This may be a different structure than the visual and radio peak earlier that night. Of course, this is also speculation. These conclusions are based on observations from only three observers, but all have been active for many years. Table 3 gives an overview of all years with the peak around λꙨ = 141°.
Table 3. Comparison of the λꙨ =141 outbursts of 2018, 2019,2020, 2021, 2022, 2023 and 2024.
| Visual | Radio | Remarks | |||||
| Year | λꙨ | ZHR | Pop. Index r | Year | λꙨ | ZHRr | |
| 2018 | 140.935 | 86 ± 6 | r[–2;5] 2.06 ± 0.05 | 2018 | ~ | ~ | No outburst in radiodata |
| 2019 | ~ | ~ | ~ | 2019 | 141.020 | 81 ± 4 | No visual observations |
| 2020 | 140.632 | 80 ± 15 | r[–2;5] 2.31 ± 0.28 | 2020 | 140.612 | 84 ± 10 | |
| 140.711 | 91 ± 16 | r[–2;5] 2.49 ± 0.30 | 140.772 | 80 ± 6 | |||
| 140.765 | 91 ± 17 | r[–2;5] 2.76 ± 0.28 | |||||
| 2021 | 141.489 | 195 ± 16 | r[–1;5] 2.76 ± 0.22 | 2021 | 140.495 | 220 ± 20 | |
| 2022 | ~ | ~ | ~ | 2022 | 140.800 | 80 ± 15 | Outburst? |
| 2023 | 140.820 | 167 ± 39 | r[–2:5] 2.13 ± 0.26 | 2023 | 140.820 | 126 ± 5 | |
| 2024 | 140.694 | 90 ± 7 | r[–2;5] 2.80 ± 0.19 | 2024 | 140.750 | 160 ± 5 | |
August 13/14, 2014: Europe
When it got dark over Europe the population index r was still low, but we do not suggest that it was low the entire period in between. See also Figure 9. We simply do not know because there are no observations. It is also striking that the ZHR showed a peak of around 60 around the same time. After that the activity quickly decreased to a normal value of around 40 and a normal population index r. The author saw normal activity during the short clearing halfway through the night.
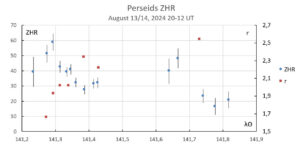
Figuur 9. Population index r and ZHR of the Perseids on August 13/14, 2024.
Summary
2024 brought an interesting Perseid appearance. Thanks to a careful selection of data based on fixed criteria it was possible to detect activity of the Jenniskens filament and/or the old dust trails of Vaubaillon, as well as to detect activity of the “new” peak around λꙨ = 141°.
Acknowledgments
A very big thank you to all observers of the Perseids 2024! Without your data this analysis would not be made. These observers are:
Prabhakaran Andiappan, Rainer Arlt, Pierre Bader, Hasret Balcioglu, Ivaylo Belchev, Sánchez Orlando Benítez, Hans Betlem, Felix Bettonvil, Ido Braun, Steve Brown, Enora Bureau, Peinado Cedric, Alexandra Chobanova, Sandra Cvirikova, Tal Dagan, Pian Maria Dal, Adeline De Colygne, Michel Deconinck, Korneel Dejonghe, Vincent Desperres, Julie Dostalova, Marie Dostálová, Radek Drlik, Nora Drlíková, Jaroslaw Dygos, Garry Dymond, Parreño Valentín Díaz, Shlomi Eini, Frank Enzlein, Lukas Ferkl, Martin Fuchs, Aude G., Kai Gaarder, Christoph Gerber, William Godley, Thierry Gonnord, Mitja Govedič, Matthias Growe, Dino Gržinić, Pavol Habuda, Torsten Hansen, Lukas Hreha, Patrik Hrobarik, López Gerardo Jiménez, Carl Johannink, Paul Jones, Hansub Jung, Javor Kac, Václav Kalaš, Kapuš, Omri Katz, André Knöfel, Jiri Konecny, Kryštof Kouřil, Natálie Kouřilová, Jana Krajčiová, Vladimir Vratko Krejci, Lukas Krejzlik, Marian Kresan, Danila Kudryavzev, Maciej Kwinta, Scott Lancelle, Mikulas Lazar, Gabay Irit Levhar, Anna Levin, Beáta Lešková, Gang Li, Robert Liska, Ivana Liskova, Hartwig Luethen, Robert Lunsford, Miloslav Macháček, Oleksandr Maidyk, Pierre Martin, Nikoleta Martinakova, Picar Antonio Martinez, Adam Martiš, Fabrizio Melandri, Frederic Merlin, Peter Mikloš, Matyas Mikula, Koen Miskotte, Jan Mocek, Sirko Molau, David Mudrák, Jaroslav Navratil, Rafael Neumann, Jos Nijland, Mohammad Nilforoushan, González Francisco Ocaña, Boris Pankovcin, Jaroslav Pastorek, Lovro Pavletic, Vera Peckova, Blanka Pickova, Irena Pickova, Sasha Prokofyev, Stefan Puci, Tobias Pudl, Elin Putzeys, Josef Pěček, Ella Ratz, Denis Reichel, Ina Rendtel, Jurgen Rendtel, Sina Rezaei, Adrián Rečičár, Filipp Romanov, Hannah Roovers, Bohus Rosko, Boris Rosko, Terrence Ross, Jakub Sabela, Stefan Schmeissner, Alex Scholten, Ivan Sergey, Ann Shesterikova, Costantino Sigismondi, Ulrich Sperberg, Sergey Stariy, Wesley Stone, Petra Strunk, Peiyuan Sun, Jana Thys, Martin Tichý, Matúš Tichý, Snežana Todorović, Tomáš Toma, Martin Tran, Marcela Vaclavikova, Lex Van Hecken, Peter van Leuteren, Hendrik Vandenbruaene, Michel Vandeputte, Jan Verfl, Lev Vladimirovich, Radim Volek, Martina Vyhnálková, Dita Větrovcová, Haorui Wang, Thomas Weiland, Roland Winkler, Anna Wrnatova, Frank Wächter, Sabine Wächter, Calum Young, Jakub Černý Roman, Čečil, Stanislava Šimová, Juraj Štefina, Ján Štefina and Mário Žársky.
A word of thanks goes to Hiroshi Ogawa and Hirofumi Sugimoto for providing the radio observations. And a word of thanks also to Carl Johannink & Michel Vandeputte for critically reading and commenting on this article. Finally a big thank you to Paul Roggemans for checking my English.
References
[1] Rendtel J. et al, Meteor Shower Calendar 2024 IMO.
[2] Jenniskens P.J., Meteorshowers and their Parent Comets, table 5d, p. 663, Cambridge University Press.
[3] Ogawa H., H. Sugimoto: radio 2024 Perseids 2024 by worldwide radio meteor observations, eMeteornews, Vol 9-5, p. 350-352.
[4] Steyeart C., Populatie indexbepaling : methode en nauwkeurigheid, Technische Nota nr. 5 VVS Werkgroep Meteoren, september 1981.
[5] Miskotte K., Perseïden in 2023: weer een uitbarsting rond λ 141 en wellicht ook activiteit van het stofspoor van 68BC gedetecteerd, Radiant 2023-4 p.
[6] Miskotte K., Perseïden 2018: een analyse van de visuele waarneemdata, Radiant 41-2, p. 27-35.
[7] Miskotte K., The Perseids in 2018 analysis of the visual data, eMN 2019-3, p. 135 – 142
[8] Miskotte K., Vandeputte M., Perseïden 2019 Opnieuw een piek in activiteit rond zonslengte 141,0?, Radiant 42-1, p. 100-103.
[9] Miskotte K., Vandeputte M., Perseids 2019: another peak in activity around solar longitude 141.0?, eMN 2020-1, p. 25-29.
[10] Miskotte K., Perseïden 2020: voor de derde keer een uitbarsting rond zonslengte 141° graden?
[11] Miskotte K., Perseids 2020: again, enhanced Perseid activity around solar longitude 141? Meteornews 2020-6 p. 395-397.
[12] Miskotte K., Perseids 2020 revisited, Radiant 42-6, p. 162-163
[13] Miskotte K., Perseids 2020 revisited, eMN 2021-1. 29-30.
[14] Jenniskens P., Miskotte K., eMN 2021-6-p.260-261.
[15] Miskotte K., Sugimoto H., Martin P., The big surprise: a late Perseid outburst!, eMN 2021-7, p. 517-525.
[16] Miskotte K., Sugimoto H., Martin P., De Perseïden uitbarsting van 14 augustus 2021, Radiant 2021-3, p. 51-58.
[17] Roggemans, P. (2023). “Unusual Perseid activity in 2023”. eMN 2023-5, p. 288-289.
[18] Sugimoto H., Ogawa, H., Perseids 2023 by worldwide radio meteor observations, eMN 2023-5, p. 285-287.
[19] Sugimoto H. (2017). “The New Method of Estimating ZHR using Radio Meteor observations”. eMetN, 2, 109–110.

