The chi Cygnids (from now on referred to as CCY) were discovered in September 2015 by Peter Jenniskens, Martin Breukers and Carl Johannink. This happened during the processing of the CAMS data of the networks CAMS BeNeLux and CAMS California for the night 14–15 September 2015 [Jenniskens, 2015]. A publication by Jakub Koukal et al. (Koukal et al, 2016) suggested that the meteor shower shows some additional activity every five years.
The CCY in 2020
On August 27, 2020, Peter Jenniskens reported that the CCY meteor shower was active again, some activity was detected by southern CAMS networks on August 21 [Jenniskens, 2020a]. There was a possibility that a maximum would be reached around September 15. Indeed, a good number of CCY were recorded with CAMS [Jenniskens, 2020b & Johannink, 2020].
The question arose to the author how this would be visually visible. The author was able to observe 4 nights in September and 4 possible CCY meteors were seen (Miskotte, 2020a & Miskotte 2020b). Well-known Norwegian meteor observer Kai Gaarder (Gaarder, 2020) also wrote a report on his CCY observations [8].
This article gives the result of the calculations on the visual observations of the CCY in 2020. The problem here is of course that it concerns low level activity, in which the chance that sporadic meteors also line up with the large CCY radiant is quite high. On the other hand, It seems that there is little chance of much sporadic pollution, the area of the sky where the CCY radiant is produces little sporadic activity and if something of a meteor shower appears there that immediately stands out.
Collecting the visual CCY data
Data was collected on the IMO website at: https://www.imo.net/members/imo_live_shower?shower=CCY&year=2020
In total, 127 CCY were reported by 13 observers. The minimum hourly count was 0, maximum hourly counts were up to 7. The latter number was under very sublime circumstances (Lm 6.8). The collected data was then checked for the following:
• The observations from CAMS BeNeLux in 2020 were used for the radiant positions.
• Radiant heights lower than 25 degrees were not used.
• Observations made with limiting magnitudes lower than 5.8 were not used.
• Very short single observation periods were not used.
• Short observation periods were merged if necessary and if possible.
• In the ZHR calculations an assumed population index r of 3.00 was used, because relatively little bright CCY meteors were seen.
• Of course, the weighted mean was calculated when averaging the individual ZHRs.
• A good Cp has been determined for most of the observers.
After this a total of 107 CCY remained for the analysis. The results of all calculations are shown in table 1 and figures 1, 2 and 3.
Table 1. ZHR of the CCY in September 2020.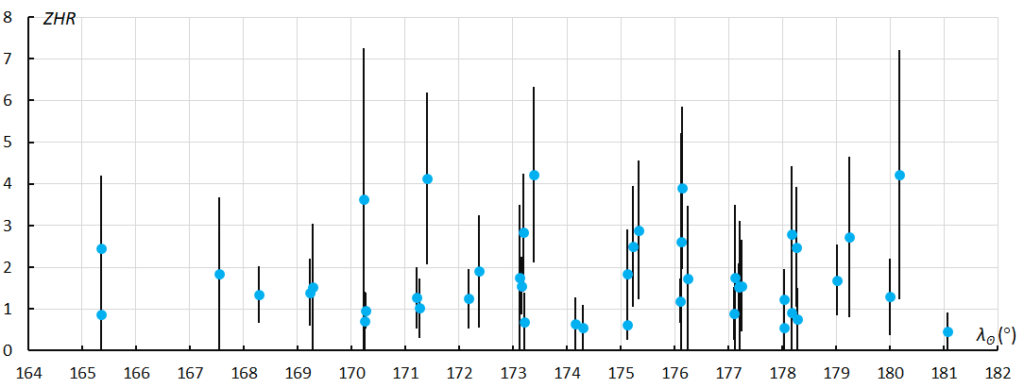
Figure 1: Individual ZHR values of the CCY. The period shown is from 6 to 24 September 2020.
In Figure 1 we see all individual ZHR values of the observers. On average, these are between 1 and 4.
Table 1. ZHR of the CCY in September 2020.
| Day | t/m UT | λʘ | nPer | nCCY | ZHR | Dev | r[-2;5] | nOBS |
| 7 | 19.72 | 165.351 | 2 | 3 | 1.7 | 0.6 | 3 | 2 |
| 10 | 2.00 | 167.547 | 1 | 1 | 1.8 | 1.8 | 3 | 1 |
| 10 | 20.28 | 168.288 | 1 | 4 | 1.3 | 0.3 | 3 | 1 |
| 11 | 20.15 | 169.255 | 2 | 4 | 1.5 | 0.4 | 3 | 2 |
| 12 | 20.59 | 170.246 | 3 | 7 | 1.8 | 0.3 | 3 | 3 |
| 13 | 20.94 | 171.293 | 3 | 9 | 2.1 | 0.2 | 3 | 3 |
| 14 | 22.50 | 172.171 | 2 | 5 | 1.6 | 0.3 | 3 | 2 |
| 15 | 21.59 | 173.071 | 5 | 15 | 2.2 | 0.1 | 3 | 5 |
| 16 | 22.55 | 174.224 | 2 | 2 | 0.6 | 0.3 | 3 | 2 |
| 17 | 22.41 | 175.195 | 4 | 12 | 2.0 | 0.2 | 3 | 4 |
| 18 | 22.05 | 176.157 | 4 | 11 | 2.4 | 0.2 | 3 | 4 |
| 19 | 23.01 | 177.173 | 5 | 11 | 1.5 | 0.1 | 3 | 5 |
| 20 | 23.25 | 178.160 | 6 | 12 | 1.5 | 0.1 | 3 | 6 |
| 21 | 22.96 | 179.127 | 2 | 6 | 2.2 | 0.4 | 3 | 2 |
| 22 | 22.53 | 180.088 | 2 | 4 | 2.7 | 0.7 | 3 | 2 |
| 23 | 22.71 | 181.074 | 1 | 1 | 0.5 | 0.5 | 3 |
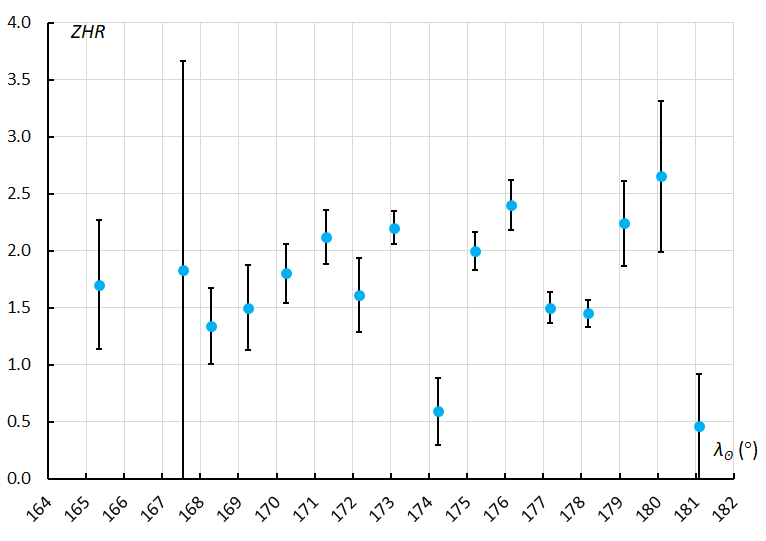
Figure 2. ZHR curve CCY 2020 per night. The period shown is from September 6 to 24, 2020. Based on Table 1 and 107 CCY.
Figure 2 shows the result after averaging (weighted average) of the individual ZHR points per night. The result is a bit messy and some ZHR points show large deviations. After this the author looked more critically at the ZHR points, see for example the point at λ 167.55 degrees.
- ZHR values with deviation greater than 0.5 were removed
- ZHR values whose deviation is the same as the ZHR were removed
This yielded Table 2 and Figure 3 (based on 98 CCY).
Table 2. ZHR CCY in September 2020 after removal of “critical” ZHR points.
| Day | t/m UT | λʘ | nPer | nCCY | ZHR | Dev | r[-2;5] | nOBS |
| 10 | 20.28 | 168.288 | 1 | 4 | 1.3 | 0.3 | 3 | 1 |
| 11 | 20.15 | 169.255 | 2 | 4 | 1.5 | 0.4 | 3 | 2 |
| 12 | 20.59 | 170.246 | 3 | 7 | 1.8 | 0.3 | 3 | 3 |
| 13 | 20.94 | 171.293 | 3 | 9 | 2.1 | 0.2 | 3 | 3 |
| 14 | 22.50 | 172.171 | 2 | 5 | 1.6 | 0.3 | 3 | 2 |
| 15 | 21.59 | 173.071 | 5 | 15 | 2.2 | 0.1 | 3 | 5 |
| 16 | 22.55 | 174.224 | 2 | 2 | 0.6 | 0.3 | 3 | 2 |
| 17 | 22.41 | 175.195 | 4 | 12 | 2.0 | 0.2 | 3 | 4 |
| 18 | 22.05 | 176.157 | 4 | 11 | 2.4 | 0.2 | 3 | 4 |
| 19 | 23.01 | 177.173 | 5 | 11 | 1.5 | 0.1 | 3 | 5 |
| 20 | 23.25 | 178.160 | 6 | 12 | 1.5 | 0.1 | 3 | 6 |
| 21 | 22.96 | 179.127 | 2 | 6 | 2.2 | 0.4 | 3 | 2 |
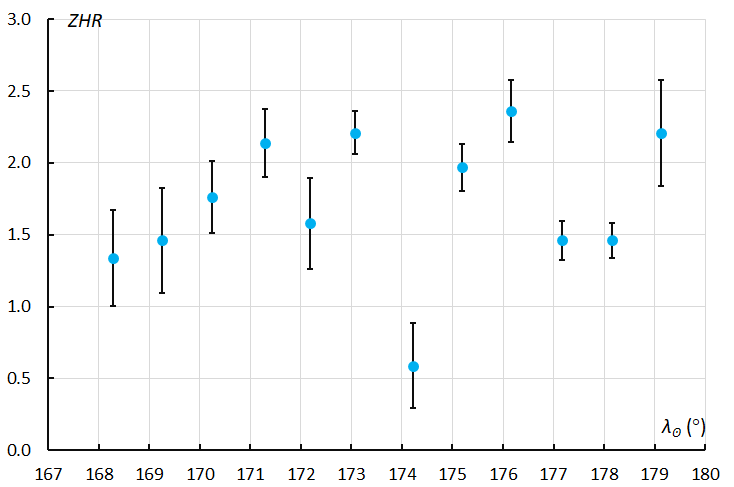
Figure 3. ZHR CCY after removal of “critical” ZHR points. The period shown is September 10-21, 2020.
The result is a somewhat better graph. The ZHR increases regularly, but after this the curve is somewhat variable. A dip is visible just after solar longitude 174. If we compare figure 3 with figure 4 from the recent article about the CCY in 2020 by Peter Jenniskens in WGN (Jenniskens, 2020b), we also see a dip around solar longitude 174-175! This fact give some confidence in the end result of this analysis!
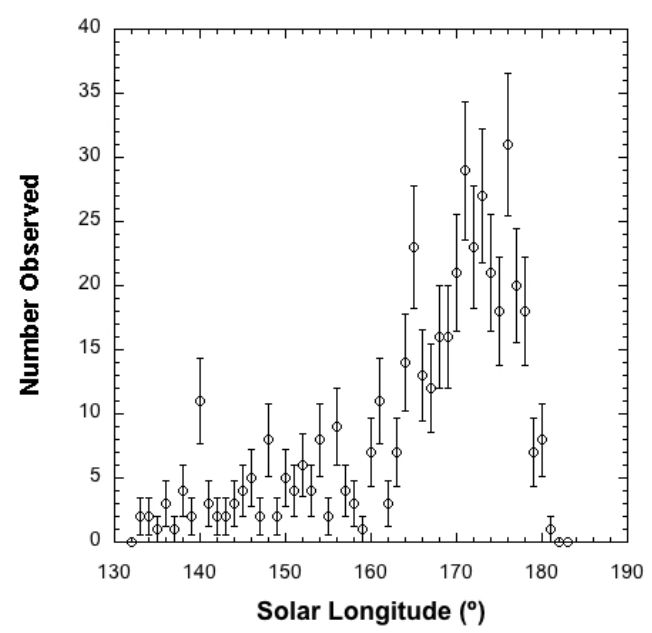
Figure 4. Activity curve (no ZHR) of the detected Chi Cygnids by CAMS networks worldwide per 1 degree intervals. The figure comes from (Jenniskens, 2020b).
Conclusion
Clearly, in 2020 the ZHR of the CCY meteor shower was between 1 and 2.5. The problem of contamination from sporadic meteors radiating from the same area of the sky as the CCY meteors does not seem to play a role in this analysis. For example, the dip found around solar longitude 174-175 is visible in both the visual and CAMS analyzes. Individual ZHRs are between 1 and 4. The run-up is nicely increasing to the “maximum”, after that activity becomes a bit variable. It is recommended to observe this meteor shower under sublime observing conditions.
Acknowledgment
Thanks to all observers who observed the Chi Cygnids in 2020! These are Pierre Bader, Tim Cooper, Kolyo Dankov, Kai Gaarder, Christoph Gerber, Matthias Growe, Glenn Hughes, Oleksandr Maidyk, Koen Miskotte, Ina Rendtel, Jurgen Rendtel, Ulrich Sperberg and Roland Winkler. Thanks also to Carl Johannink and Michel Vandeputte for reading this article critically. Thanks to Paul Roggemans for checking the English translation.
References
Gaarder K. (2021), September observations of the CCY, SPE AND STA from Norway, eMet 2021-6, p. 52-53.
Jenniskens P (2015), New Chi Cygnids Meteor Shower, Central Bureau Electronic Telegrams, No. 4144, #1.
Jenniskens P. (2020a). “Possible upcoming return of the chi Cygnids in September 2020”. eMetN, 2020-5, 287–289
Jenniskens P. (2020b). The 2020 Chi-Cygnids, WGN, Journal of the International Meteor Organization, vol. 48, no. 5, p. 146-149.
Johannink C. (2020), De χ Cygniden: opnieuw activiteit dit jaar, Radiant 2020-5 p. 128-131.
Koukal J., Sbra J., Toth J. (2016), Confirmation of the chi Cygnids (CCY, IAU#757),WGN, Journal of the International Meteor Organization, vol. 44, no. 1, p. 5-9.
Miskotte K. (2020a), Op jacht naar χ-Cygnide, Radiant 2020-5 p. 126-127
Miskotte K. (2020b), Chasing the 2020 Chi-Cygnids (CCY#757), eMetN 2020-5 p. 439-440

