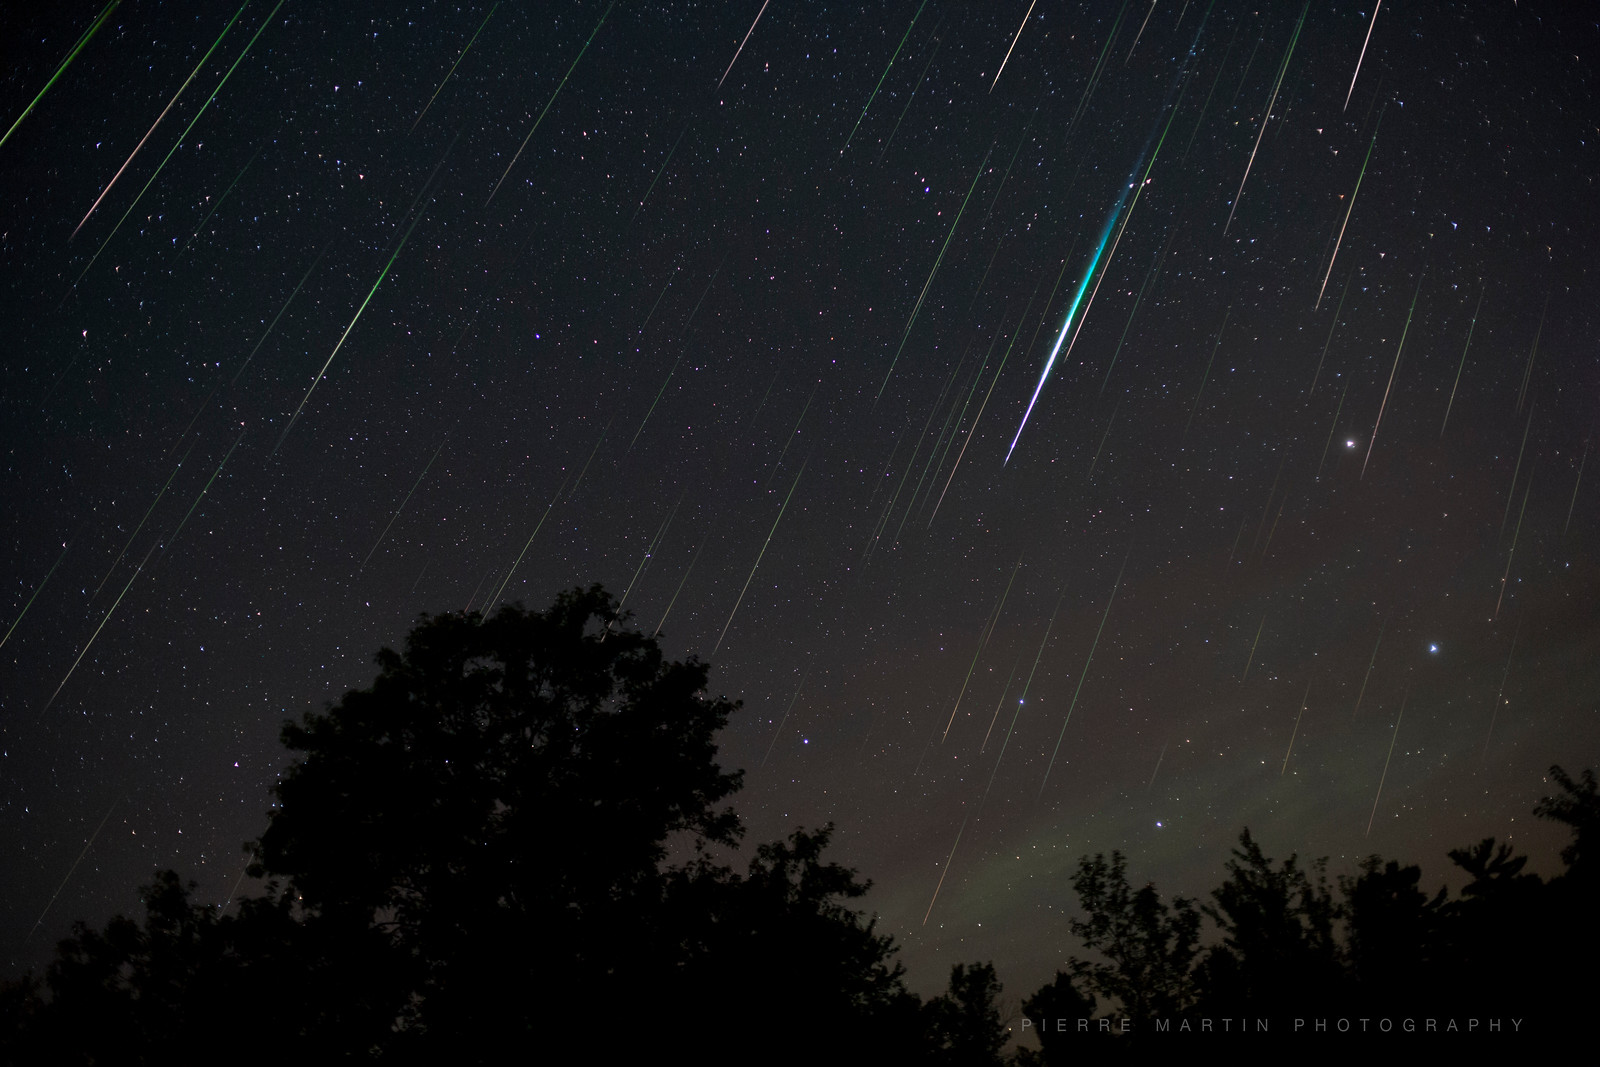
Brilliant composite image of 110 Perseids captured, using a Canon 5D at ISO1600, 20 seconds exposures and a Canon 50mm f/1.4 lens (set at f/2.2). Location: Balsam Provincial Park on the Kawartha Lakes. Image credit: Pierre Martin, Ottawa, Canada.
An interesting Perseids return occurred in 2015, leading up to the 2016 appearance of the stream when a significantly increased activity is expected due to the presence of multiple dust trails from e.g. 1076 and 1862. On 13 August 2015 increased activity has been observed over North America coinciding with the traditional Perseid maximum (ZHR 120 – 140 instead of 100). Another short peak was observed from Europe around 21h UT. It is possible that this was just the end of the increased activity over Asia around 18h39m UT which had been predicted by Jérémie Vaubaillon or otherwise, an earlier than expected appearance of the filament which was predicted for 12 August 2015 around 23h UT (Jenniskens, 2006). Unfortunately this could be confirmed neither by radio, nor by CAMS observations.
1 Introduction
In May and June 2015 I made a global analysis of the 2015 Lyrids (Miskotte, 2015). I used the data which had been submitted by many observers to the IMO. This was the first time that I made an analyses based on data not provided by Dutch Meteor Society observers. The result was rather satisfactory and I decided to repeat this work with the Perseid data for this year. I was aware that this would be a much bigger job to do than in the case of the Lyrids.
However, there will never be any real global analyses in the sense of a continuous 24/24 and 7/7 monitoring of the Perseids. There are always interruptions in the dataset, about 4 hours due to the Atlantic Ocean between Europe and America and another 8–10 hours due to the Pacific Ocean between America and Asia. Looking at the activity profile “on-the-fly” on the IMO website, we can see that this graph is based on 40000 reported Perseids[1]. After the appearance of eRadiant 2015-3 I started to collect the data. The results are presented in this article.
2 The observational data
The data has been collected observer by observer selecting and sorting the data in function of the limiting magnitude. This data can be consulted via a webpage, sorted on the date[2]. A hyperlink on the name of the observer allows accessing the observing report. Observations made with a limiting magnitude of less than +5.9 were ignored. These reports could be easily copied and pasted into an Excel spreadsheet and saved with the date and IMO code as filename. For instance the observations of Michel Vandeputte of 11-12 August were saved as 2015_08_11_12_VANMC. This way all the data could be stored in a chronologic way.
In the next step, the hourly rate data from these observations were copied into the spreadsheet for the ZHR computation. The magnitude distributions were stored separately with the average limiting magnitude in order to calculate the population index r. In total the data for about 27000 Perseids was copied into the ZHR spreadsheet, or 65% of the total number of the reported Perseids. The remaining 13000 Perseids were ignored due to too poor limiting magnitudes.
3 Determining the Cp
To obtain a reliable ZHR value we need some information about each individual observer as the number of meteors seen depends on the perception of each individual. This value is known as the perception coefficient Cp. This is a value which qualifies the alertness of the observer. To obtain these perception coefficients we compare the observed sporadic hourly rate for August, observed between 22h and 2h local time with the assumed sporadic hourly rate of 10 with a limiting magnitude of +6.5, valid for the standard observer. The observed hourly rates are corrected relative to the +6.5 limiting magnitude reference.
To obtain a reliable estimate of the coefficient Cp for an observer at least 15 observing periods should be used. Unfortunately many observers didn’t provide so many different observing periods. For all observers with at least 3 different observing periods, the sporadic hourly rate data was stored in the Cp spreadsheet in order to add past or future observational data for these observers in order to obtain a reliable Cp coefficient for them. This data can be used in future analyses with data from these observers. A new Cp determination will be done after 5 to 10 years for each observer as this may vary over a long period of time. From my own experience I know that my Cp coefficient was 1.4 in the 1980s, but remained constant at 1.2 in later years. In southern France this parameter is about 1.3 in my case.
This, together with the determination of the population index r and the ZHR calculation resulted in the conclusion that according to me we can distinguish four groups of observers:
Beginning observers
Sub group 1: Observers with both moderate magnitude estimates and moderate hourly counts, due to a lack of experience, fatigue or lack of concentration. This results in a large fluctuation in their ZHR-values, extreme r-values, extreme limiting magnitudes (too low or too high) and sometimes very deviant Cp values.
Subgroup 2: Observers with moderate magnitude estimates but with reliable hourly counts and a good concentration. These are suitable for both Cp and ZHR calculations.
Experienced observers
Subgroup 1: Observers who record significant numbers of major shower meteors, but taking also the minor meteor showers into account too. Taking into account more radiants for the shower classification, smaller numbers of meteors remain as sporadics, resulting in a too low Cp value and hence too high ZHRs. In general this group has very good magnitude distributions and counts for the major shower. This is good to calculate the ZHR, less favorable for the Cp. An obvious solution is to add the minor shower counts with the sporadics in order to have Cp values compatible with those for other observers. For a number of observers this was effectively applied and the resulting ZHRs were more in line with the average for all observers active at the same time.
Subgroup 2: Observers who distinguish only the major shower meteors and sporadics. This results in reliable Cp values and the ZHRs from this data compare very well. The data from these observers is most suitable for the calculation of the population index r, the perception coefficient Cp and the ZHRs.
Finally I obtained a long list of observers (Table 1), with their IMO code, their Cp value, the number of periods used to obtain the Cp value, the year and the country. In the ZHR spreadsheet only Cp values were applied if this perception coefficient was obtained from at least 15 observing periods. For observers with less than 15 periods available, a Cp = 1.0 has been assumed as best estimate, unless the number of periods could be extended with data from 2014. Classifying the observers within the four groups described above, led to the following conclusion:
“Use only the most relevant data of observers for the calculation of the population index r and the ZHRs.”
This means that for some observers in some cases only the counts have been selected for ZHR calculations and in some other cases only the magnitude distributions to calculate the population index.
Table 1 – The list of observers whose Perseid observations have been used in this analyses together with their perception coefficient Cp. (*) identifies the calculated Cp values while all other were assumed to be 1.0. (†) indicates that the calculated Cp value was replaced by 1.0 as the application of the calculated value resulted in systematic too high or too low ZHRs.
| Name | IMO code | Cp | Year(s) | Intervals | Country |
| Marina Arnaut | ARNMA | 0.8* | 2015 | 23 | Serbia |
| Atieh Sadat Afzali | ATIAF | 1.0 | 2015 | 1 | Iran |
| Ioan Alexandru Babiuc | BABIO | 1.0 | 2015 | 4 | Romania |
| Orlando Benítez Sánchez | BENOR | 1.1* | 2015 | 15 | Spain |
| Felix Bettonvil | BETFE | 1.0 | 2015 | 7 | Croatia |
| Martina Birosikova | BIRMA | 1.0 | 2014/2015 | 11 | Slovakia |
| Maja Bjelanovic | BJEMA | 0.6* | 2015 | 12 | Serbia |
| Ilija Bogdanovic | BOGIL | 0.7* | 2015 | 17 | Serbia |
| Ljubomir Brankovic | BRALJ | 1.0* | 2015 | 36 | Serbia |
| Andreas Buchmann | BUCAN | 1.1* | 2015 | 4 | Switzerland |
| Ivana Burmazovic | BURIV | 0.9* | 2015 | 13 | Serbia |
| David Buzgo | BUZDA | 1.7* | 2015 | 21 | Serbia |
| Matej Ciganj | CIGMA | 1.0 | 2015 | 2 | Croatia |
| Ilie Cosovanu | COSIL | 1.0 | 2015 | 2 | Romania |
| Martin Dana | DANMA | 4.4† | 2015 | 5 | Slovakia |
| Anja Djajic | DJAAN | 1.0 | 2015 | 3 | Serbia |
| Audrius Dubietis | DUBAU | 1.3* | 2014/2015 | 15 | Lithuania |
| Jaroslaw Dygos | DYGJA | 0.6* | 2015 | 11 | Poland |
| Reza Ensandoost | ENSRE | 1.0 | 2015 | 1 | Iran |
| Frank Enzlein | ENZFR | 0.8* | 2015 | 8 | Germany |
| Branislav Faktor | FAKBR | 1.0 | 2015 | 2 | Slovakia |
| Martin Fuchs | FUCMA | 1.6† | 2015 | 4 | Czech Republic |
| Fujie Tang | FUJTA | 1.0 | 2015 | 2 | China |
| Gang Li | GANLI | 1.0 | 2015 | 3 | China |
| Kalina Georgieva | GEOKA | 1.0 | 2015 | 1 | Bulgaria |
| George Gliba | GLIGE | 0.7* | 2015 | 6 | U.S. |
| Mitja Govedi | GOVMI | 1.0* | 2015 | 14 | Slovakia |
| Ljubica Grasic | GRALJ | 1.0 | 2015 | 8 | Serbia |
| Shy Halatzi | HALSH | 1.5* | 2015 | 9 | Israel |
| Amir Hasanzadeh | HASAM | 1.0 | 2015 | 4 | Iran |
| Robin Hegenbarth | HEGRO | 1.0 | 2015 | 3 | Germany |
| Hojatola Hekmat’zade | HEKHO | 1.0 | 2015 | 4 | Iran |
| Davood Hemmati | HEMDA | 1.0 | 2015 | 1 | Iran |
| Carl Hergenrother | HERCA | 1.2* | 2015 | 5 | U.S. |
| Lukas Hreha | HRELU | 1.0 | 2015 | 2 | Slovakia |
| Milos Igrutinovic | IGRMI | 1.0 | 2015 | 2 | Serbia |
| Stefan Jackovic | JACST | 1.0* | 2015 | 18 | Slovakia |
| Jovana Jankov | JANJO | 1.9* | 2014/2015 | 20 | Serbia |
| Jixia Li | JIXLI | 2.5* | 2015 | 8 | China |
| Paul Jones | JONPA | 1.0 | 2015 | 7 | U.S. |
| Jovana Kabic | KABJO | 1.0 | 2015 | 3 | Serbia |
| Javor Kac | KACJA | 0.8* | 2014 | 15 | Slovakia |
| Javor Kac | KACJA | 1.0* | 2015 | 36 | U.S. |
| Alzbeta Kadlecova | KADAL | 1.4* | 2015 | 9 | Czech Republic |
| Georgiena Kaleva | KALGE | 2.6* | 2015 | 7 | Bulgaria |
| Václav Kala? | KALVA | 1.4* | 2015 | 5 | Czech Republic |
| Jozef Karlik | KARJO | 1.0 | 2015 | 8 | Slovakia |
| Jakub Kazimir | KAZJA | 1.0 | 2015 | 2 | Slovakia |
| Matus Kepic | KEPMA | 1.0 | 2015 | 2 | Slovakia |
| Zdenek Komarek | KOMZD | 0.5* | 2015 | 12 | Slovakia |
| Dusanka Kovacevic | KOVDU | 1.0 | 2015 | 4 | Serbia |
| Roman Kovalyk | KOVRO | 1.0 | 2015 | 1 | Italy |
| Jiří Kubánek | KUBJI | 1.0 | 2015 | 2 | Czech Republic |
| Peter van Leuteren | LEUPE | 1.0 | 2008 | 20 | The Netherlands |
| Anna Levina | LEVAN | 0.7* | 2014/2015 | 11 | Israel |
| Robert Lunsford | LUNRO | 1.0* | 2015 | 16 | U.S. |
| Boris Majic | MAJBO | 1.6* | 2015 | 13 | Serbia |
| Milica Maletic | MALMI | 1.0* | 2015 | 25 | Serbia |
| Ivana Marjanovic | MARIV | 0.9* | 2015 | 10 | Serbia |
| Pierre Martin | MARPI | 1.0* | 2007 | ? | Canada |
| Mikhail Maslov | MASMI | 1.0 | 2015 | 3 | Russia |
| naimeh masoumi | MASNA | 1.0 | 2015 | 2 | Iran |
| Istvan Matis | MATIS | 1.0 | 2015 | 8 | Romania |
| Alastair McBeath | MCBAL | 1.0 | 2015 | 4 | England |
| Bruce McCurdy | MCCBR | 1.0 | 2015 | 6 | Canada |
| Saeed Mehdizad | MEHSA | 1.0 | 2015 | 2 | Iran |
| Fabrizio Melandri | MELFA | 1.0 | 2015 | 6 | Italy |
| Frederic Merlin | MERFR | 1.0 | 2015 | 9 | France |
| Roman Mihalov | MIHRO | 1.0 | 2015 | 2 | Slovakia |
| Koen Miskotte | MISKO | 1.3* | 2015 | 62 | France |
| Koen Miskotte | MISKO | 1.2* | 1995 | ? | The Netherlands |
| Sirko Molau | MOLSI | 0.6* | 2015 | 14 | Germany |
| Alexsandr Morozov | MORAL | 1.0 | 2015 | 1 | Russia |
| Konstantin Morozov | MORKO | 1.0 | 2015 | 2 | Belorussia |
| Yulia Moralyiska | MORYU | 1.0 | 2015 | 2 | Bulgaria |
| Maryam Mostafavi Alhosseini | MOSMA | 1.0 | 2015 | 2 | Iran |
| Maciek Myszkiewicz | MYSMA | 1.0 | 2015 | 11 | Poland |
| Sven Näther | NÄTSV | 1.0 | 2015 | 2 | Germany |
| Sasa Nedeljkovic | NEDSA | 1.0 | 2015 | 3 | Serbia |
| Jos Nijland | NIJJO | 1.6 | 2015 | 4 | The Netherlands |
| Adam Nikic | NIKAD | 1.0 | 2015 | 12 | Serbia |
| Mohammad Nilforoushan | NILMO | 1.0 | 2015 | 5 | Iran |
| Vladimir Obradovic | OBRVL | 1.1* | 2015 | 12 | Serbia |
| Liliya Pachalova | PACLI | 1.0 | 2015 | 2 | Bulgaria |
| Parya Abouhamzeh | PARAB | 1.0 | 2015 | 2 | Iran |
| Igor Parnahaj | PARIG | 1.0 | 2015 | 2 | Slovakia |
| Debora Pavela | PAVDE | 1.0 | 2015 | 12 | Serbia |
| Dunja Pavlovic | PAVDU | 1.3* | 2015 | 27 | Serbia |
| Adam Pazderka | PAZAD | 1.0 | 2015 | 3 | Czech Republic |
| Ludovit Popik | POPLU | 1.1* | 2015 | 7 | Slovakia |
| poriya momen | PORMO | 1.0 | 2015 | 1 | Iran |
| Sasha Prokofyev | PROSA | 1.0 | 2015 | 1 | Cyprus |
| Antonija Radulovic | RADAN | 0.9* | 2015 | 16 | Serbia |
| Ella Ratz | RATEL | 1.0 | 2015 | 2 | Israel |
| Ina Rendtel | RENIN | 0.9* | 2015 | 20 | Scotland |
| Boris Rosko | ROSBO | 1.0 | 2015 | 2 | Slovakia |
| Terrence Ross | ROSTE | 0.9 | 2014 | 24 | U.S. |
| Terrence Ross | ROSTE | 0.9* | 2015 | 39 | U.S. |
| Katerina Ruseva | RUSKA | 1.0 | 2015 | 1 | Bulgaria |
| Mirco Saner | SANMI | 1.0 | 2015 | 10 | Switzerland |
| Branislav Savic | SAVBR | 1.1 | 2014 | 11 | Serbia |
| Branislav Savic | SAVBR | 1.1* | 2015 | 45 | Serbia |
| Alex Scholten | SCHAL | 0.7* | 2015 | 9 | Czech Republic |
| Matej Schwartz | SCHMA | 1.0 | 2015 | 2 | Slovakia |
| Stefan Schmeizer | SCHST | 0.7 | 2014 | 10 | Romania |
| Stefan Schmeissner | SCHST | 0.6 | 2014/2015 | 5 | Romania |
| Ivan Sergey | SERIV | 1.0 | 2015 | 2 | Belorussia |
| Shi Wei | SHIWE | 1.1* | 2015 | 6 | China |
| Shlomi Eini | SHLEI | 1.0 | 2015 | 3 | Israel |
| Vesna Slavkovic | SLAVE | 1.1* | 2015 | 7 | Serbia |
| Danica Spasic | SPADA | 1.0* | 2015 | 15 | Serbia |
| Jelena Spegar | SPEJE | 1.2* | 2015 | 24 | Serbia |
| Ivan Stankovits | STAIV | 1.5† | 2015 | 33 | Serbia |
| Anton Stipek | STIAN | 1.0 | 2015 | 1 | Croatia |
| Wesley Stone | STOWE | 1.1* | 2015 | 8 | U.S. |
| Matej Sustr | SUSMA | 1.0 | 2015 | 1 | Slovakia |
| Miroslav Tirpak | TIRMI | 1.0 | 2015 | 2 | Slovakia |
| Snezana Todorovic | TODSN | 0.8* | 2014/2015 | 29 | Serbia |
| Oliver Toskovic | TOSOL | 1.0 | 2015 | 4 | Serbia |
| Michel Vandeputte | VANMC | 1.3 | 2003 | ? | Belgium |
| Michel Vandeputte | VANMC | 1.3* | 2015 | 62 | France |
| Bozhena Varbanova | VARBO | 1.8* | 2015 | 5 | Bulgaria |
| Valentin Velkov | VELVA | 1.0 | 2015 | 7 | Bulgaria |
| Kristina Veljkovic | VERKR | 0.5† | 2015 | 28 | U.S. |
| Frank Waechter | WAEFR | 0.3 | 2015 | 8 | Germany |
| Sabine Waechter | WAESA | 0.6 | 2015 | 10 | Germany |
| Weiqiao Chen | WEICH | 1.0 | 2015 | 2 | China |
| Oliver Wusk | WUSOL | 0.8* | 2015 | 22 | Germany |
| Xicheng Tian | XICTI | 1.0 | 2015 | 4 | China |
| Yasuhiro Tonomura | YSTO | 1.0 | 2015 | 2 | China |
| Miroslav Zivanovic | ZIVMI | 1.3* | 2015 | 12 | Serbia |
4 Calculating the population index r
The population index could be quickly obtained by copy and paste of data from the spreadsheet with magnitude distributions into the spreadsheet for the population index r calculation. Only magnitude distributions obtained with a limiting magnitude of +5.9 or better have been used for this purpose. The selected magnitude distributions are copied into a spreadsheet designed by Carl Johannink where all the magnitude distributions are converted automatically to the standard conditions with a limiting magnitude of +6.5.
One problem occurred with the selection of the magnitude distributions to be used or to be rejected. Some observers report excessive many bright meteors while others report nothing brighter than +1. This kind of issues with the observing data results in deviant r-values. In a discussion with Carl Johannink we reached a consensus how to deal with this kind of problems: The difference between the average limiting magnitude and the average magnitude of the observed Perseids should not be larger than 4.5 magnitude.
For instance we had an observer for the night of 12–13 August with an average limiting magnitude of 6.82, reporting a significant number of Perseids with an average magnitude of +0.64. With a difference of 6.18 magnitudes this is definitely an outlier which is not suitable for the determination of the population index r. This approach worked out very well although some tolerance must be observed as the Perseids display some more bright meteors during the maximum. Rejected observations were considered case by case if these could be used for the calculation of the r-value, taking into account the degree of experience of the observer as well as the average magnitude of the Perseids.
5 Calculating the ZHR
ZHRs are calculted in the DMS according to the method of Peter Jenniskens (Jenniskens, 1994; Miskotte and Johannink, 2005a; 2005b):

where γ = 1.4 for the radiant elevation correction. When all data was entered into the ZHR spreadsheet, the calculated Cp’s were added as well as the computed results for the population index r. While entering the data, the following aspects were carefully checked:
- The effective observing time Teff: for the nights 10–11, 11–12, 12–13 and 13–14 August only half hour counts have been used. Some observers reported shorter intervals and these have been combined where possible. Intervals of at least 0.40 hour and maximal 0.60 hour were used. E.g. an observing session as short as 0.35 hour in a night was ignored.
For all other nights counts per hour have been used (0.75 until 1.5 hour). - Only observations obtained under a limiting magnitude LM of +5.90 or better have been used.
- Observations with the radiant elevation h less than 25° were ignored.
- Observations with an obstruction coefficient F larger than 1.1 were ignored.
At a next step the ZHR for each observer was considered using the Auto filter of Excel. The cause for extreme outliers was verified. In most cases this is just due to too high or too low limiting magnitudes, but in some cases the erroneous input of the geographical coordinates for the observing site resulted in deviant results. This happened for a single case. Real outliers were deleted.
6 The results: population index r
The results of the population index calculations are listed in Table 2. A total of 11819 Perseids have been used to compute the population index, the number of Perseids used per night or per period is listed in Table 2.
I have chosen to use the magnitude classes from –1 up to +5 to derive the r-values as most of the data was available for this magnitude range and moreover results were about the same as for a magnitude range of –2 up to +5.
Table 2 – Computed r values for the Perseids 2015.
The values in the column r[–1:+5] have been used for the ZHR calculation.
| Date | Until | λʘ | r[–2;+5] | nPer | r[–1;+5] | nPer | |
| 2015 | 8 August | 23 UT | 135.864 | 2.00 | 229 | 1.96 | 224 |
| 2015 | 10 August | 0 UT | 136.863 | 2.36 | 184 | 2.39 | 181 |
| 2015 | 10 August | 10 UT | 137.263 | 2.30 | 154 | 2.27 | 152 |
| 2015 | 11 August | 0 UT | 137.822 | 2.14 | 677 | 2.20 | 662 |
| 2015 | 11 August | 10 UT | 138.222 | x | 2.12 | 234 | |
| 2015 | 12 August | 00 UT | 138.782 | 2.33 | 1172 | 2.44 | 1148 |
| 2015 | 12 August | 7 UT | 139.042 | x | 2.25 | 116 | |
| 2015 | 12 August | 9 UT | 139.162 | 2.11 | 217 | 2.13 | 213 |
| 2015 | 12 August | 17 UT | 139.462 | 2.32 | 175 | 2.11 | 174 |
| 2015 | 12 August | 19 UT | 139.542 | x | x | ||
| 2015 | 12 August | 21 UT | 139.622 | 2.21 | 835 | 2.30 | 814 |
| 2015 | 12 August | 23 UT | 139.702 | 2.17 | 654 | 2.31 | 635 |
| 2015 | 13 August | 1 UT | 139.782 | 2.25 | 1738 | 2.29 | 1704 |
| 2015 | 13 August | 3 UT | 139.862 | 2.35 | 539 | 2.49 | 529 |
| 2015 | 13 August | 5 UT | 139.942 | 2.06 | 222 | 1.94 | 219 |
| 2015 | 13 August | 7 UT | 140.022 | 2.03 | 439 | 2.05 | 428 |
| 2015 | 13 August | 9 UT | 140.102 | 2.01 | 712 | 2.07 | 693 |
| 2015 | 13 August | 11 UT | 140.182 | 2.03 | 499 | 2.02 | 489 |
| 2015 | 13 August | 21 UT | 140.582 | 2.34 | 835 | 2.42 | 814 |
| 2015 | 13 August | 23 UT | 140.662 | 2.40 | 654 | 2.42 | 635 |
| 2015 | 14 August | 1 UT | 140.742 | 2.70 | 467 | 2.70 | 463 |
| 2015 | 14 August | 3 UT | 140.822 | 1.84 | 167 | 1.95 | 160 |
| 2015 | 14 August | 6 UT | 140.942 | 1.88 | 120 | 2.12 | 113 |
| 2015 | 14 August | 10 UT | 141.103 | 2.07 | 73 | 1.97 | 72 |
| 2015 | 14 August | 23 UT | 141.623 | 2.06 | 312 | 2.11 | 305 |
| 2015 | 15 August | 23 UT | 142.584 | 2.25 | 212 | 2.29 | 208 |
| 2015 | 16 August | 23,5 UT | 143.565 | 2.07 | 111 | 2.10 | 109 |
| 2015 | 17 August | 23 UT | 144.504 | x | 2.79 | 111 | |
| 2015 | 19 August | 0 UT | 145.509 | x | 2.53 | 92 | |
| 2015 | 20 August | 0 UT | 146.471 | 2.41 | 70 | 2.37 | 69 |
| 2015 | 21 August | 0 UT | 147.434 | x | x | x | |
| 2015 | 22 August | 0 UT | 148.397 | 2.12 | 56 | 2.35 | 54 |
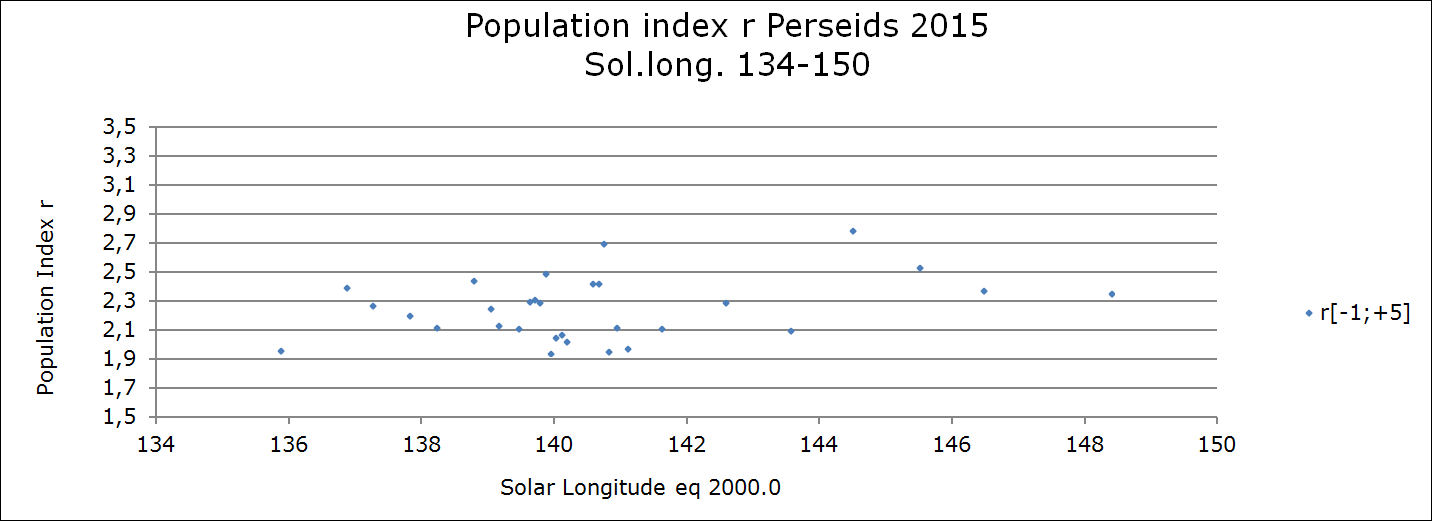 Figure 1 – Population index r for the Perseids 2015 obtained from the magnitude range [–1:+5]
for the period 134°–150° in solar longitude.
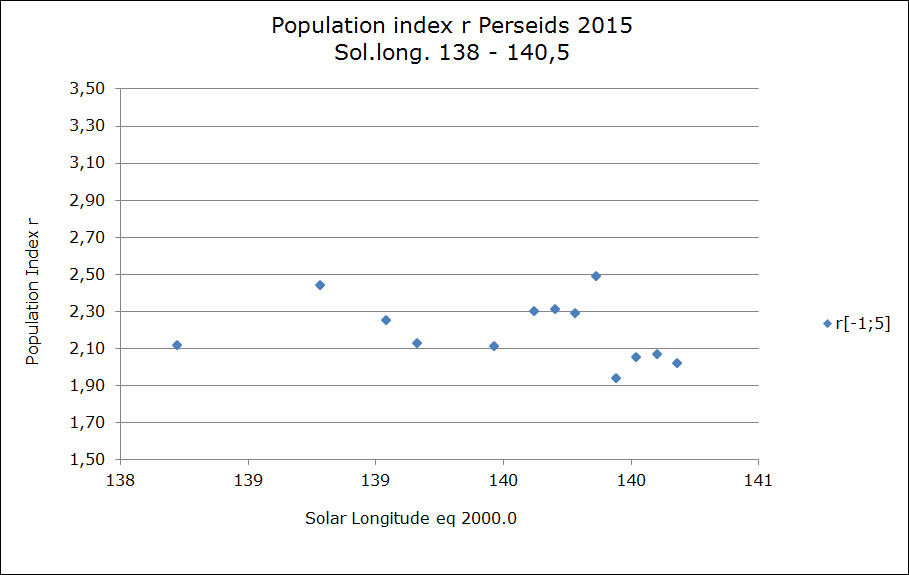
Figure 2 – Close up at the r-values during the Perseid maximum.
The solar longitude correspondents to the time range 12 Aug. 10h UT to 13 Aug. 11h UT.
It is striking that the r-value is above the average value before the maximum, but the difference decreases towards the maximum. During the night of 12–13 August over Europe the r-value shows a lot of scatter. The r-value was rather low, at about 2.00 (dots near λʘ = 140°), during the traditional maximum above the Eastern part of America. American meteor observers from this region reported indeed an impressive Perseid display. After the maximum the r-values increase again. Figure 2 is a close up at the Perseid maximum. The decrease at λʘ = 139.9° has probably to do with the increased activity over America.
7 The results: the ZHR profile
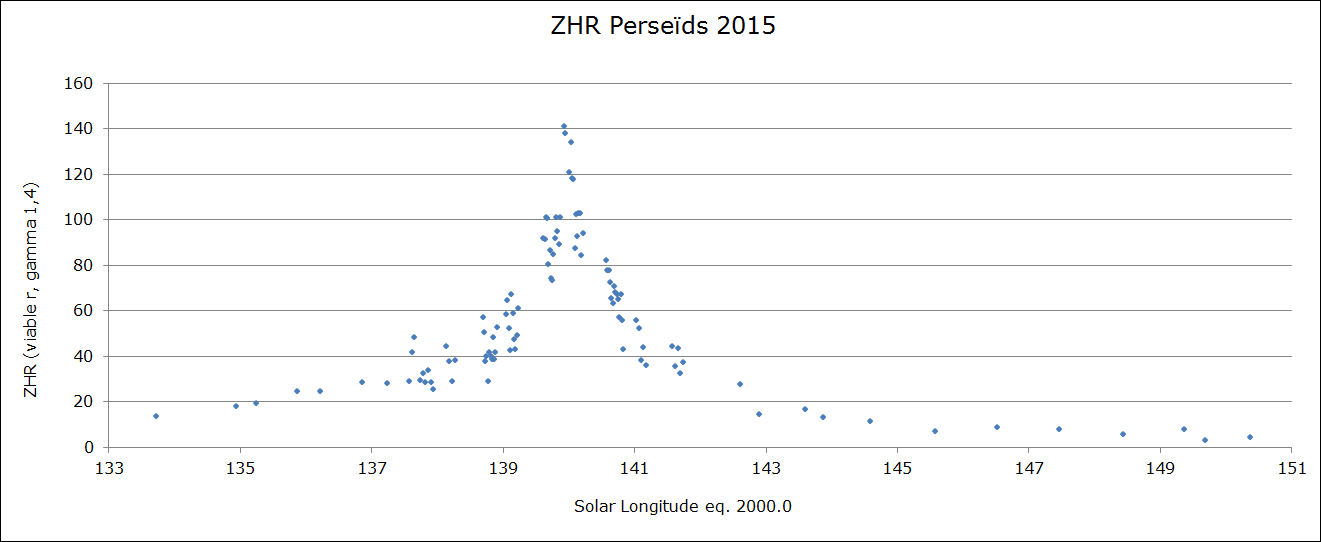
Figure 3 – The ZHR profile for the Perseids during the time interval of 6–24 August 2015.
When all the data was sorted and filtered in the ZHR spreadsheet, 14875 Perseids and 7249 sporadics were still taken into account. The data of the sporadic meteors has been used for the calculation of the perception coefficient Cp. Only 37% of the data reported to the IMO could be used. Most of the rejected data did not fit our selection criteria due to too low limiting magnitudes. 991 time intervals could be used for ZHR calculations and the result is displayed in Figure 3.
The peak value of the ZHR is remarkable high for a traditional Perseid maximum. These ZHRs are mainly based on data from two very experienced observers from the eastern part of North America. We’ll take a look at the Perseid maximum in detail. The profile shows how the Perseid ZHR increases from a ZHR of 10 at 6 August and decreases to a ZHR less than 5 around 24 August. After this date it becomes difficult to identify the rare Perseids among the sporadic activity.
11–12 August: Europe and North America
There is only one Asian observer who reported data with a limiting magnitude better than +5.9. The ZHRs vary strongly between 20 and 75 with an average of 50, but this data has not be included in this analyses as it is based on too few intervals.
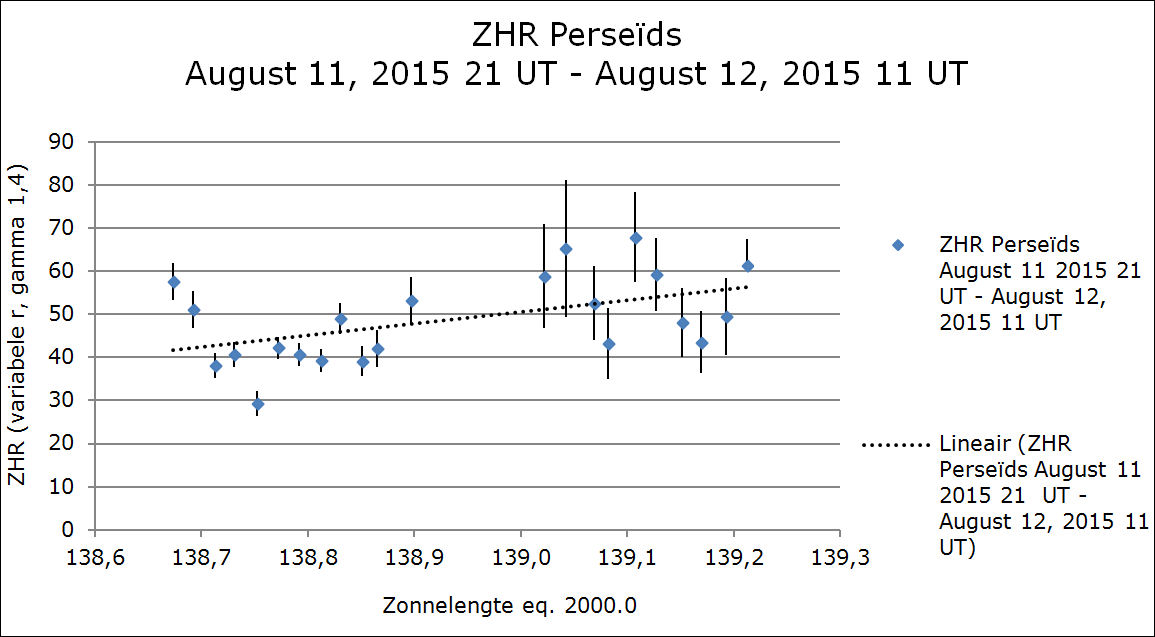
Figure 4 – The ZHR for the interval 11 August 21h UT – 12 August 11h UT.
The dotted line is the linear regression fit through these points.
Something that strikes immediately are the larger error bars in Figure 4 above the American continent, (139.0° < λʘ < 139.2°). This is due to the smaller numbers of observers and therefore smaller numbers of data. About 15 visual observers were active in America, but only 4 managed to deliver useable data. This is a pity as it was mainly due to the too poor limiting magnitude that these observers have no data included. Luckily these observers were all very experienced. Europe counts many more visual observers but this group includes beginning observers and casual observers who only watch some shower maximum activity. All this data is always screened on quality and any outliers are rejected.
Looking at the variation of the activity profile shown in Figure 4, we see that Europe starts with ZHRs of 50 – 60 followed by a decrease to 40 and again increasing to about 50 at the end of the night. When American observers get started the ZHR is at a level of 60 but the activity shows quite some scatter as if there were three sub-peaks of about 60 – 70. There is some increasing trend visible too.
The population index r was about 2.44 for Europe (relatively more fainter meteors), while for America this was a bit lower, decreasing from 2.25 to 2.16.
12–13 August: Asia, Europe and North-America
Again the same situation repeats itself with the data from Asia as for 11 August. There is quite some good observational data available submitted by about 15 observers. Only 3 were selected with a limiting magnitude of +5.9 or better. It is a pity as this way it is not possible to monitor the activity profile continuously. The Asian observers reported counts with ZHRs between 85–110 with a single outlier of 50. Figure 5 shows the result for observations reported from Asia, Europe and North America for the time interval 139.4° < λʘ < 140.2°, corresponding with 12 August 16h UT and 13 August 12h UT.
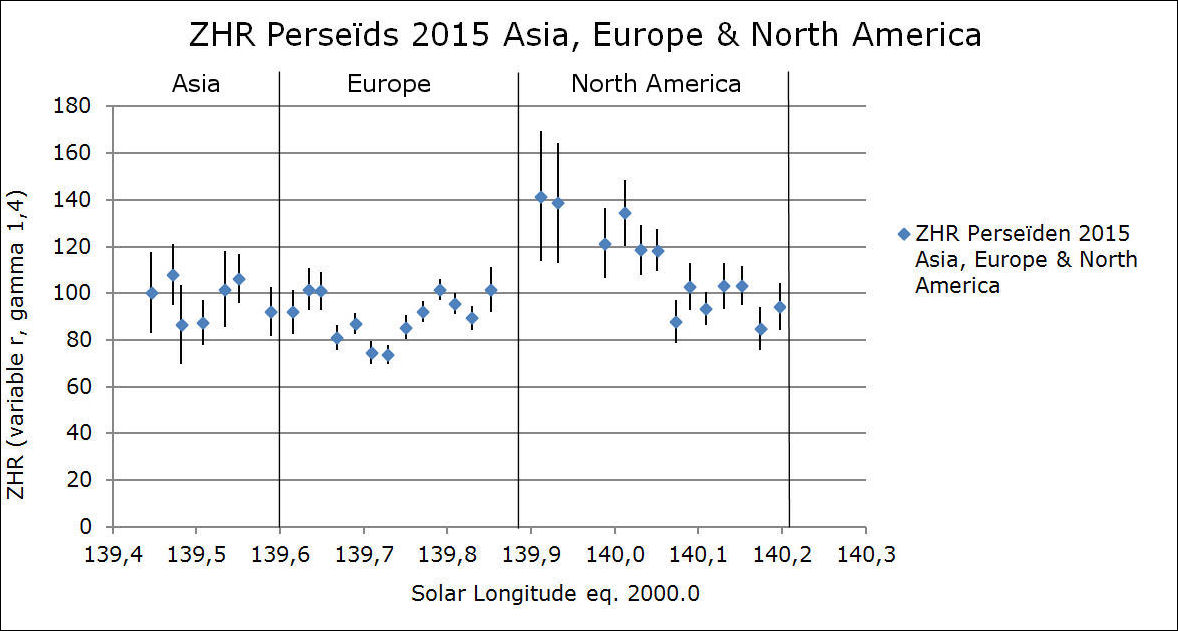
Figure 5 – The ZHR profile 12–13 August from 16h until 12h UT.
The ZHRs for Asia are based on data from only 3 observers.
12–13 August: A short peak in activity over Europe?
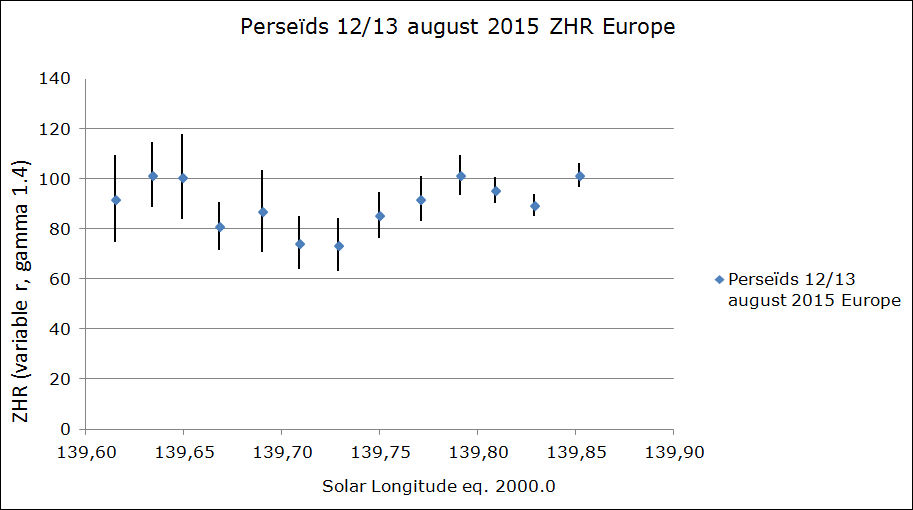 Figure 6 – The ZHR profile for 12–13 August for Europe alone.
No linear regression has been applied because of the likely sub maximum at the beginning of the night.
As described in the observing report of Michel Vandeputte (Vandeputte and Miskotte, 2016), the observers in the French Provence had the impression that at the start quite a bit bright Perseids were observed followed by a dip in the activity. Other observers shared this impression, e.g. Felix Bettonvil who observed in Croatia. A quick calculation for the data of MISKO and VANMC, both in the Provence, shows that the data by MISKO has a small peak combined with a lower r-value. No trace of any increased ZHR in the data of VANM, but also here we find a lower r-value. Unfortunately, the data of both observers could not be used because of the radiant elevation which was significant less than 25° during these observations.
Analyzing all available data with a radiant elevation higher than 25° also shows this peak. Also the CAMS data indicates that there was something going on at 21h – 22h UT, but nothing conclusive can be derived from this data when checking the orbital data (Johannink, 2016). Radio observations by Peter Bus do not show any peak (Bus, 2016).
Last but not least we take a look at the number of Perseids recorded with the All-sky camera of Koen Miskotte, a Canon 6D with a Canon EF 8-15 mm F 4.0 “L” zoom fish eye lens, installed at Revest du Bion. The camera was set at 8 mm (circular fish eye exposures of the entire sky), F 4.5, ISO 3200 and an exposure time of 29 seconds. These settings easily allow to capture Perseids of magnitude 0. The quality of the night sky remained unchanged during this period of time. The results are listed in Table 3.
Only the radiant elevation has been corrected to calculate the photographic ZHR. Also the apparent angular velocity would require some correction as meteors close to their radiant have a slower angular velocity and are easier to be captured.
Table 3 – The number of photographed Perseids with the All sky camera at Revest du Bion, france during the night 12–13 August 2015. Camera: Canon 6D, Optics: Canon EF 8–15 mm F 4.0.
| Period UT |
–6 |
–5 | –4 | –3 | –2 | –1 | 0 | Total |
Photo ZHR |
| 20:15-21:15 | 2 |
2 |
15 ± 7 | ||||||
| 21:15-22:15 | 1 | 2 | 3 | 1 | 4 |
11 |
40 ± 12 | ||
| 22:15-23:15 |
1 |
2 | 3 | 2 | 4 |
12 |
33 ± 9 | ||
| 23:15-00:15 | 1 | 1 | 2 | 3 | 2 |
9 |
17 ± 6 | ||
| 00:15-01:15 | 3 | 1 | 5 | 8 |
17 |
31 ± 7 | |||
| 01:15-02:15 | 1 | 2 | 1 | 4 | 5 |
13 |
17 ± 5 | ||
| 02:15-03:15 | 2 | 2 | 6 |
10 |
10 ± 4 | ||||
| 20:15-03:15 |
1 |
1 | 3 | 9 | 14 | 17 | 29 |
74 |
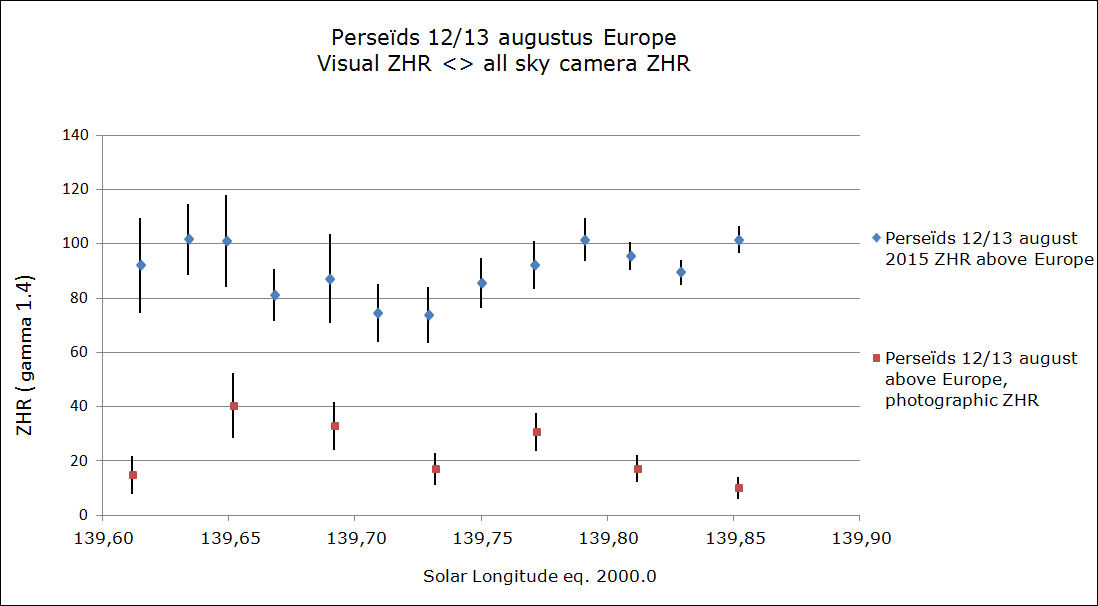
Figure 7 – Combined ZHR profiles for visual data (blue dots) and photographic data (red suares).
Also the photographic ZHR profile shows a slight increased activity at the start. The photographic ZHR profile looks remarkably similar in shape as the visual one, except at the end of the night. Where the visual ZHR
increases, the photographic ZHR decreases and this can have two explanations. First of all by the fact that the visual population index r increased from 2.3 to 2.5 at the end of the night, hence a decrease in bright meteors that could be photographed, secondly there were more cirrus clouds at the sky towards the morning which may have reduced the chances to capture meteors photographically. Figure 7 shows the combined visual and photographic ZHR profiles.
Jérémie Vaubaillon made some theoretical modelling for meteoroids released from the parent body of the Perseids, 109P/Swift-Tuttle, indicating a possible increased activity expected on 12 August 2015 around 18h39m UT with a duration of a few hours (McBeath, 2014). This time is just a bit earlier than the observed increased activity.
The observing window around 18h39m UT coincides with the Asian data (Figure 5), which also suggest slightly higher ZHRs than what can be expected at that solar longitude. However this is data from no more than three observers for who no perception coefficient Cp could be calculated and about who nothing is known regarding the level of experience. Another possible explanation is that the filament which was expected on 12 August 2015 around 23h UT has occurred sooner than expected (Jenniskens, 2006).
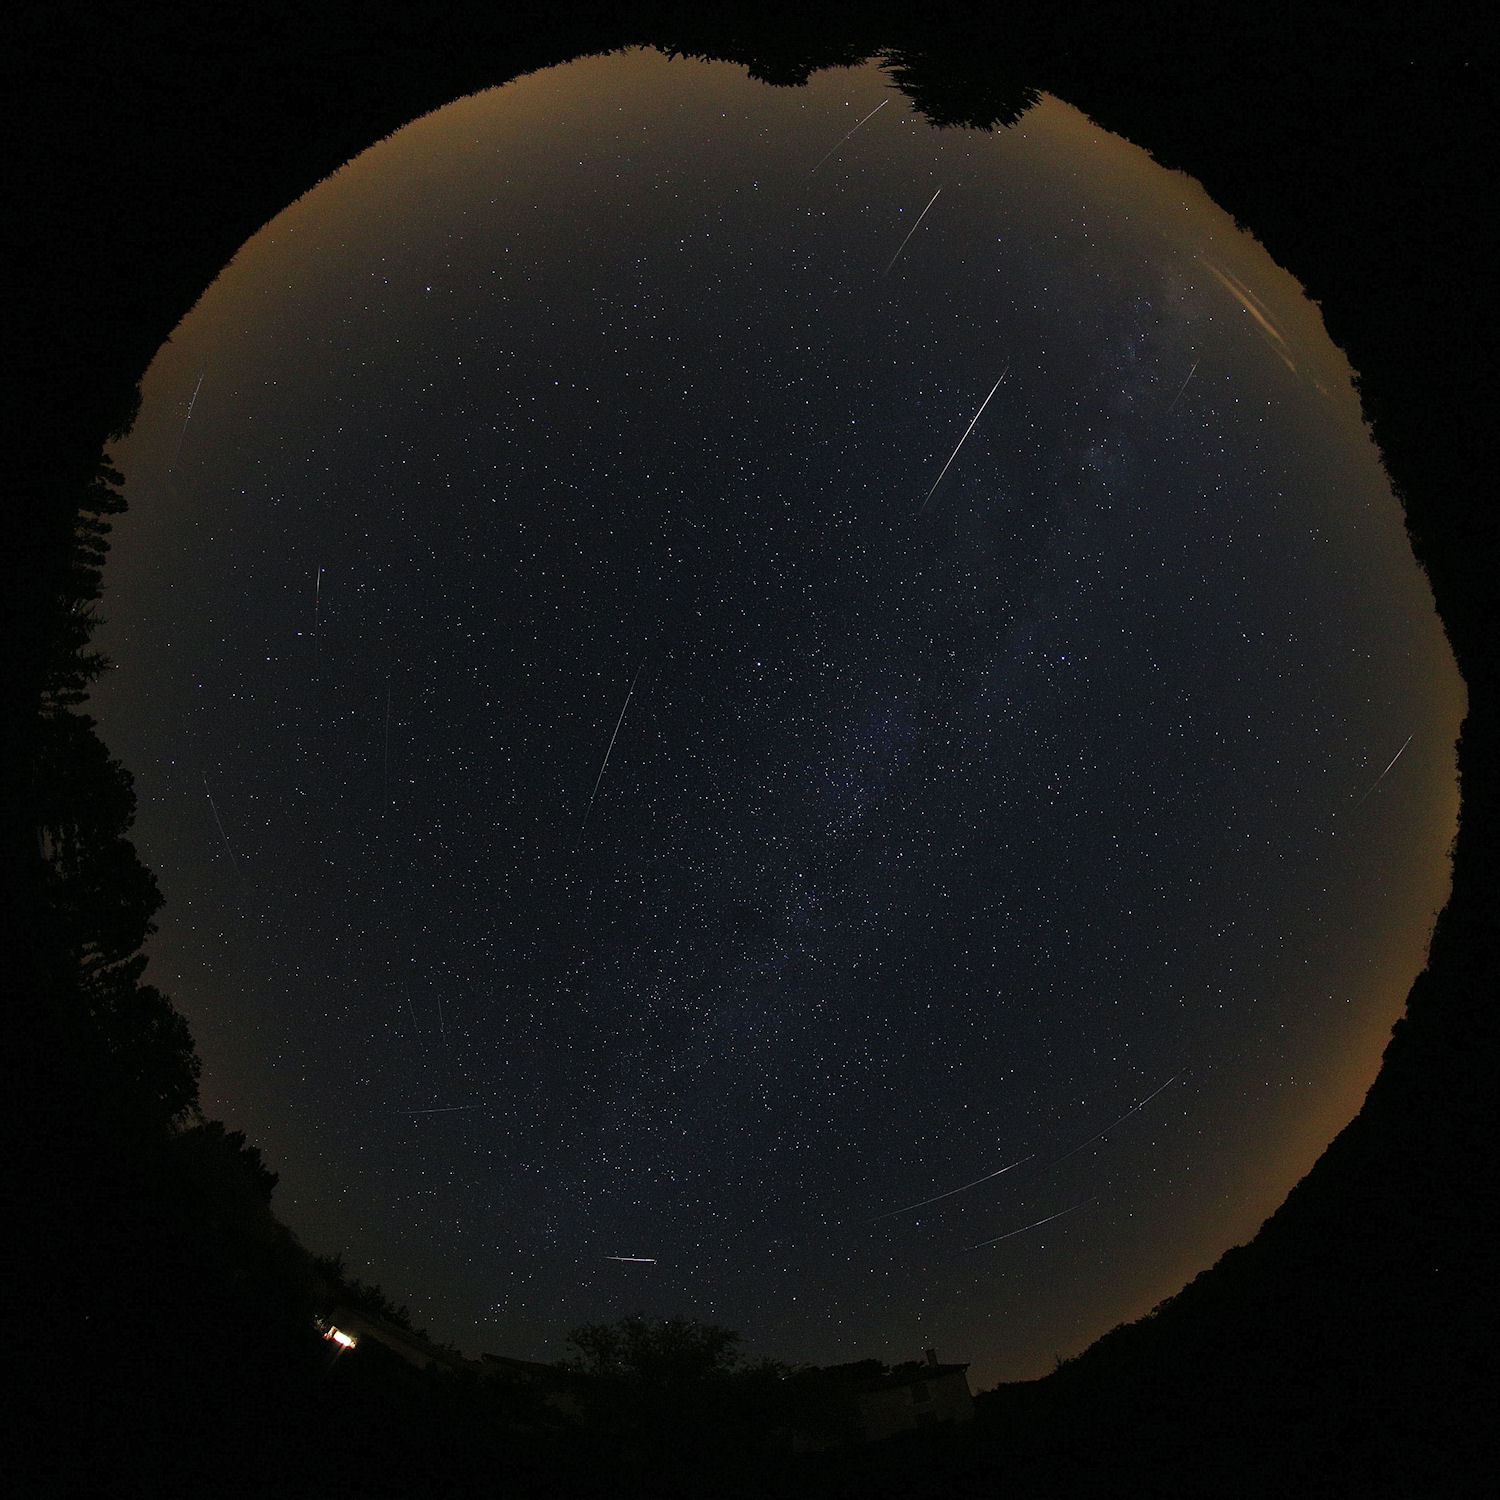
Figure 8: composition of Perseïds captured on August 13, 2016 between 21-00 UT with the all sky camera at Revest du Bion. Camera: Canon 6D. Lens: Canon EF 8-15 mm F 4.0 fish eye lens. Image credit: Koen Miskotte
12–13 August: increased activity over North America!
The traditional maximum was expected on 13 August 2015 from 6h30m and 9h00m UT (McBeath, 2014). However the reports by observers at the eastern part of North America describe a fantastic meteor display starting as soon as it got dark. You may read the reports from two veteran meteor observers, Pierre Martin and George Gliba (Martin and Gliba, 2016). The ZHR calculations give ZHR values in the range of 120 – 140, decreasing to 80 – 90 at the end of the night. A traditional Perseid maximum has a typical ZHR around 100, hence the observed activity appears to be above the expected level. When it got dark over the western part of North America the activity was already less.
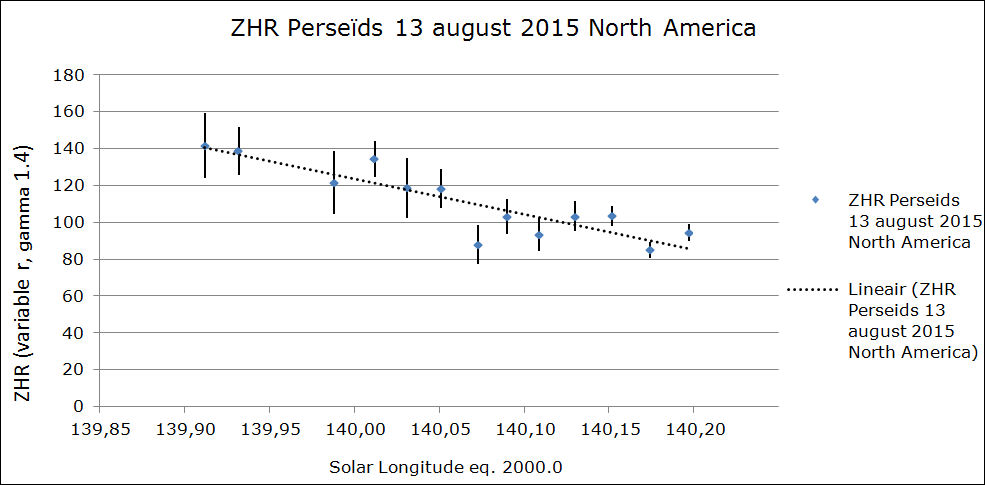
Figure 9 – The ZHR profile for Northern America. A linear regression fit has been added as a dotted line to indicate the trend. According to IMO the maximum was expected during the interval of 140.0° < λʘ < 140.1°.
13–14 August: Europe and North America
A normal level of Perseid activity was recorded over Europe during this night. The ZHR decreased from about 80 to about 50 at the end of the night. This trend continued as seen from North America with ZHRs decreasing from about 55 to 35.
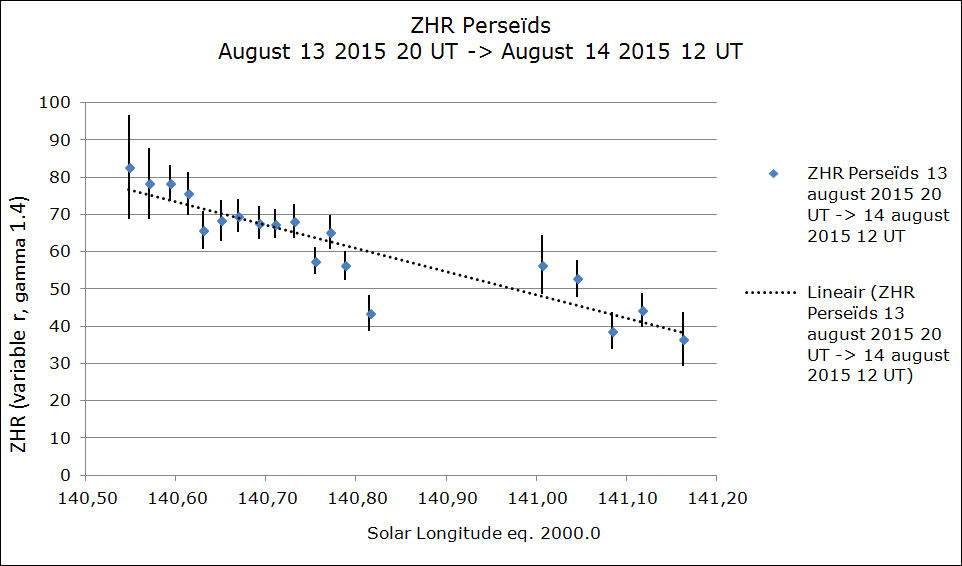
Figure 10 – ZHR profile for the interval 13 August 20h UT until 14 August 12h UT.
A linear regression fit is added to indicate the trend.
8 Recommendation
It would be very helpful if meteor observers in North America and Asia could travel to dark sky locations for observing as too many do suffer from too poor limiting magnitudes. Further there is a structural shortage in visual observers in these regions; hence any initiative to encourage amateurs to report more visual meteor observations would be very welcome.
9 Conclusion
2015 produced a most interesting Perseid return, most promising in view of the 2016 display during which significant increased activity is expected due to the presence of multiple dust trails such as these of 1076 and 1862. An increased activity has been observed above North America around the traditional Perseid maximum (ZHR 120 – 140 instead of the expected 100). There are also strong indications for a short peak observed from Europe around 21h UT, possibly connected with the end of the increased activity above Asia around 18h39m UT, predicted by Jérémie Vaubaillon, or related to the earlier occurrence of the filament expected on 12 August at 23h UT (Jenniskens, 2006). Unfortunately no confirmations could be found in either radio data or in CAMS data.
Acknowledgment
The author wishes to thank all observers very much for their enormous efforts! Without them no analyses like this would be possible. Thanks also to Carl Johannink for the helpful spreadsheets and the useful discussions. Thanks to Paul Roggemans, Michel Vandeputte, Jaap van ‘t Leven and Peter Bus for their critical reading of this article. And a big thank you to Paul Roggemans for translating this article into English!
References
Bus E. P. (2016). “Radio: Perseïden 2015 en de langdurige meteorenreflecties 2012–2015”. eRadiant, 2016-1, 20–22.
Jenniskens P. (1994). “Meteor stream activity I. The annual streams”. Astronomy and Astrophysics, 287, 990–1013.
Jenniskens P. (2006). Meteor Showers and their Parent Comets, Cambridge University Press.
Johannink C. (2016). “Perseïden CAMS”. eRadiant, 2016-1, 34–37.
Martin P. and Gliba G. (2016). “Impressies van het Perseïden maximum boven oostelijk Noord Amerika”. eRadiant, 2016-1, 14–15.
Miskotte K. and Johannink C. (2005a). “Analyse Perseiden”. eRadiant, 1, 9–12.
Miskotte K. and Johannink C. (2005b). “Analyse Geminiden 2004”. eRadiant, 1, 14–19.
Mcbeath A. (2014). 2015 Meteor Shower Calendar. IMO.
Miskotte K. (2015). “Lyriden 2015: een globale analyse?”. eRadiant, 2015-3, 62–67.
Vandeputte M. and Miskotte K. (2016). “Op Meteorenkamp te Revest du Bion – editie 2015”. eRadiant, 2016-1, 6–13.

