Abstract: An overview of the radio observations during March 2025 is given.
The graphs show both the daily totals (Figure 1) and the hourly numbers (Figure 2) of “all” reflections counted automatically, and of manually counted “overdense” reflections, overdense reflections longer than 10 seconds and longer than 1 minute, as observed here at Kampenhout (BE) on the frequency of our VVS-beacon (49.99 MHz) during the month of March 2025.
The hourly numbers, for echoes shorter than 1 minute, are weighted averages derived from:
During this month there was few local interference and no lightning activity was recorded.
As every year in March the meteor activity was quite low, with a few minor showers. Strong solar eruptions were however recorded almost every day, most of them of type III.
In addition to the usual graphs, you will also find the raw counts (subject to strict reservations as previously said) in cvs-format from which the graphs are derived. The table contains the following columns: day of the month, hour of the day, day + decimals, solar longitude (epoch J2000), counts of “all” reflections, overdense reflections, reflections longer than 10 seconds and reflections longer than 1 minute, the numbers being the observed reflections of the past hour.
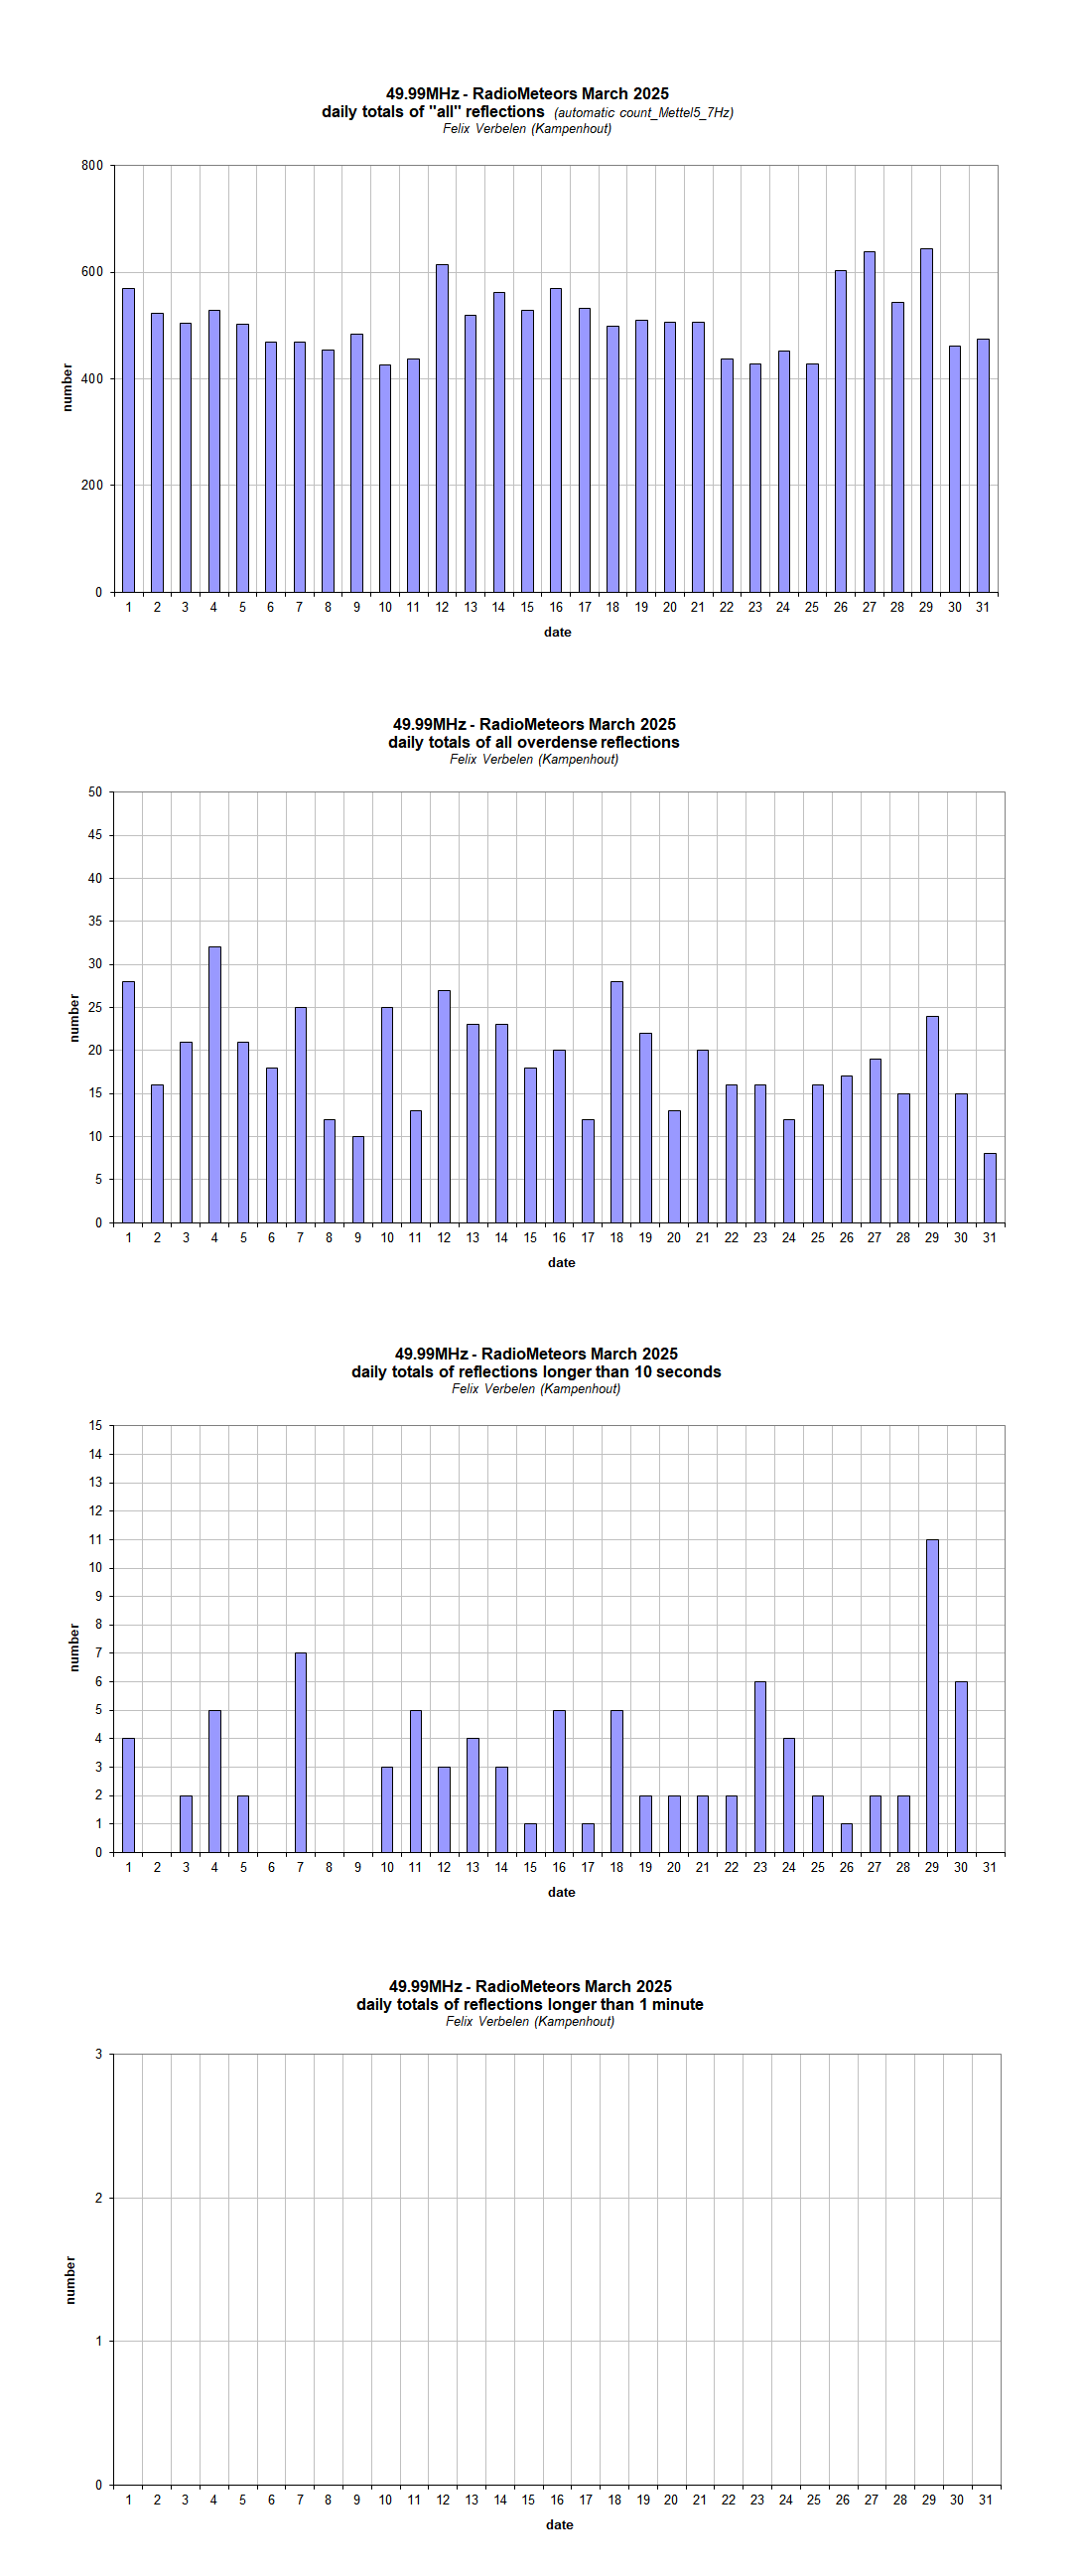
Figure 1 – The daily totals of “all” reflections counted automatically, and of manually counted “overdense” reflections, as observed here at Kampenhout (BE) on the frequency of our VVS-beacon (49.99 MHz) during March 2025.
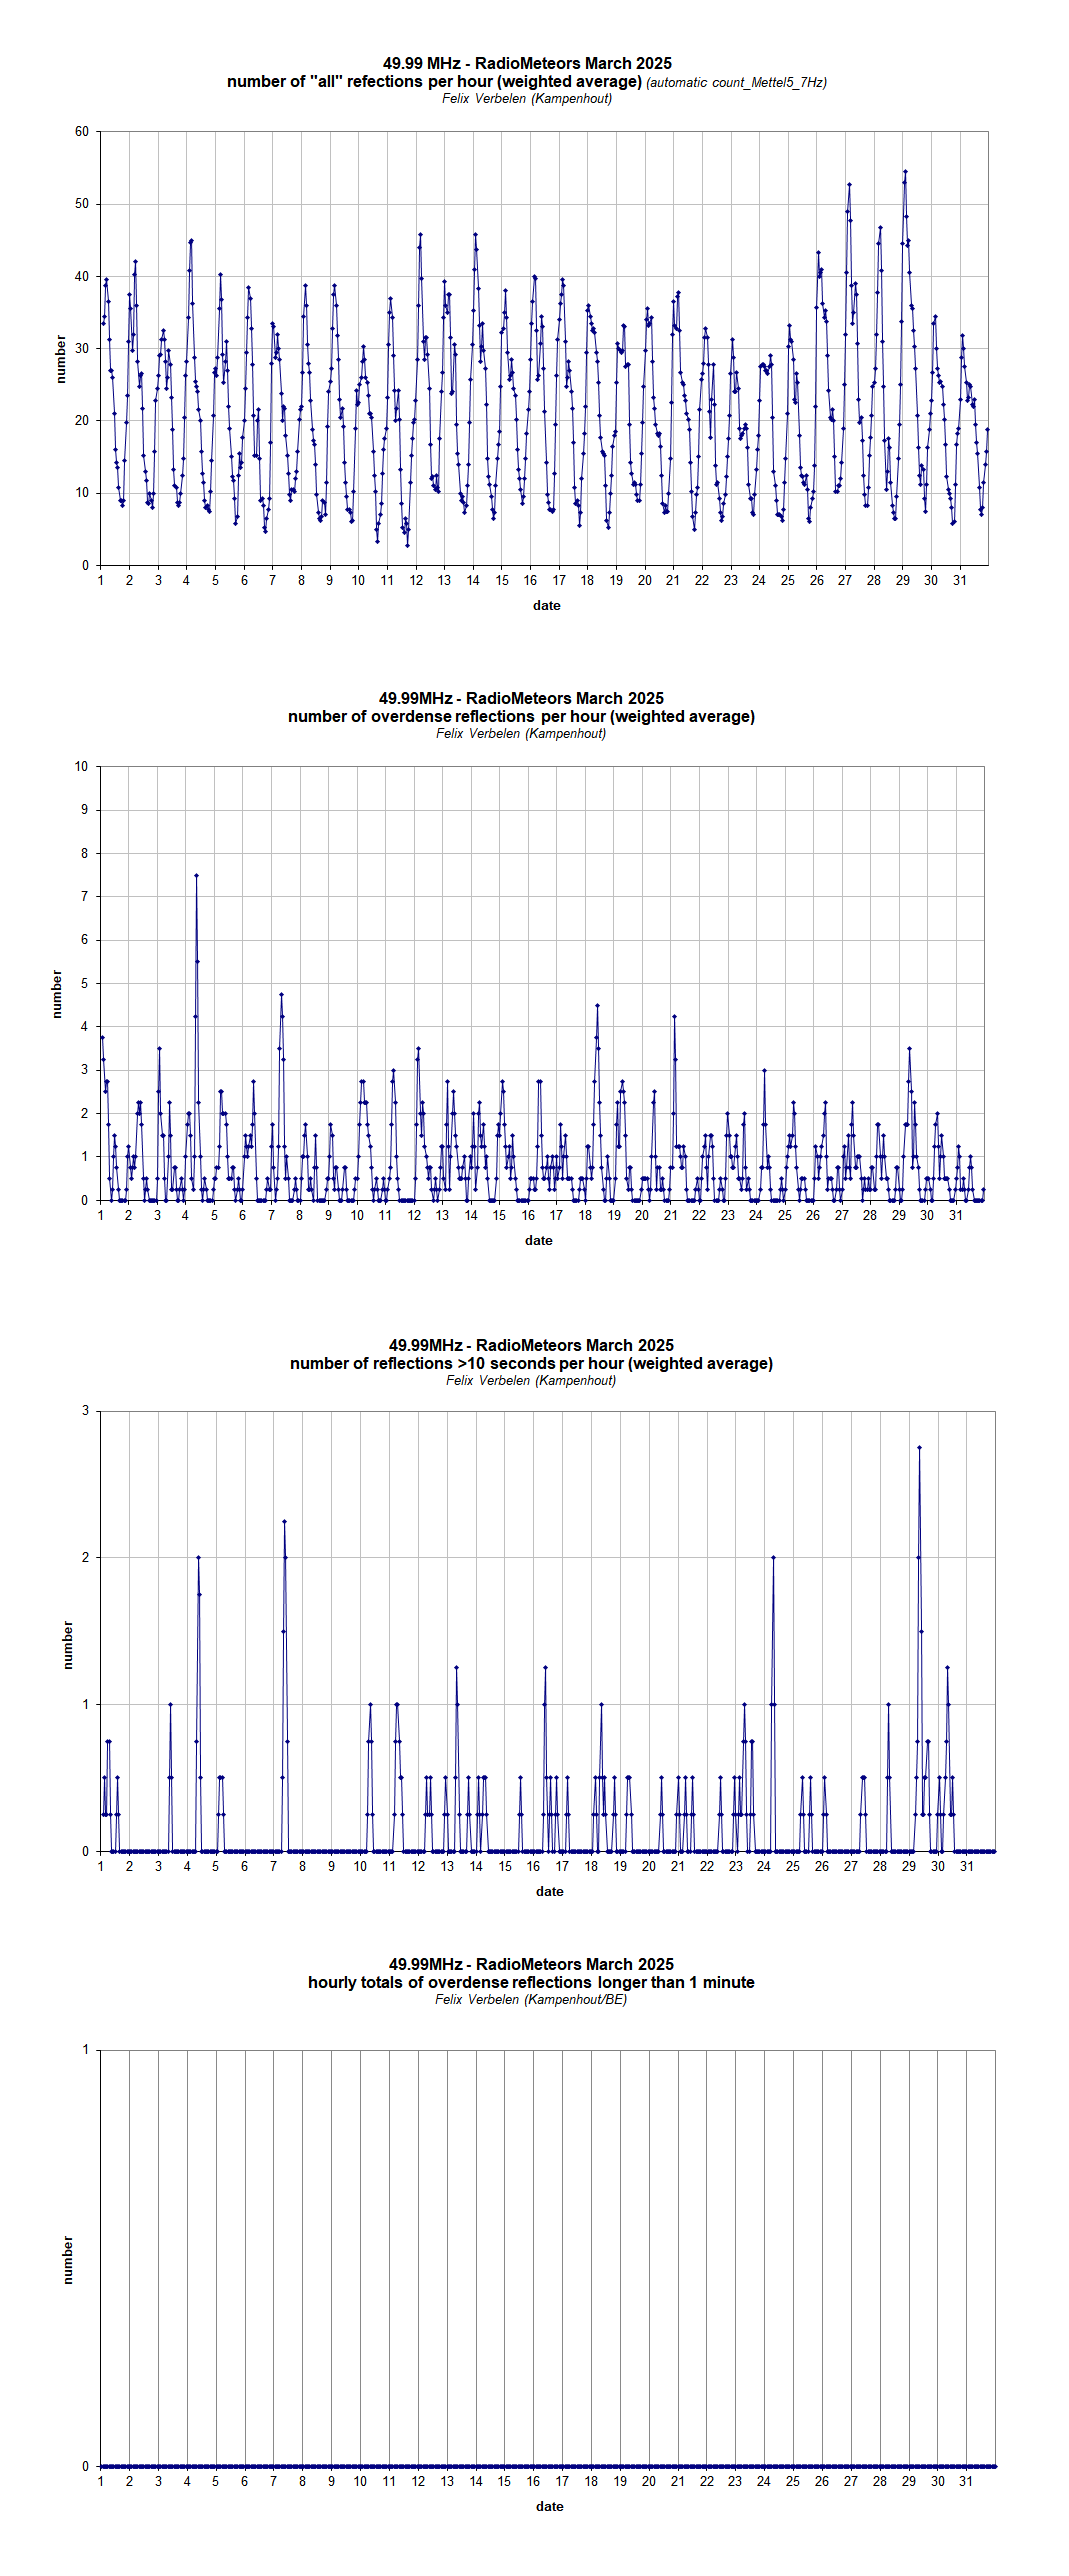
Figure 2 – The hourly numbers of “all” reflections counted automatically, and of manually counted “overdense” reflections, overdense reflections longer than 10 seconds and longer than 1 minute, as observed here at Kampenhout (BE) on the frequency of our VVS-beacon (49.99 MHz) during March 2025.
