Abstract:
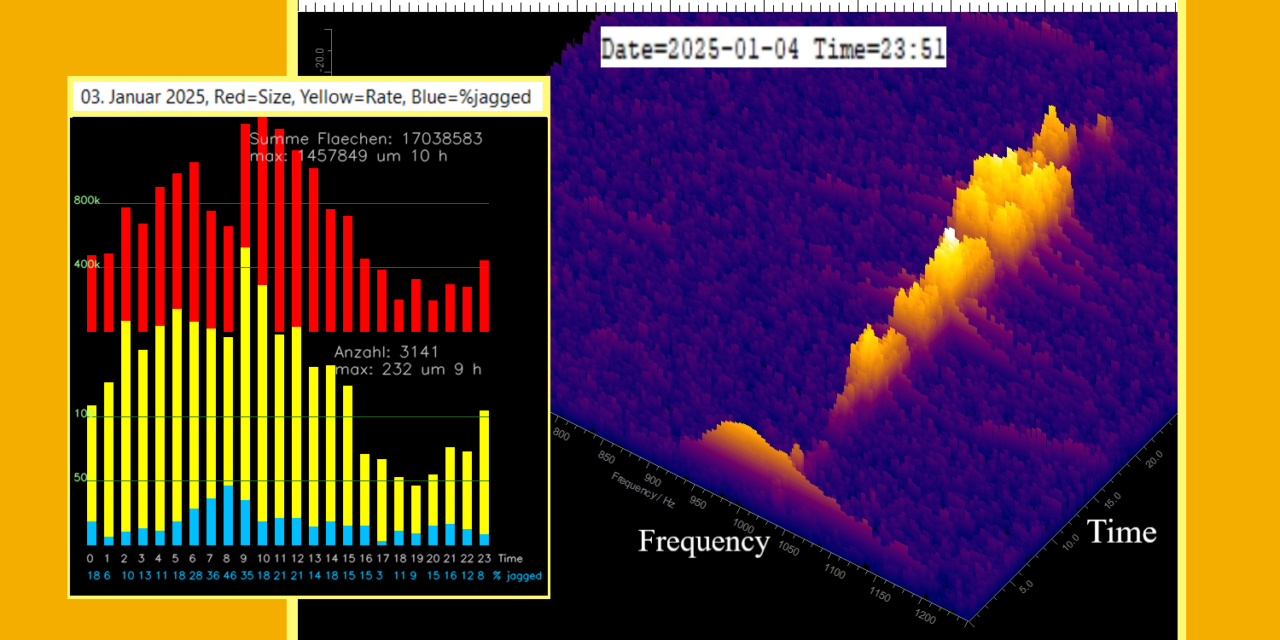
The Quadrantids 2025 were recorded with a new antenna and at a new, low-interference location. The recorded spectrograms were evaluated using Artificial intelligence (AI) / Machine Learning (ML). As in 2024, the data show a notch in the rate and a cluster of jagged meteor echoes around 9 h. The work confirms that the geometric relationships of the meteoroid and the radar cause the notch and jagged echoes.
It was found that a large number of the meteoroids decay according to the same pattern: in the 3D representation used, the head echoes have a bulbous shape shortly before their end and show pulsations. A few of these spectrograms are included in this work. In order to study this effect in more detail, a second meteor receiving system was recently installed. Interesting spectrograms of head echoes were recorded: they show pulsations of various kinds. First results are described in the next article.
1 Introduction
The strong showers are particularly suitable for the study of meteor echoes: they provide plenty of echoes and it is known from which direction they come. Head echoes, only trail echoes and head echoes together with a trail echo were recorded. In the literature, the trail echoes are referred to as specular trails. The jagged echoes are created when a meteoroid moves almost parallel to the radar beam (Sicking, 2024b). With these echoes, no or only a weak head echo can be seen in my recordings. These echoes are referred to as non-specular trails. Head echoes are created by reflection from the plasma that directly surrounds the meteoroid and move at approximately the same speed as the meteoroid (Close et al., 2007). In this article, as in 2024, the spectrograms at different stages of the 2025 Quadrantids are examined.
2 Setup
Meteor echoes are recorded on the GRAVES frequency of 143.05 MHz. GRAVES is a high-performance radar for observing satellites and space debris. It is located in France near Dijon. With four planar phased array antennas, it transmits a powerful CW (continuous wave) carrier around the clock. The four antenna arrays transmit one after the other in a southerly direction. According to my own measurements, the switching time is 1.6 s. In the literature, so-called high power large aperture (HPLA) radars were used for investigations into head echoes. The GRAVES transmitter is also, in principle, an HPLA radar. Because the power is concentrated on a narrower beam than with normal HPLA radar systems, a high equivalent isotropically radiated power (EIRP) is obtained, so that this radar can deliver stronger echoes than if the same power were distributed over a large opening angle. One disadvantage, however, is that an echo is overlooked if the system is transmitting in a different direction. However, echoes that are illuminated by side lobes or the back lobe are also visible. The sensitivity is then of course lower. In this case, dips can be seen in long trail echoes, see Figure 1 above. The same image also shows the GRAVES glitches that are produced by switching the antennas. The head echo was not recorded.
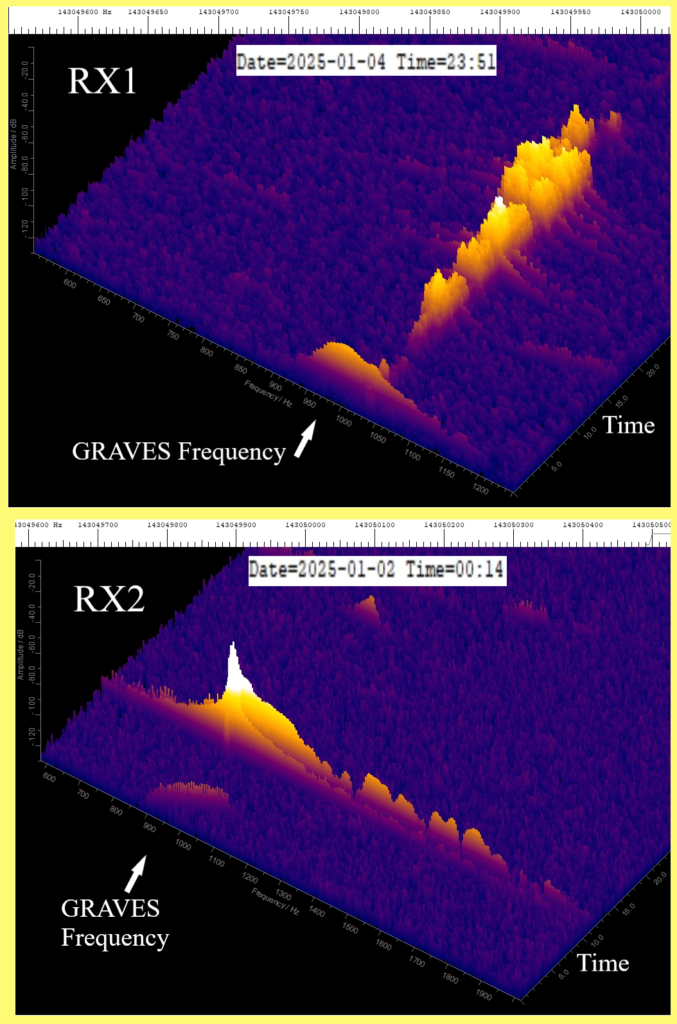
Figure 1 – The figure shows a Spectrum Lab (SL) output from each system. In the upper part, SL is set to record large echoes as completely as possible. The setting below is optimal for long head echoes. A Bulge and pulsations are clearly visible. The original Spectrum Lab graphs have been cut off on the right side so that the graphs fit well into eMetN’s two-column format.
To receive the meteor echoes, I now use a so-called eggbeater antenna. It consists of two loops rotated at 90° to each other and a reflector made of radials. The antenna has a vertical opening angle of 120° and is clockwise circularly polarized. Close to the horizon, this antenna is horizontally polarized. It has proven to be useful for meteor reception of GRAVES echoes, as only a small amount of signal intensity is received from the horizon. In particular, direct reception of the GRAVES carrier is prevented in this way. The antenna is located at the clubhouse of the local association N62 Wüllen of the German Amateur Radio Club at the southern end of the facility, see Figure 2.
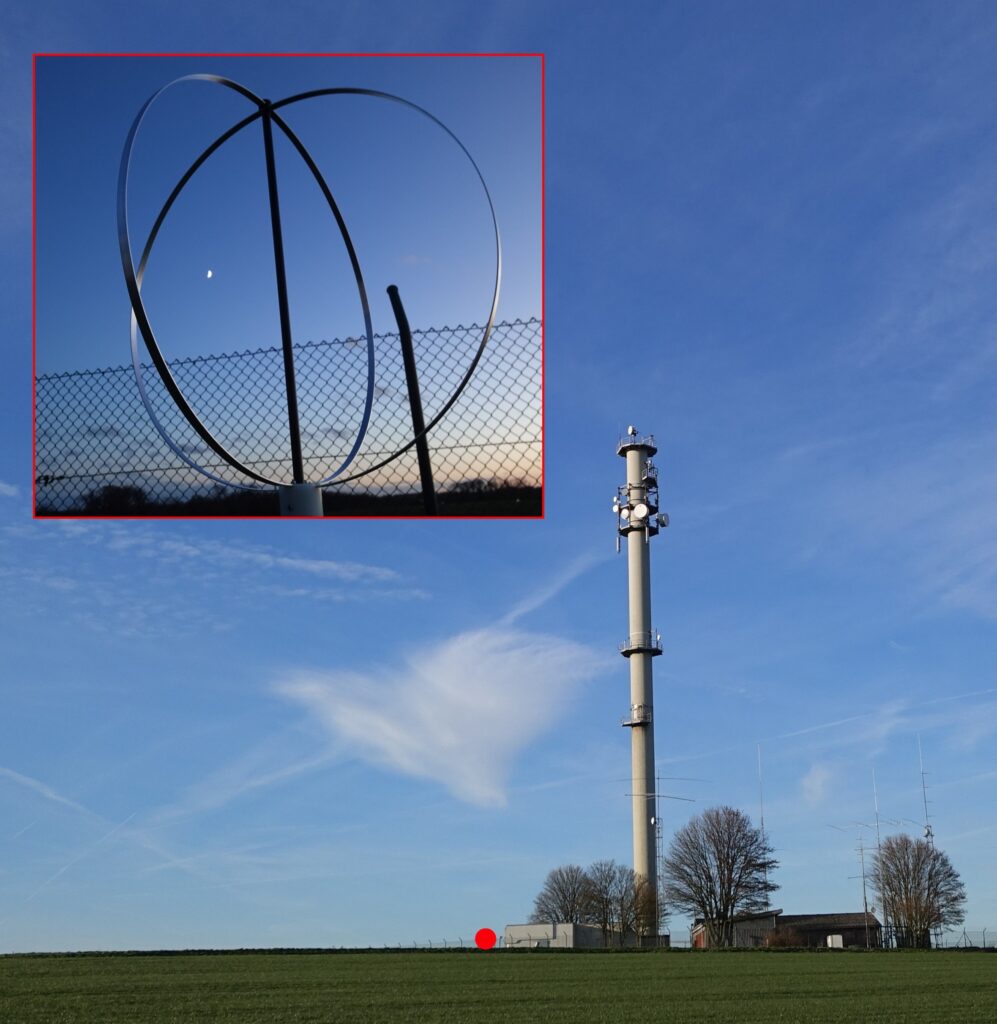
Figure 2 – Photo of the clubhouse of OV-N62. It is a former NATO radio tower. (Photo: The author) The inset shows the loops of the eggbeater antenna and the moon. The red dot shows the location of the antenna. The building next to the red dot is a bunker from the Cold War era.
A low-noise preamplifier with a frequency range of 140-150 MHz and a noise figure of 0.25 dB is connected directly to the antenna. The preamplifier is connected to the receivers via a 60 m long coaxial cable. I am currently using two identical receiving systems. The receivers are Icom IC-R8600. The antenna signal is split by an antenna splitter. Optocouplers are inserted in the USB cables between the receivers and the PCs. This means that there are no crashes even after very long operating times. Spectrum-Lab (SL) by Wolfgang Buescher (DL4YHF) is used as the recording software. SL generates plots every 20 seconds with the corresponding date and time in the file name, which are later analyzed using machine learning-based software that I developed (Sicking, 2024a); Sicking, 2024b). The only difference between the two systems is the settings of Spectrum Lab. One system delivers the data as usual for later evaluation via AI / ML. The focus here is on capturing the trail echoes as completely as possible and also large echoes, see Figure 1 above. In the second system, Spectrum Lab is set to record as much of the head echo as possible, see Figure 1 below.
I trained the neural network used in the summer of 2024. The neural network can detect objects of 4 classes. So far, 880 plots have been labeled. The dataset is estimated to contain up to 3000 spectrograms of artificial stars, backgrounds, meteors, and jagged meteors. The test-train-split is 1:3. For training, I use a gaming PC with a Nvidia graphics card with CUDA cores. Training takes about 90 epochs of 60 s each. I select the best model manually in debug mode and through test runs. The spectrograms for training the jagged echoes mostly come from the Quadrantids 2024. For details see my paper Sicking, 2024b.
3 Result and Discussion
Figure 3 documents January 3, 2025 and gives an overview of the quality of the recording. The green and red dots represent meteor echoes. The sizes of the echoes are plotted logarithmically. A dip at 9 a.m., the notch, is visible. The red dots, which appear more frequently around 9 a.m., represent the jagged echoes. These are echoes that have no head echo because the radar beam and the flight path are almost parallel. Here the radiant of the Quadrantids had an azimuth of 0°. The green dots represent the normal echoes with head echoes. These arise when the flight path is more or less perpendicular to the radar direction. The satellites and space debris are also logged. That are the light blue dots. Yellow dots are interference or moon echoes. The rough evaluation of the raw data from Figure 3 is shown in the histograms in Figure 4. The yellow histogram shows the rate and the red histogram shows the rate weighted by the sizes of the meteors. The notch in the red bars in Figure 4 is more pronounced than in the yellow bars because the perspective, the radar beam here runs parallel to the flight path, makes the echoes near the notch appear smaller than if they were observed further out. At the minima of these two histograms, the light blue histogram of the jagged echoes has a maximum. A more detailed analysis follows in the paragraph after next. A comparison of the notch with the notch from 2024 (Sicking, 2024b) shows that it is now less pronounced. The reason for this is the omnidirectional antenna used, which captures more echoes from all directions than a directional antenna facing GRAVES. I published a direct comparison between an omnidirectional antenna and a directional antenna in 2022. (Sicking, 2022)
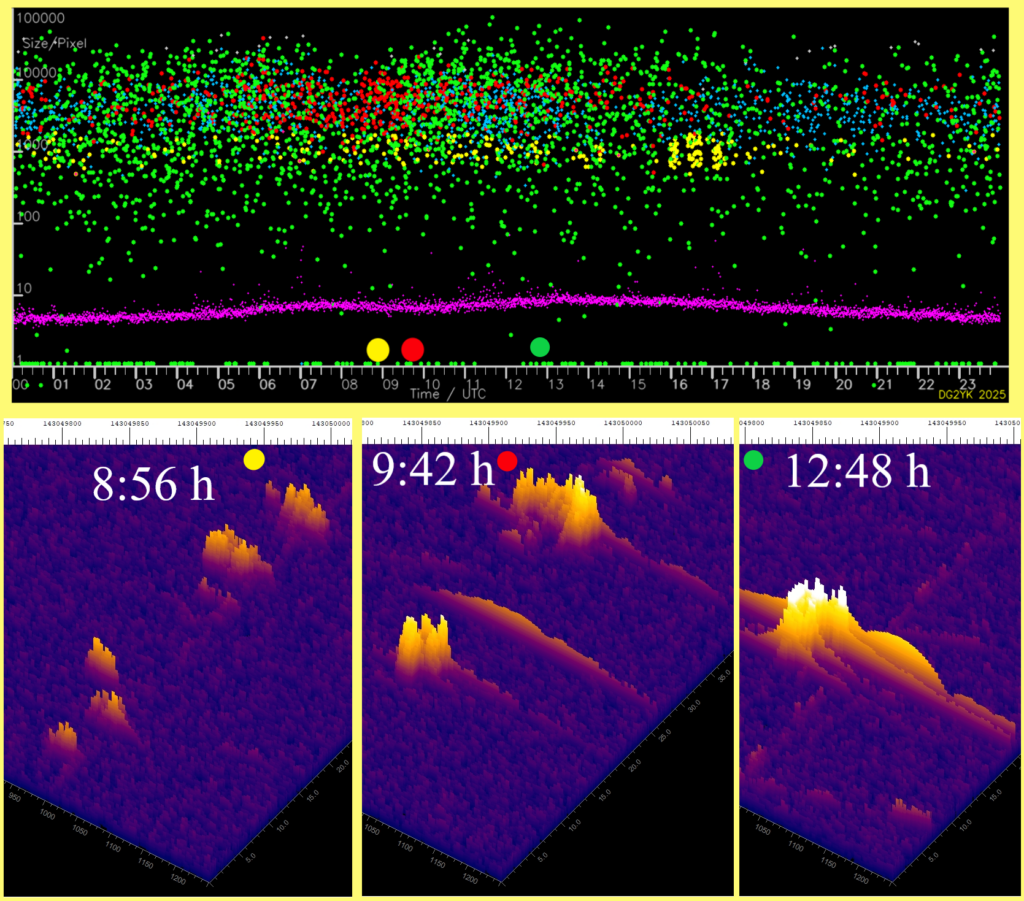
Figure 3 – Measured meteor sizes as a function of time, recorded on January 3, 2025. Each point represents an echo. 3141 echoes were recorded. The green dots represent the normal echoes. The red dots mark the jagged echoes. A decrease in the rate (green dots) and a strong increase in the red dots can be seen at 9 a.m. The blue dots show the satellite echoes. The yellow dots show detected moon echoes and other interference. The noise floor is entered as a purple trace. In the lower part, typical spectrograms from the indicated times are shown. They are: jagged echoes without head echo, two jagged echoes with little head echo and a normal meteor echo consisting of trail echo, head echo and the GRAVES glitches. The pulsations can be seen on the head echo of the spectrogram from 12:48 h. Small pulsations are also visible at 9:42 h.
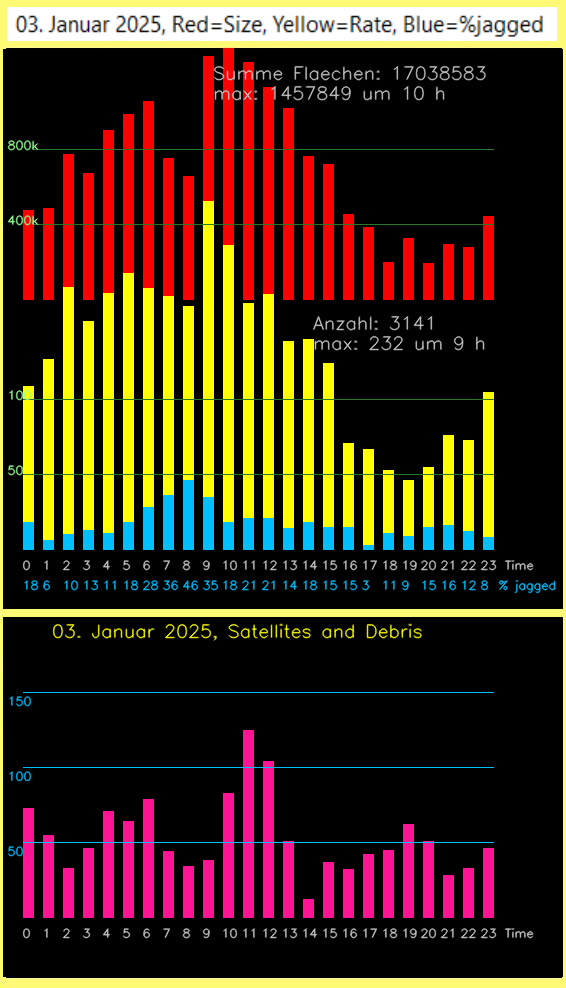
Figure 4 – The yellow histogram shows the rate and the red histogram shows the rate weighted by the size of the meteors. The notch at 9 am is clearly visible. The light blue histogram shows the percentage of jagged echoes. The lower histogram shows the registered satellites.
About the satellites and AI
The lower histogram in Figure 4 shows the registered satellites. In the 4320 plots that are recorded daily, there is hardly a single recording without satellites or space debris. Therefore automatic evaluation without AI / ML seems almost impossible to me. The AI software can distinguish satellites from meteors very well because of their comb-like shape. The distribution over the day has always looked very similar in recent weeks: They always have two maxima at 4-5 a.m. and around 11 a.m. Figure 5 shows a typical recording from 11:44 a.m. The AI software also recognizes faint echoes, see the satellite echo at the top left. The large satellite echo (score 0.99) also clearly shows the antenna switching. The switching does not lead to a total loss of signal, but only to a weakening of the echo.
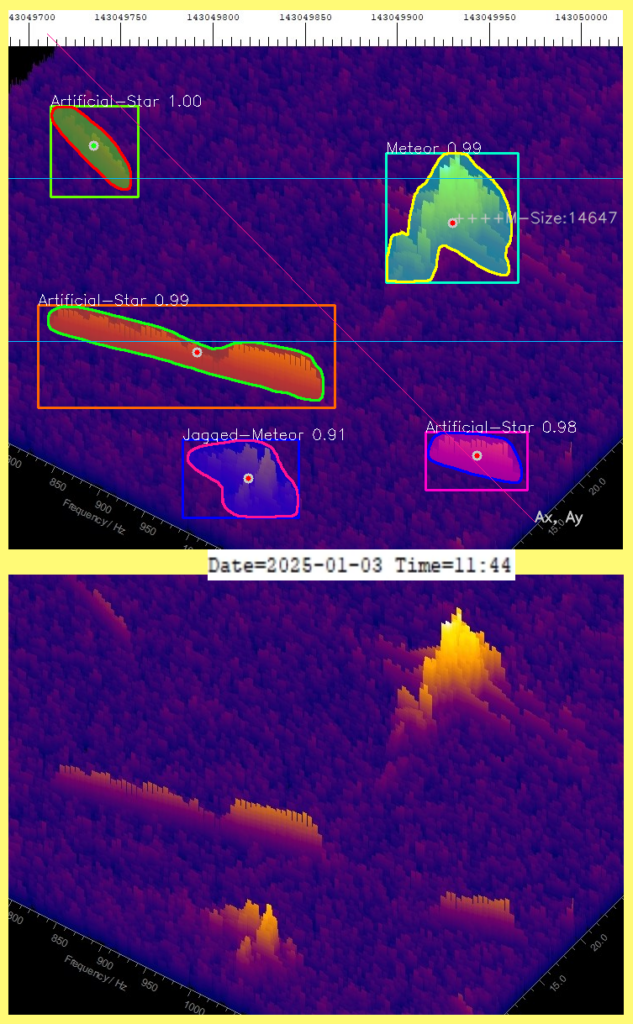
Figure 5 – Spectrum-Lab plot and AI analysis from 11:44 a.m. on January 3rd. The figure was created with the debug feature. Since the label are very small, only sections of the original plot were used. The area between the light blue lines is 20 s long. Only this area is evaluated.
A closer look at the distribution of the jagged echoes and the rates weighted according to the size of the echoes
Figure 6 shows the echoes divided into four classes of different sizes and the percentage of jagged echoes. The small echoes have a secondary maximum at the minimum of the notch. The number of larger meteors decreases. This shows that large echoes now appear smaller in perspective and appear in the class of small echoes. The maximum of the yellow curve at the minimum of the notch is therefore a confirmation of the theory that at an azimuth of 0°, i.e. when a meteoroid moves almost parallel to the radar beam, a decrease in the reflecting surface makes the echoes appear smaller. The notch is now created because the echoes here partially fall below the observation threshold. At this time, the trail is only illuminated from the front. The system registers the jagged echoes, which then show a maximum, see the red curve in Figure 6. Head echoes are not or only weakly visible in this situation, as can be seen in Figure 3 or (Sicking, 2024b). What is surprising is that the intensity of the jagged echoes is relatively high. The reason for this is probably that when the track is illuminated from the front, the radar beams only see a small surface, while in the depth of the track they encounter many particles.
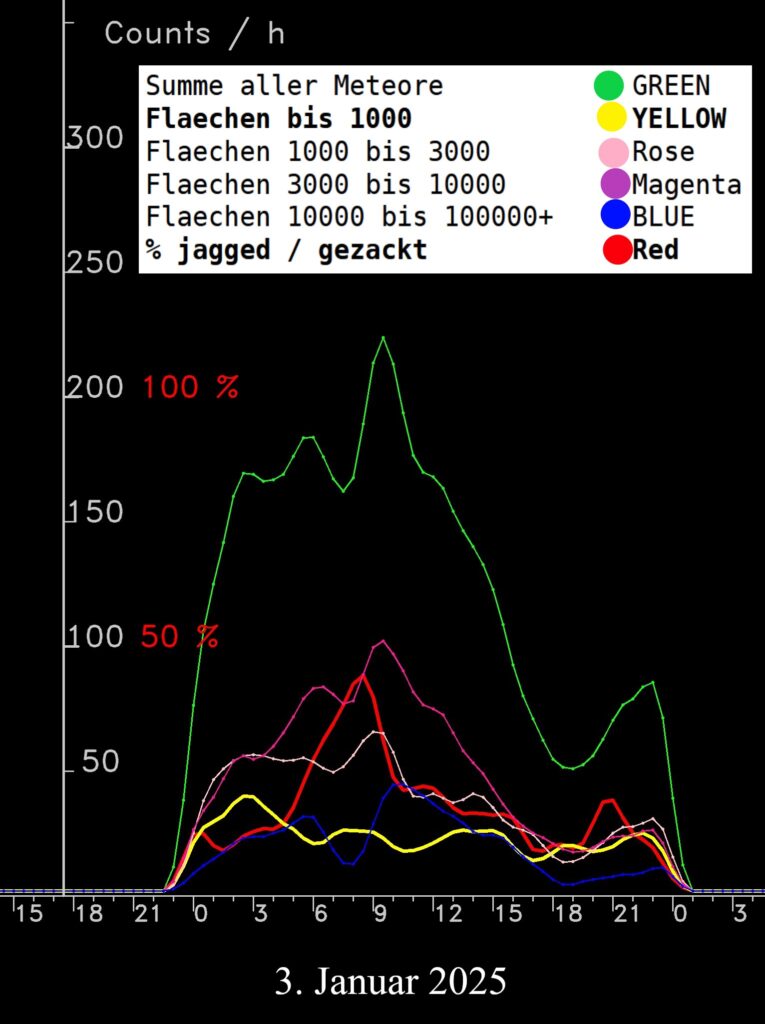
Figure 6 – Meteor rates for different echo sizes and the percentage distribution of jagged echoes from the Quadrantids on January 3, 2025. The blue line represents the rate of large echoes over 10000 pixels, the purple/magenta line shows the medium-sized echoes (3000 to 10,000 pixels), the pink line shows the echoes (1000 to 3,000 pixels), and the yellow line shows the small echoes (under 1000 pixels). Finally, the green trace shows the rate of all echoes. The yellow trace (echoes under 1000 pixels) shows a local maximum where the notch and all other meteor sizes have a minimum. The red trace shows the percentage of jagged echoes. This curve shows a maximum approximately where the larger echoes show a local minimum. The curves were smoothed with a fixed Gaussian-like filter with coefficients 0.25, 0.71, 1.0, 0.71 and 0.25.
.
4 Conclusion
The work shows that the geometric relationships of the meteoroid and the radar cause the notch and the jagged echoes: If the meteoroid moves more or less parallel to the radar beam, jagged echoes and small echoes are created. This then appears to reduce the rate, which then causes the notch in the rate. The more pronounced notch in the rate weighted by the sizes is caused by the fact that large echoes appear smaller.
Acknowledgements
Many thanks to Mike German and Stefanie Lück for proofreading and suggestions and comments.
Literature
Close S., Brown P., Campbell-Brown M., Oppenheim M., Colestocka P. (2007). “Meteor head echo radar data: Mass–velocity selection effects”. Icarus, 186, 547–556.
Sicking, W. (2022). “Radio observations on the Perseids and some other showers in August and September 2022”. EMetN, 7:6, 407-410.
Sicking W. (2024a). “Meteor detection using Artificial Intelligence and Machine Learning”. eMetN, 9, 29–36.
Sicking W. (2024b). “About spectrograms of meteor echoes at different stages of the radiant position – an AI/ML-investigation”. eMetN, 9,
103–112.

