Abstract:
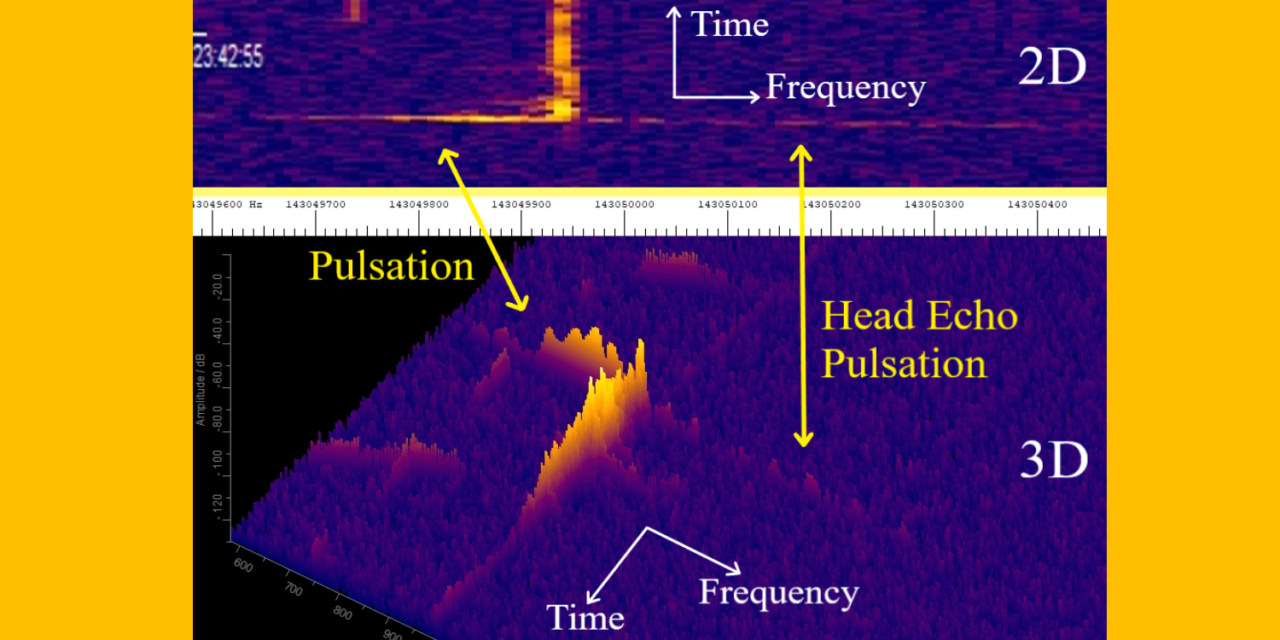
Meteor head echoes were recorded using 2D and 3D spectrograms with the GRAVES radar. Various types of pulsations are visible. According to the literature, fragmentation of the meteoroids and the resulting interference could be the cause. Some rare spectrograms show the decay of the meteoroid below the GRAVES frequency, which is normally seen above or at this frequency. These echoes show pulsations that differ from those of the head echoes. A possible explanation is given.
1 Introduction
Head echoes are caused by reflections from the plasma that directly surrounds the meteoroid. The plasma moves at about the same speed as the meteoroid (Close et al., 2007). In the 3D representation used, the newly recorded head echoes have a bulbous shape shortly before their end and show pulsations. Pulsating meteor events were observed with the EISCAT UHF radar system (Kero et al., 2008). The authors postulate that reflections from fragments lead to interference that causes the pulsations. I received the reference to fragmentation of the head echoes from Prof. Asta Pellinen-Wannberg. I asked her whether she knew of any literature on “oscillations” on head echoes.
2 Setup
The setup was described in detail in the previous article (Sicking, 2025). In order to be able to examine the head echoes in detail, one system now records 2D spectrograms, the other system logs the data in the 3D format previously used. The 2D graphic has the advantage that the temporal progression of the head echo can be seen. This means that the 2D spectrogram can be used to determine whether the head echo continues below the GRAVES frequency of 143.05 MHz or whether it is a GRAVES glitch. The speed can also be seen to a certain extent. However, amplitude changes such as the pulsations and relative sizes of the echoes can only be seen in the 3D representation. Both systems have now been set up so that head echoes can be recorded optimally. Figure 1 above shows a spectrogram in the 3D setting previously used. This means that even large trail echoes can be recorded. The lower image is optimal for head echoes.
The GRAVES carrier frequency is marked with red dots. 950 Hz on the scale corresponds to the transmitter frequency of 143.05 MHz. This is the “zero Doppler frequency” (hereinafter referred to as “zero frequency”). Very small echoes, the GRAVES carrier itself or the trail echoes can often be seen at this frequency.
The original Spectrum Lab diagrams have been cropped at the sides to make the figures fit nicely into eMetN’s two-column format. The original Spectrum Lab time and date markers have always been used.
3 Result and Discussion
The upper spectrogram in Figure 1 shows an echo from January 3rd. Shortly before the end of the head echo, a bulge can be seen. The amplitude of the reflection from the plasma increases sharply here. This bulge clearly shows the explosion / decay of the meteoroid. For small meteoroids, this is the end of the decay, see for example the inset in Figure 1 above. Further examples of small meteors can be found in the other figures. For larger explosions such as in Figure 1 above, the trail echo then usually follows at the zero frequency.
The spectrogram in Figure 1 below shows an example from January 2nd at 0:14 a.m. In addition to the bulge in front of the trail echo, it shows strong pulsations across the entire frequency range. As written above, Kero et al. explain pulsations at the head echo by interference caused by reflections from the plasma. In detail: the radar waves reflected by parallel flying particles surrounded by plasma add up or attenuate depending on the phase shift. This process is called interference or fading. Causes of the phase shift can be the changing distance and the Faraday rotation. The fluctuations initially look like oscillations, but they are not oscillations, since the Doppler shift is plotted on the X-axis. I prefer the term fading. Figures 2 and 3 show other interesting head echoes. Details are described in the Figure Captions.
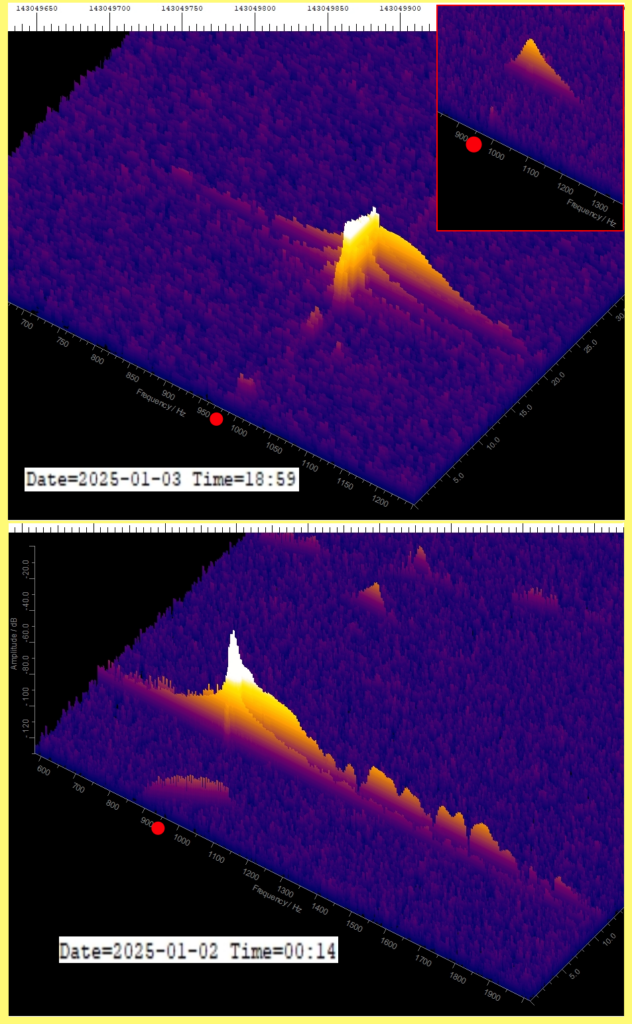
Figure 1 – The spectrogram in the lower image from January 2, 2025 0:14 a.m. shows complex pulsations across the entire range in addition to a bulge close to the trail echo. The zero frequency at 950 Hz is marked with the red dot. The spectrogram also extends below the zero frequency to the left edge. Without a 2D representation, which was not yet available here, details cannot be seen. A GRAVES glitch can be seen on the trail echo.
The upper image shows the setting that is optimal for capturing large echoes. Typical echoes from a large meteor and a small meteor are shown.
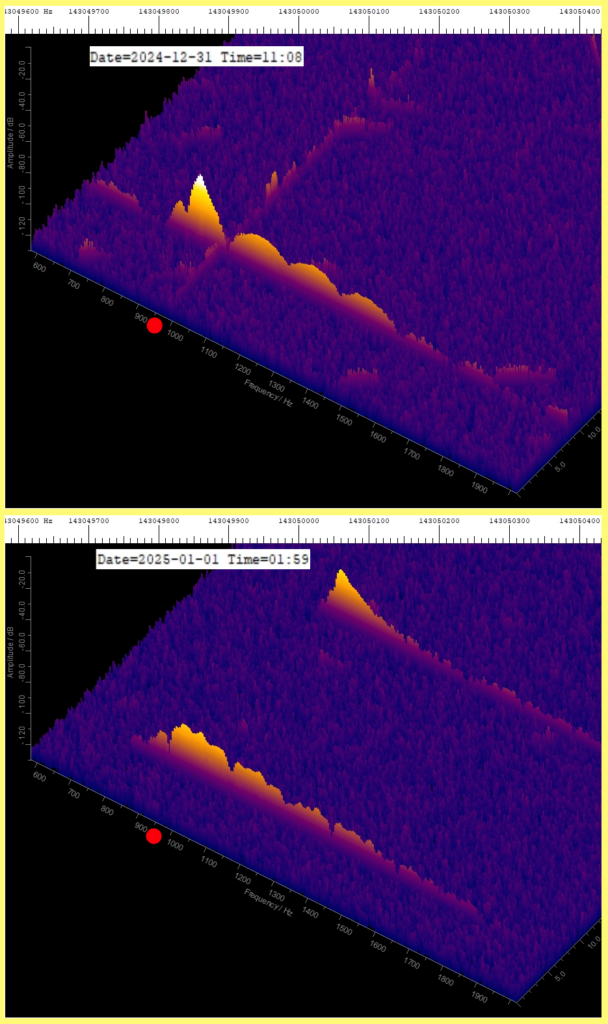
Figure 2 – Lower image: Two head echoes from January 1, 2025 1:59 a.m. The front echo shows complex pulsations. The rear head echo in the lower image appears to come from just one particle. In Figure 2 above from December 31, 2024 11:08 a.m., two particles appear to be interfering very harmoniously. In the upper image, the zero frequency is faintly visible in the spectrogram. The setup was optimized to minimize the carrier (Sicking, 2025).
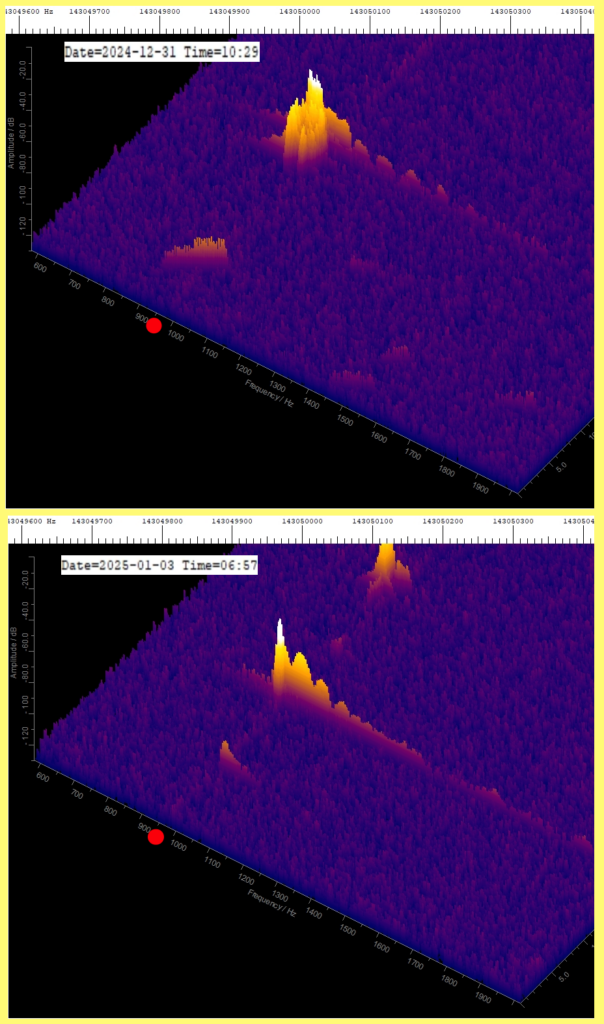
Figure 3 – Two head echoes with higher frequency pulsations from January 3, 2025 at 6:57 a.m. and from December 31, 10:29 a.m.
Evaluation with 2D and 3D spectrograms
Both systems are currently configured to record head echoes optimally. In the following three images, the 2D images were stretched in the Y direction, i.e. in the time axis, using the graphics program IrfanView and then displayed together with the 3D plot.
Figure 4 shows a 2D and a 3D representation of one and the same meteor echo. Above the zero frequency, i.e. to the right of the red dot, a weak head echo with pulsations can be seen. Below the zero frequency, i.e. to the left of the red dot, the 3D spectrogram shows the bulbous spectrum with clear and very beautiful pulsations.
Usually the decay, i.e. the bulbous spectrum, appears above the zero frequency, i.e. to the right of the red dot, see e.g. Figure 1 above. The echoes are then shifted to higher frequencies, as the meteoroid is moving towards the radar. In this case, the bulbous spectrum with the pulsations is below the zero frequency. This means that the meteoroid has moved away from the radar at this point. This is followed by the trail echo, which of course appears again at the zero frequency.
The spectrograms in Figures 1-3 also show that a significant portion of the spectrograms are below the zero frequency, i.e. to the left of the red dot. The geometry of the flight path relative to the radar, i.e. a flyby, is probably important for the registration of pulsations. Further investigations will follow.
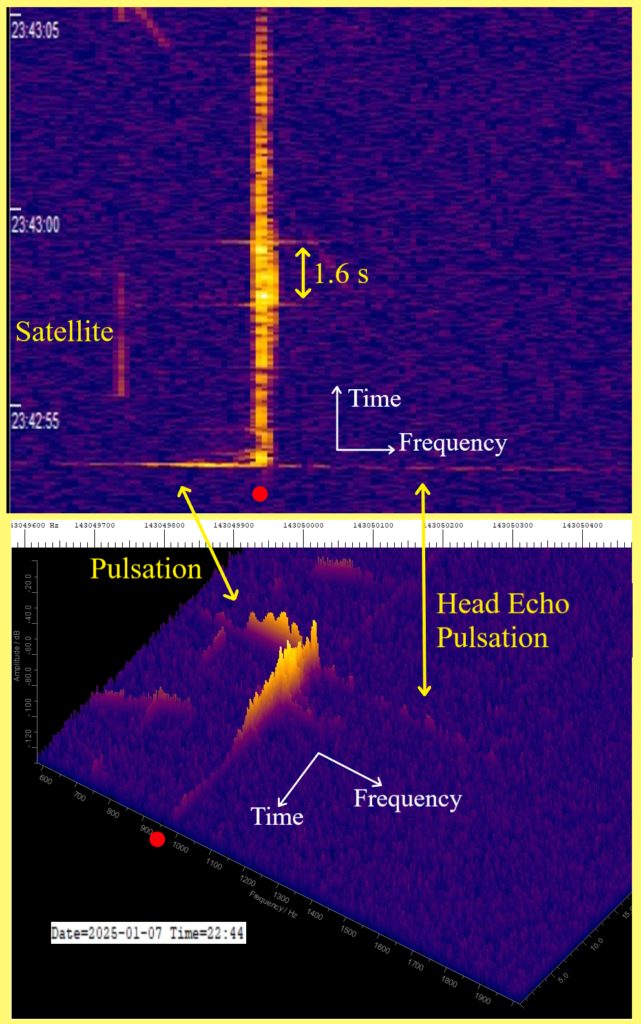
Figure 4 – Comparison of a 2D and a 3D spectrogram, see text. The recording was made on January 7, 2025 at 10:44 p.m. The 2D plot shows that the parts of the head echo above and below the zero frequency and the trail echo belong to one meteor echo. Using the GRAVES glitches as time markers, you can determine that the head echo was in the center of a 1.6 s window of the GRAVES transmitter. The local time is displayed in the upper part, on the left edge of the image. The two recording PCs have the same time setting. Spectrum Lab shows a one minute difference between the times on the left edge and the time/date stamps. The cause is not yet known.
Figure 5 shows a similar image to Figure 4. However, the head echo is much more pronounced and shows a slow pulsation with a minimum in the center of the image. A weak pulsation below the zero frequency with a short period can be seen. The 2D plot confirms that this is not a satellite or a GRAVES glitch.
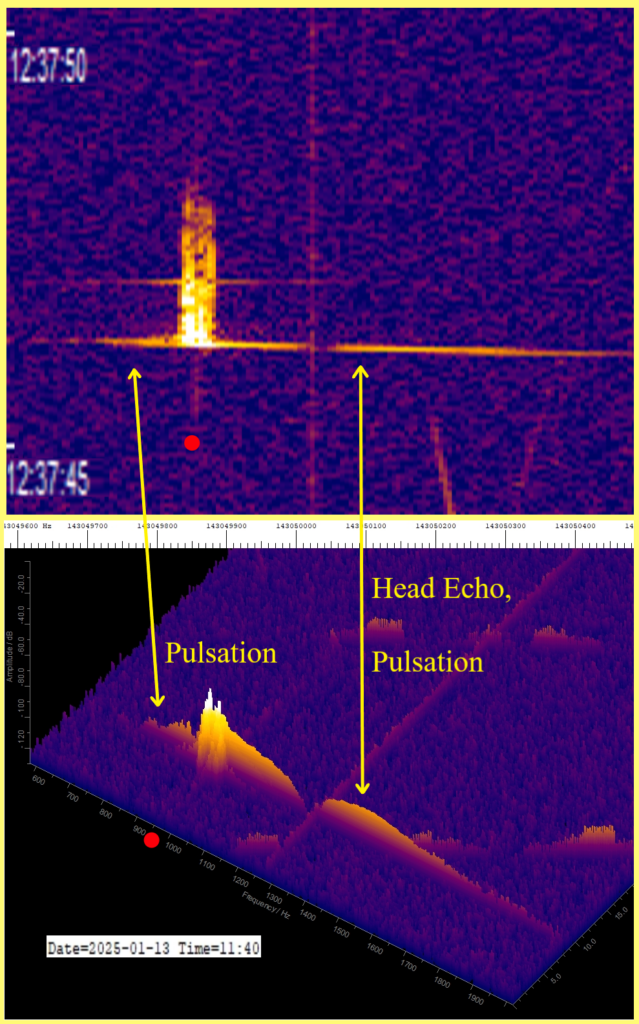
Figure 5 – Images from January 13, 2025 at 11:40 a.m. A slow pulsation above the zero frequency and a faster pulsation below can be seen. Some satellite echoes are in the image. The carrier in the center of the image is a disturbance that occurs occasionally at midday.
Figure 6 shows a head echo with a slow pulsation, like Figure 5, but weaker than in Figure 5. There is no head echo signal below the zero frequency (left of the red dot). The bulbous spectrum above the zero frequency (right of the red dot) and the trail echo show the standard decay.
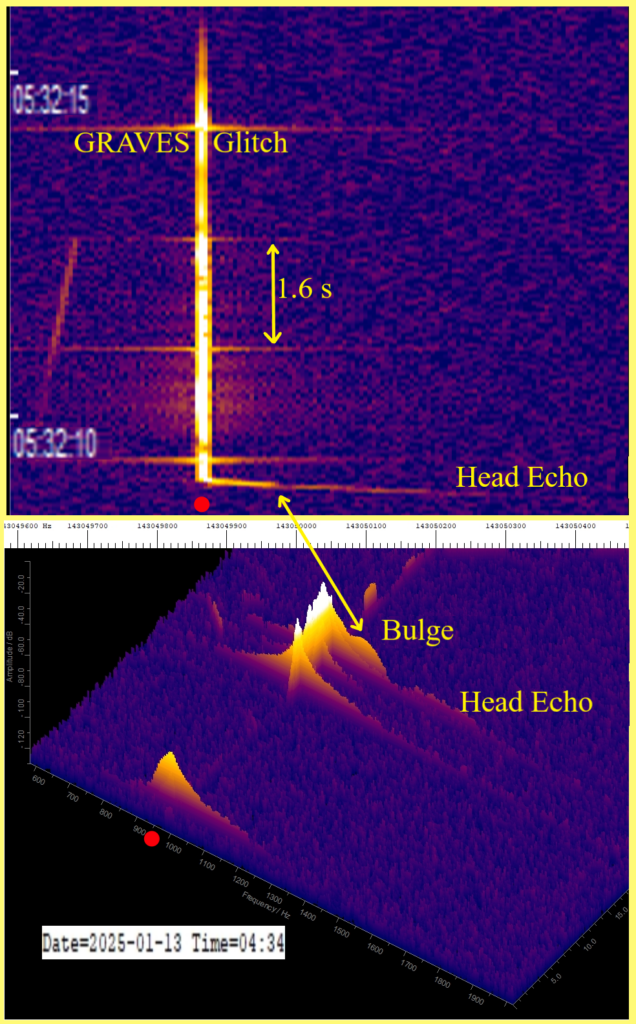
Figure 6 – Recordings from January 13, 2025 at 4:34 a.m. In the 2D representation, it is clearly visible that there is no head echo below the zero frequency. Because of the glitches, the 3D representation is confusing in this area. Echoes like the echo at the zero frequency are always present in large numbers.
Figure 7 shows three interesting meteor echoes. They have only a weak or no head echo, no trail echo, but pulsations on the echo below the zero frequency, comparable to the pulsations in Figure 4. The spectra are essentially below the zero frequency, see also Figure 8. This means that the meteoroid with its plasma cloud is moving away from the radar. So the radar is looking at the plasma cloud from behind. The interferences that cause the pulsations are probably caused by reflections at the interfaces of the ionized gases, whose reflection behavior changes due to turbulence.
This assumption is plausible because the pulsations are very similar in all spectrograms (compare Figures 4 and 7), and the pulsations are still very pronounced at low Doppler shift (at the left edge), although the intensity of the echo has already decreased significantly there. I have a few more images of this type, but such spectrograms are rare.
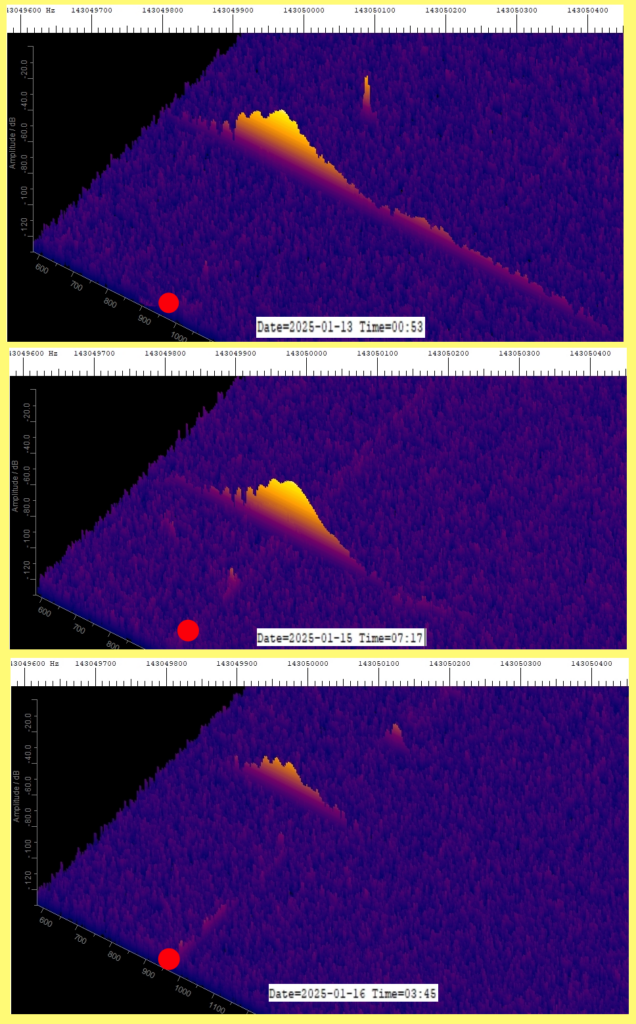
Figure 7 – Three spectrograms showing the bulge with pulsations below the zero frequency, indicated by the red dot.
Finally, Figure 8 compares the 2D spectrograms from Figure 6 from January 13, 2025 at 4:34 a.m. and Figure 7, top spectrogram, from January 13, 2025 at 0:53 a.m. The graph shows that the lower echo extends below the zero frequency and that the maximum of the explosion is below the zero frequency. In the upper image, the explosion / bulge is above the zero frequency. It can also be seen (at least with the help of a graphics program) that the lower head echo is faster, probably due to the trajectory.
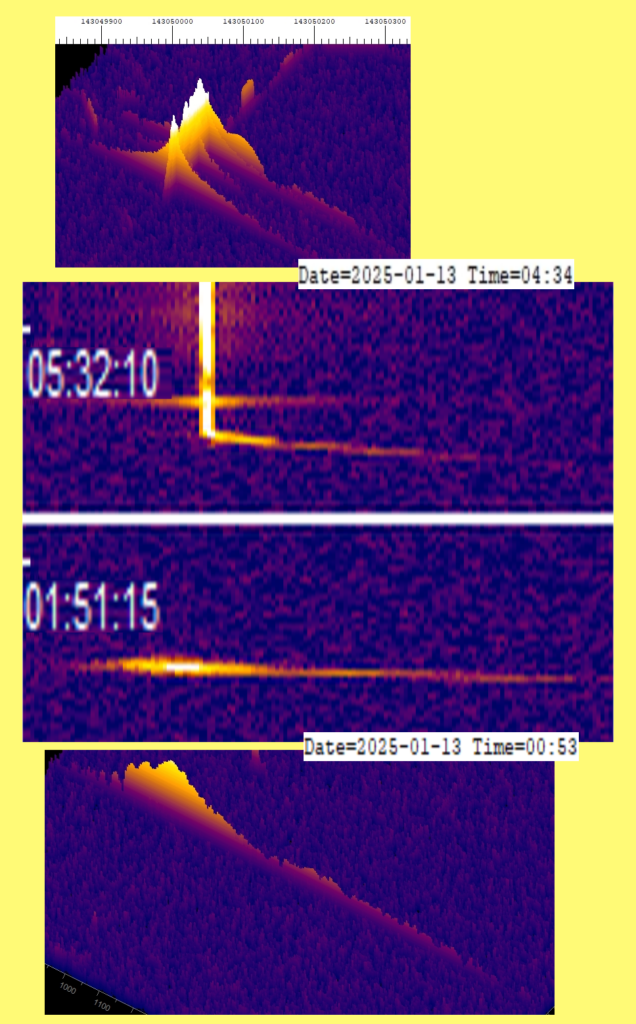
Figure 8 – Comparison of the 2D spectrograms from Figure 6 from January 13, 2025 at 4:34 a.m. and from Figure 7, top spectrogram, from January 13, 2025 at 0:53 a.m. The original 2D spectrograms were first copied exactly together and then stretched identically by a factor of 15. The time digits were stretched independently and may not be to scale. The two 3D images are not to scale. The times at the edge have an offset. The trail echo marks the zero frequency.
4 Conclusion
The 3D representation of the spectrograms obtained with the powerful GRAVES radar provides well-resolved 3D spectrograms of head echoes. My previous work had already shown that the 3D spectrogram can be used to detect when meteoroids and radar beams are parallel. In this work it was shown that the GRAVES radar can be used to study pulsations. For further investigations I will improve the resolution of the 2D spectrograms to below 10 ms if possible.
Acknowledgements
Many thanks to Mike German for suggestions and comments. This taught me a lot about interpreting the spectrograms. I adopted the term zero frequency from Mike German. Many thanks also to Asta Pellinen-Wannberg for the information and the literature by Kero et al.
Literature
Close S., Brown P., Campbell-Brown M., Oppenheim M., Colestocka P. (2007). “Meteor head echo radar data: Mass–velocity selection effects”. Icarus, 186, 547–556.
Kero, J., Szasz, C., Pellinen-Wannberg, A., Wannberg, G., Westman, A., and Meisel, D. D. (2008). “Three-dimensional radar observation of a submillimeter meteoroid fragmentation”. Geophysical Research Letters, 35, L04101.
Sicking W. (2025). “About Spectrograms of Meteor Echoes at Different Stages of the Radiant Position of the Quadrantids 2025 – an AI/ML-Investigation”. eMetN, to be published.

