Lorenzo Barbieri (CARMELO network and AAB: Associazione Astrofili Bolognesi)
Mariasole Maglione (Gruppo Astrofili Vicentini)
Introduction
The CARMELO network consists of SDR radio receivers. In them, a microprocessor (Raspberry) performs three functions simultaneously:
- By driving a dongle, it tunes the frequency on which the transmitter transmits and tunes like a radio, samples the radio signal and through the FFT (Fast Fourier Transform) measures frequency and received power.
- By analyzing the received data for each packet, it detects meteoric echoes and discards false positives and interference.
- It compiles a file containing the event log and sends it to a server.
The data are all generated by the same standard, and are therefore homogeneous and comparable. A single receiver can be assembled with a few devices whose total current cost is about 210 euros.
To participate in the network read the instructions on this page.
August data
In the graphs that follow, all available at this page, the abscissae represent time, which is expressed in TU (Tempo Universale – Universal Time), and the ordinates represent the hourly rate, calculated as the total number of events recorded by the network in an hour divided by the number of operating receivers.
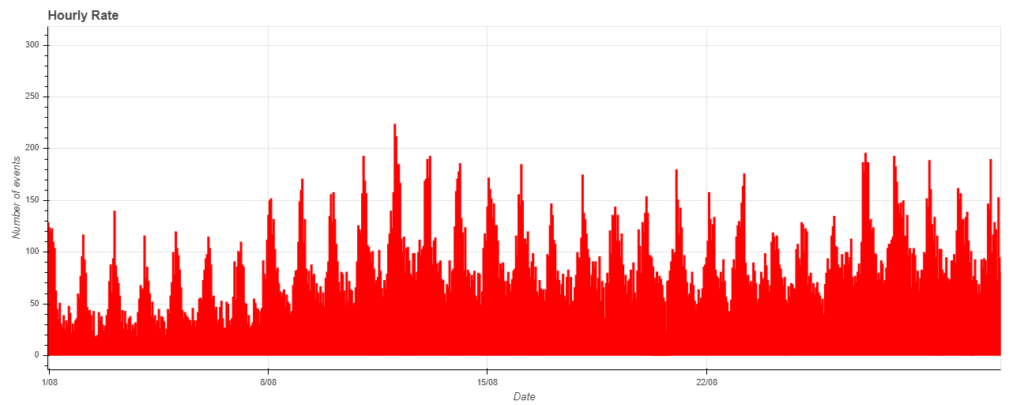
Fig. 1: August data trend from the CARMELO network.
The Perseid meteor shower reaches its peak activity every year before the middle of August, of which it becomes the real main character. This shower is caused by the debris left behind by comet Swift-Tuttle, which, entering Earth’s atmosphere at a speed of 61 km/s, disintegrate to create the characteristic light trails.
During this period, the hourly rate of observed meteors showed a significant increase. The graph for the month of August [fig 1.] clearly shows this increase, particularly between August 11 and 13, due to the increased density of meteoroids in the regions crossed by Earth on those days.
Perseids hourly rate
Analyzing the days from August 11 to 13 in detail, we see:
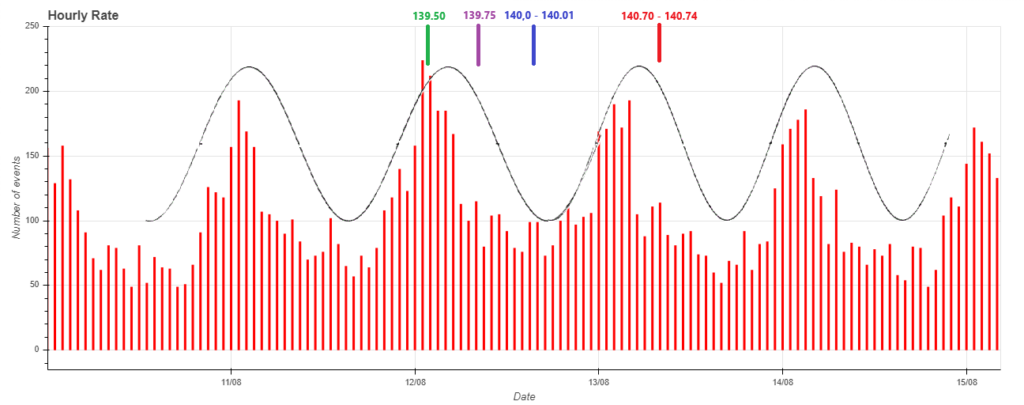
Fig. 2: Details of the three days from August 11 to 13.
In this graph, the black sinusoidal line represents the height of the radiant, or the point in the sky where the meteors appear to come from, corresponding to the direction from which the Earth passes through the debris flow. The radiant depends on location, because its position with respect to the horizon varies with latitude and time of day, affecting the number of meteors observable in that area, and thus the hourly rate. The graph shows the trend for an average Italian location.
An increase in the hourly rate can be seen at the expected peak, when the solar longitude reaches 140.0° to 140.1° (indicated by the blue arrow). However, this peak, which is the time when the greatest number of meteors is expected during a swarm, occurred precisely when the radiant was lowest on the horizon, at the time of minimum observability.
We can also see a correspondence between the increase in the hourly rate of meteors and the predictions of J. Rendtel and J. Vaubaillon (1), who predicted the encounter of the Earth with some very old strands of debris, which they called dust trails. The first occurred at solar longitude 139.50° (on August 12 at 04:50 TU), indicated in the chart with a green line. The second occurred at solar longitude 139.75° (on August 12 at 07:19 TU), marked with a line arrow. The third at solar longitude 140.70°-140.74°(on August 13 between 07:00 and 08:00 TU). These dust trails come from ancient passages of comet Swift-Tuttle, and contributed to the increase in observed meteors. According to the authors, they are very old: dating back to passages more than 1300 years ago.
To make an approximate assessment of the diameter of these filaments, consider the Earth speed in its motion in the Solar System, which is 107 000 km/h. A filament such as the first, at which the increase in the hourly rate we detected is about two hours, could therefore have a diameter greater than or equal to 200 000 km by considering it, in an arbitrary and coarse manner, to be cylindrical in shape.
Meteoroid mass and saturation
Analyzing the duration of the echoes, we see that the average durations tend to increase around 11 to 12 TU on August 12, thus ahead of the peak hourly rate by about 5 to 6 hours. This fact, if we consider that longer duration of the echoes is associated with larger meteoroids, suggests that the largest fragments of the Perseids shower could be encountered by the Earth about 500 000 km before the peak time of the shower, preceding the peak [fig. 3].
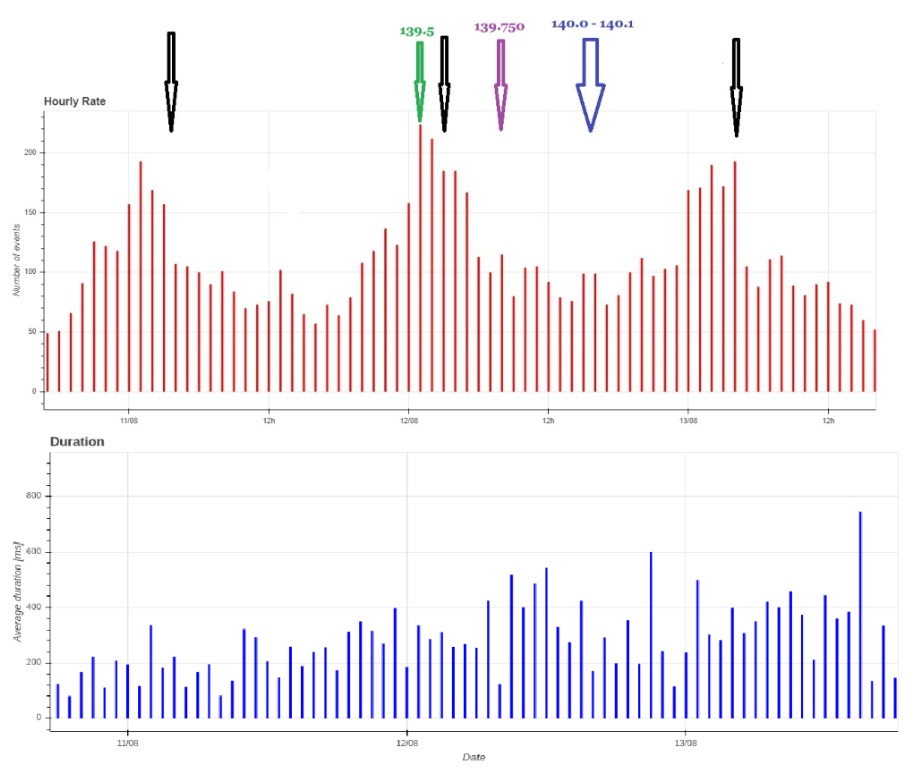
Fig. 3: Comparison of echoes hourly rate and duration.
Perseids speed
The Perseids are one of the fastest meteor showers. The result of this was the high number of “oversaturated” meteor echoes, i.e., signals that were particularly intense in terms of both the duration of the echoes and the intensity of the radio signal received.
We had to increase the scale of the graphs representing the intensity of the signals, since some of them were significantly louder, exceeding the levels recorded during the rest of the year by several decibels.
Precisely because of the great speed of the meteors, it was also easier to observe the leading echoes, which are the signals reflected from the front of the ionization cylinder created by the meteors in their trajectory. Because velocity affects the way the ionization trail moves, head echoes can show obvious Doppler effects, thus shifts in signal frequency, due to the meteoroid’s fast movement through the atmosphere.
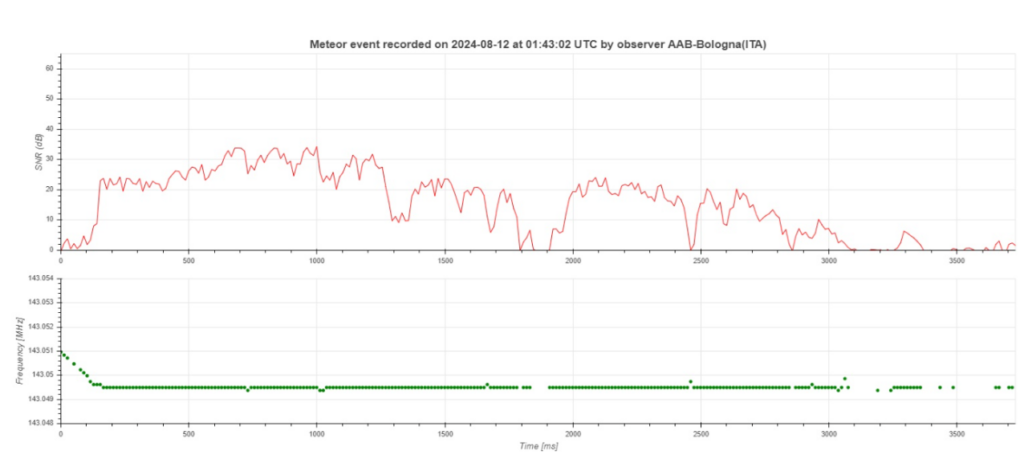
Fig. 4: Head echoes preceding specular reception.
Fragmentations
Again, because of the large kinetic energy of these meteors, many more signals from fragmentations were recorded during the shower period.
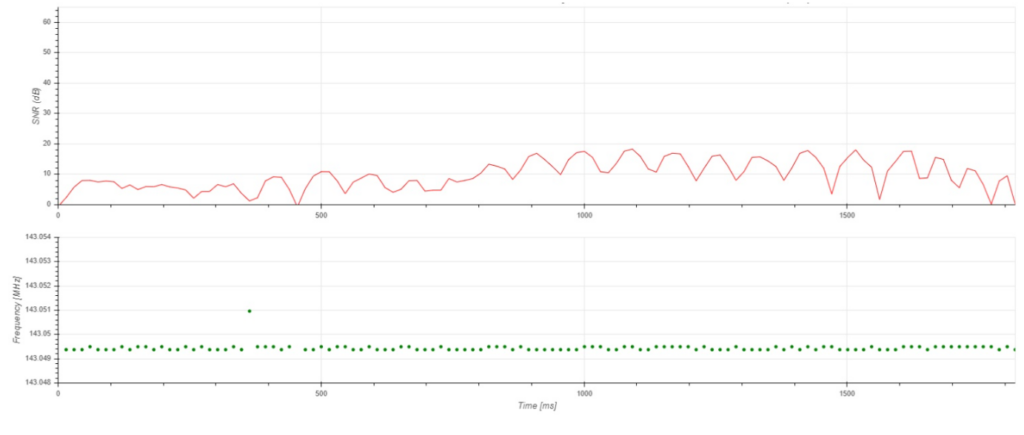
Fig. 5: Echoes from fragmented meteor. The variation in amplitude can be explained by the sum of the contributions of echoes from two or more fragments, which, depending on their distance from each other, provide different echoes that add up to different phases.
In fig. 5 one of many echoes from fragmented meteors. The physics of this phenomenon is described by W. Graham Elford and L. Campbell (2).
We also noted two cases of head echoes from a fragment that most likely belonged to a “train” of fragments: one of these two cases is shown in fig. 6.
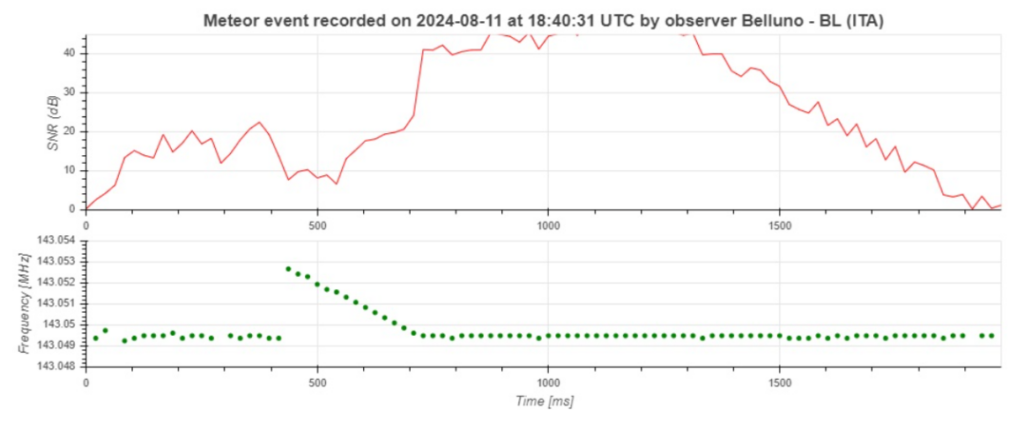
Fig. 6: In the first 400 milliseconds the echo of the specular reception of a first fragment is seen. Then the echo is overlaid by the leading echo and the following specular reception of a larger fragment, which follows the first one.
Such signals had never appeared in two years of CARMELO network observations, but during the Perseids 2024 swarm we saw two of them.
The CARMELO network
The network currently consists of 14 receivers, 13 of which are operational, located in Italy, the UK, Croatia and the USA. The European receivers are tuned to the Graves radar station frequency in France, which is 143.050 MHz. Participating in the network are:
- Lorenzo Barbieri, Budrio (BO) ITA
- Associazione Astrofili Bolognesi, Bologna ITA
- Associazione Astrofili Bolognesi, Medelana (BO) ITA
- Paolo Fontana, Castenaso (BO) ITA
- Paolo Fontana, Belluno (BL) ITA
- Associazione Astrofili Pisani, Orciatico (PI) ITA
- Gruppo Astrofili Persicetani, San Giovanni in Persiceto (BO) ITA
- Roberto Nesci, Foligno (PG) ITA
- MarSEC, Marana di Crespadoro (VI) ITA
- Gruppo Astrofili Vicentini, Arcugnano (VI) ITA
- Associazione Ravennate Astrofili Theyta, Ravenna (RA) ITA
- Akademsko Astronomsko Društvo, Rijeka CRO
- Mike German a Hayfield, Derbyshire UK
- Mike Otte, Pearl City, Illinois USA
The authors’ hope is that the network can expand both quantitatively and geographically, thus allowing the production of better quality data.
References
(1) Jurghen Rendtel, Jeremie Vaubaillon (2024): “Observing the Perseid maximum in 2024”. WGN Journal of the International Meteor Organization 52:2 p. 27-28.
(2) W. Graham Elford, L. Campbell (2001): “Effects of meteoroid fragmentation on radar observations of meteor trails”. Proceedings of the Meteoroids 2001 Conference, 6 – 10 August 2001, Kiruna, Sweden. Ed.: Barbara Warmbein. ESA SP-495, Noordwijk: ESA Publications Division, ISBN 92-9092-805-0, 2001, p. 419 – 423.