Hiroshi Ogawa and Hirofumi Sugimoto
Abstract: Radio meteor observations in the world detected three unexpected peaks in the Perseid activity profile of 2024 before and after the annual peak around λʘ = 140.00°. They occurred at λʘ = 139.75°–139.79° (August 12, 7h30m –8h30m UT), λʘ = 140.07°–140.15° (August 12, 15h30m -17h30m UT) and λʘ = 140.75° (August 13, 8h30m UT). The third peak was the strongest activity with Activity Level = 3.2 ± 0.4 and an estimated ZHRr = 160 ± 5 at λʘ = 140.75°.
1 Introduction
The Perseids are one of the strongest meteor showers in a year. The shower reaches a maximum with a ZHR = 100 at λʘ = 140.0° for visual observers (Rendtel, 2023).
Radio Meteor Observation is also able to obtain a complete activity profile. In past research, activity profiles were derived from worldwide radio data from Radio Meteor Observation Bulletin (RMOB). As a result, The International Project for Radio Meteor Observations (IPRMO) which is organized to analyze a complete meteor shower activity without problems with radiant elevation and unstable weather, concluded that the peak of the Perseids occurred at λʘ = 140.0° with FWHM (Full Width of Half Maximum) = –0.7°/+0.8° and a peak Activity Level of 1.2 (Ogawa, 2022).
For 2024, the Meteor Shower Calendar published by the International Meteor Organization (IMO) described a possible encounter with a weak filament on August 12 around λʘ = 139.81 and five very old trails between λʘ = 139.6 and λʘ = 139.9.
This paper reports the result for the Perseids 2024 using worldwide radio meteor observations.
2 Method
For analyzing the worldwide radio meteor observation data, the meteor activity is calculated by the “Activity Level Index: AL(t)” (Ogawa et al., 2001) and the estimated Zenithal Hourly Rate: ZHRr(t) (Sugimoto, 2017). The activity profile was estimated using the Lorentz activity profile (Jenniskens et al., 2000).
This year, AL used 46 data from 14 countries and a ZHRr was calculated from 35 observers. These data were provided by observes that reported to RMOB and Japanese observers.
3 Results
Figure 1 and 2 show the results of AL and an ZHRr. The first peak with AL = 2.6 ± 0.3 was observed at λʘ = 139.79° (August 12, 8h30m). The estimated ZHRr reached 123 ± 7. A secondary peak was observed at λʘ = 140.07° (August 12, 15h30m UT) with AL = 2.2 ± 0.3 (ZHRr = 105 ± 3). A third peak which was the strongest during this year was detected at λʘ = 140.75° (August 13, 08h30m UT) with AL = 3.2 ± 0.4, (ZHRr = 159 ± 5).
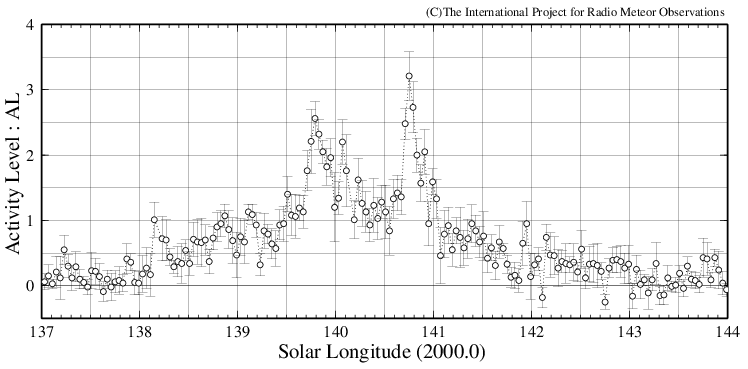
Figure 1 –Activity Level Index using 46 datasets worldwide.
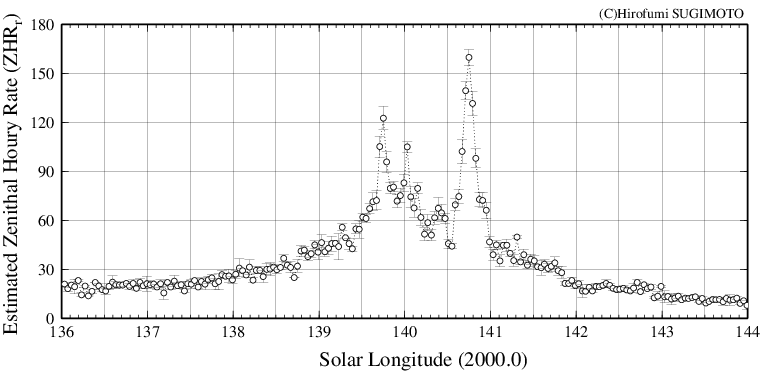
Figure 2 – Estimated ZHRr using 35 datasets worldwide.
Table 1 – The estimated ZHRr and Activity Level Index (AL).
| Peak Time (UT) | λʘ (˚) | Activity Level (AL) | ZHRr |
| Aug 12 08h30m | 139.79 | 2.6±0.3 | 123±7 |
| Aug 12 15h30m | 140.07 | 2.2±0.3 | 105±3 |
| Aug 13 08h30m | 140.75 | 3.2±0.4 | 159±5 |
4 Discussion
4.1 Components of three peaks
Figure 3 and 4 show that the AL and ZHRr of the Perseids 2024 displayed four components including a traditional component by using the Lorentz profile. Table 2 shows the estimated components and some references.
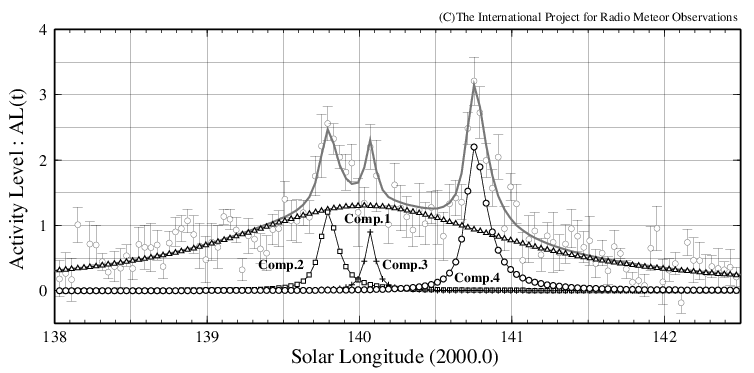
Figure 3 – The Activity Level Index: the estimated components using the Lorentz Profile (solid line: total activity of Comp1- Comp4).
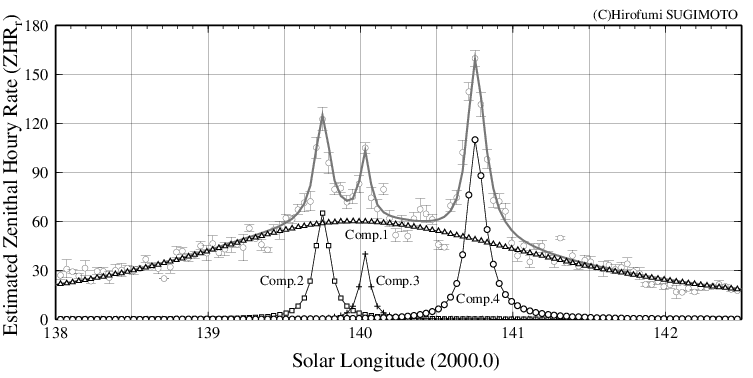
Figure 4 – The estimated ZHRr: the estimated components using the Lorentz Profile (solid line: total activity of Comp1- Comp4).
Table 2 – The estimated components using the Lorentz profile and some references.
|
Radio Results by IPRMO |
References |
||||||
|
|
Peak Time (UT) | λʘ | FWHM (hours) | Peak Level | Peak Time (UT) | λʘ | Source |
| Comp.1 | Aug 12. 12h30m -14h30m | 139.95° – 140.03° |
-28.0/+29.0 | AL=1.3 (ZHRr=60) | Aug 13. 13h-16h | 140.0° – 140.1° |
annual |
| Comp.2 | Aug 12. 08h30m-09h30m | 139.75° – 140.79° |
-1.5/+2.0 | AL=1.2 (ZHRr=65) | Aug 12. 09h | 139.81° | P.Jenniskens |
| Aug 12. 04h-11h | 139.61° – 139.91° |
J. Vaubaillon | |||||
| Comp.3 | Aug 12. 14h30m-15h30m | 140.03° – 140.07° |
-1.0/+1.0 | AL=0.9 (ZHRr=40) | |||
| Comp.4 | Aug 13. 08h30m | 140.75° | -1.5/+2.5 | AL=2.2 (ZHRr=110) |
|
||
4.1.1 Component 1
This component corresponds to the traditional activity. The peak occurred at λʘ = 139.95° – 140.03° (August 12, 12h30m – 14h30m UT). The maximum AL was 1.3 (ZHRr = 60). It was the same activity level and peak time as the past average (Ogawa, 2022).
4.1.2 Component 2
The first peak occurred as the Component 2 (Comp.2). This component had AL(max) = 1.2 at λʘ = 139.75° – 139.79° (August 12, 08h30m – 09h30m UT). According to P. Jenniskens, there was a possibility to observe a weak filament around 139.81°. Although Comp.2 produced a similar result as this forecast, it might be different from the prediction because the activity level was higher than expected. P. Jenniskens indicated that the activity level was about one tenth of the 2018 filament. Radio Meteor Observation detected a filament with AL = 0.5 during the 2018 Perseids. Another possibility, five old dust trails predicted by J. Vaubaillon could be encountered between 139.61° and 139.91°. It is possible that Comp.2 mixed these resources.
4.1.3 Component 3
After a first peak, a sharp component was estimated as Comp.3. The maximum AL was 0.9 at 140.03° – 140.07°. This component was uncertain because the FWHM was too narrow (the possibility of a random error) and there was no prediction.
4.1.4 Component 4
A big surprise third peak was estimated as Comp.4. It had a maximum AL = 2.2 and correspond to ZHRr = 110. Although this activity was unexpected, it was very distinct activity in Europe and North-America. The strong activity began around λʘ = 140.59° (August 13, 04h30m UT). The peak was estimated at λʘ = 140.75° (August 13, 08h30m UT). After that, it ended around λʘ = 141.03° (August 13, 15h30m UT). The descending branch was longer than the ascending branch.
4.2 Compare with recent results
In the past, an unpredicted peak after the annual peak was sometimes observed. Figure 5 shows results for AL between 2021 and 2024. In 2021, many observers were surprised by a strong activity around λʘ = 141.48° with AL = 3.7 (ZHRr = 220) (Miskotte et al., 2021). Therefore, it was a stronger activity in 2021 than in 2024. In 2023, a sub-peak after the main peak was observed at λʘ = 140.84° with AL = 1.9 (ZHRr = 126). It is possible that this activity was released by some very old dust trails (Sugimoto and Ogawa, 2023). For 2022, two small sub-peaks around λʘ = 141.09° and 141.53° with AL = 1.4 and AL = 1.3were also observed.
Miskotte and Vandeputte (2020), Miskotte (2020) and Roggemans (2023) also described the detection of sub-peaks between λʘ = 140.5° and λʘ = 141.6°.
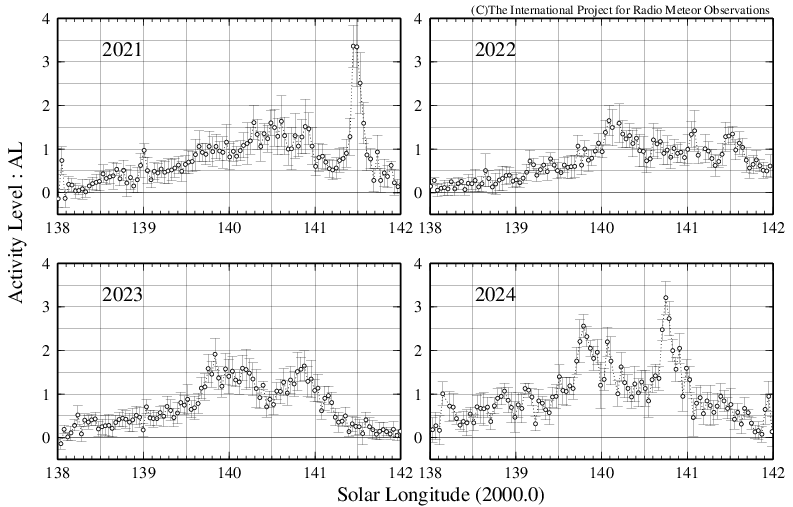
Figure 5 – Activity Level Index between 2021 and 2024.
5 Conclusion
For 2024, worldwide radio meteor observers caught three unusual peaks. The third peak at λʘ =140.75°was very strong and a distinct activity. AL reached 3.2 and the estimated ZHRr = 159.
In recent years, similar sub-peaks were observed such as in 2021 and 2023. The origin of these unusual sub peaks isn’t clear yet, but this needs to be monitored in the future.
Acknowledgment
The worldwide data were provided by the Radio Meteor Observation Bulletin (RMOB). The following observers provided data:
Chris Steyaert (Belgium), Felix Verbelen (Belgium), Jacques Molne (France), DDeneuchatel SAT01 (France), Philippe RAINARD (France), Pierre Terrier (France), WHS Essen (Germany), Observatory Szeged (Hungary), Vilmos Keresztesi (Hungary), AAV Planetario_di_Venezia (Italy), GABB .IT (Italy), Mario Bombardini (Italy), Hirofumi Sugimoto (Japan), Masaki Kano (Japan), Masaki Tsuboi (Japan), Minoru Harada (Japan), Norihiro Nakamura (Japan), Jean-Claude Thibaut (Luxembourg), Rainer Ehlert (Mexico), Salvador Aguirre (Mexico), Kees Habraken (Netherlands), MAR JEN (Poland), UMa Astronomy (Slovakia), Joan Figueras (Spain), Nick Norman (United Kingdom), Peter Franklin (United Kingdom), Philip Rourke (United Kingdom), Philip Norton (United Kingdom), Philip NortonVert (United Kingdom), Stephen Grimes (United Kingdom), Steve Grimes2 (United Kingdom), Tracey Harty (United Kingdom), Mike Otte (United States of America), Stanley Nelson (United States of America).
We wish to thank Pierre Terrier for developing and hosting rmob.org. A very special thank you to Paul Roggemans for proofreading this article.
References
Jenniskens P., Crawford C., Butow S. J., Nugent D., Koop M., Holman D., Houston J., Jobse K., Kronk G., and Beatty K. (2000). “Lorentz shaped comet dust trail cross section from new hybrid visual and video meteor counting technique imprications for future Leonid storm encounters”. Earth, Moon and Planets, 82–83, 191–208.
Miskotte K. and Vandeputte M. (2020). “Perseids 2019: another peak in activity around solar longitude 141.0?”. eMetN, 5, 25–29.
Miskotte K. (2020). “Perseids 2020: again, enhanced Perseid activity around solar longitude 141?”. eMetN, 5, 395–397.
Miskotte K., Sugimoto H. and Martin P. (2021). “The big surprise: a late Perseid outburst on August 14, 2021!”. eMetN, 6, 517–525.
Ogawa H., Toyomasu S., Ohnishi K., and Maegawa K. (2001). “The Global Monitor of Meteor Streams by Radio Meteor Observation all over the world”. In, Warmbein Barbara, editor, Proceeding of the Meteoroids 2001 Conference, 6-10 August 2001, Swedish Institute of Space Physics, Kiruna, Sweden. ESA Publications Division, European Space Agency, Noordwijk, The Netherlands, 189–191.
Ogawa H. (2022). “Long-Term Studies of Major and Daytime Meteor Showers using Worldwide Radio Meteor Observations”. WGN, Journal of the IMO, 50, 148–157.
Rendtel J. (2023). “2024 Meteor Shower Calendar”. International Meteor Organization
Roggemans P. (2023). “Unusual Perseid activity in 2023”. eMetN, 8, 283-284.
Sugimoto H. (2017). “The new method of estimating ZHR using Radio Meteor Observations”. eMetN, 2,
109–110.
Sugimoto H. and Ogawa H. (2023). “Perseids 2023 by worldwide radio meteor observations”. eMetN, 8, 285-287.
