Abstract: The radiant distribution map gives the results of regression analysis for the radiant shift and shows the shape and spread of the radiant distribution.
The activity profile is based on meteors that fall within 3 degrees from the center of the radiant map. As shown in the example of the Orion group in part I, “Research methods and summary of survey results” (Koseki, 2024a). GMN data were strongly influenced by observation conditions in 2022, so we have avoided discussing the number of meteors themselves as much as possible. In addition, the DR used is changed as appropriate to avoid being affected by other meteor showers active in the surrounding area. Which DR or the meteor number itself was used, is shown in the graphs as the type of activity profile.
Basically, we use the ratio of meteors within 3 degrees from the center for each degree of solar longitude to meteors within, for example, 15 to 20 degrees (written as DR3_20). Naturally, this calculation considers the area of each range. This ratio is plotted as a moving average of 0.1 degrees in solar longitude. If the number of meteors that appear is small or the activity is irregular, a ratio is calculated from the number of meteors every 3 degrees in the solar longitude, and a moving average for a one-degree solar longitude bin has been calculated. In this case, it is written in lowercase letters, such as dr3_20.
Introduction
A brief explanation of each meteor shower is included. Cases that require detailed discussion, such as cases where the meteor shower classification differs from the IAUMDCSD’s, are covered separately in part II “Meteor showers that need careful attention” (Koseki, 2024b). Radiant point distribution maps and activity curves are shown for the 118 meteor showers listed in Tables 4 to 7 of part I, “Research methods and summary of survey results” (Koseki, 2024a).
Table 1 – Overview of the meteor showers discussed in this study. Click on the meteor shower code to consult the data.
| Code | λʘ | Code | λʘ | Code | λʘ | Code | λʘ | Code | λʘ | Code | λʘ |
| BCO | 13 | JEC | 82.6 | SDA | 126.9 | OCT | 192.55 | NSU | 241.7 | KVE | 274.9 |
| ZCY_0 | 16 | JRC | 84 | ERI | 132.3 | SAN | 196.8 | NOO | 246.1 | JLE | 281.6 |
| DHE | 19.6 | SSG | 87 | AXC | 135.5 | XIE | 198.2 | ORS | 246.2 | QUA | 283.25 |
| AED | 20 | JBO | 90.3 | PER | 140.5 | STA_SE | 201.5 | NAC | 246.5 | AHY | 283.8 |
| PSR | 24.7 | DPI | 91.2 | KCG | 141.5 | OCU | 202.5 | TPY_0 | 249.4 | OLE | 288.3 |
| AVB | 25 | JEO | 92 | ADC | 143.65 | EGE | 203.7 | DKD | 251 | XCB | 294.8 |
| ZCY_1 | 31.5 | JIP | 94.1 | AXD | 147.2 | LMI | 209.2 | PSU | 251.5 | XUM | 298.6 |
| LYR | 32.3 | FPE | 95.8 | NDA | 149 | TCA | 209.5 | DAD | 253.5 | GUM | 299.8 |
| HVI | 39 | PPS_0 | 98.5 | ZDR | 153.2 | ORI | 209.5 | HYD | 255.4 | ACB | 307.5 |
| ARC | 39.5 | NZC | 101 | AGC | 155.4 | LUM | 214.8 | DRV | 255.6 | AAN | 312.5 |
| BAQ | 44 | MIC | 101.3 | AUR | 158.4 | SLD | 221.5 | EHY | 256.2 | FED | 314.84 |
| ETA | 44.3 | TCS | 104.6 | PSO | 160.4 | STA_SF | 222.2 | PUV | 256.5 | FHY | 325.4 |
| GAQ | 48 | CAN | 105 | OMG | 163.2 | KUM | 222.8 | MON | 258.1 | TTR | 332.1 |
| PCY | 49.5 | JPE | 109.6 | NUE | 165.5 | OER | 223 | GEM | 261.85 | DNO | 334.2 |
| ELY | 50.2 | ZCS | 113.6 | SPE | 166.9 | AND | 224.5 | XVI | 262.8 | TSB | 343.7 |
| MBC | 55 | JXA | 115 | NPI | 167.2 | RPU | 226.2 | DAB | 263.1 | XHE | 351.9 |
| TAH | 69.45 | XCS | 116.3 | SLY_0 | 169.5 | NTA | 226.5 | TPY_1 | 264.3 | EVI | 358 |
| PAN | 72 | PPS_1 | 117.5 | CCY | 173.4 | LEO | 235.4 | COM | 267.5 | EOP | 358.2 |
| JMC | 72 | GDR | 125.5 | DSX | 188.5 | ACA | 239.5 | URS | 270.65 | ||
| ARI | 79.5 | CAP | 126.9 | SLY_1 | 191.5 | AMO | 239.6 | DSV | 271.5 |
0647BCO: beta-Comae Berenicids
λʘ = 13°, λ–λʘ = 174.6°, β = 30.1°, α = 199.6°, δ = 24.5°, vg = 26.6 km/s.
This group was not covered in the previous article and is not listed in SonotaCo net J14 list. IAUMDC only lists one CAMS observation. The number of meteors is not large, the radiant points are scattered, and the maximum is unclear, so BCO is close to the lower limit of this shower list.
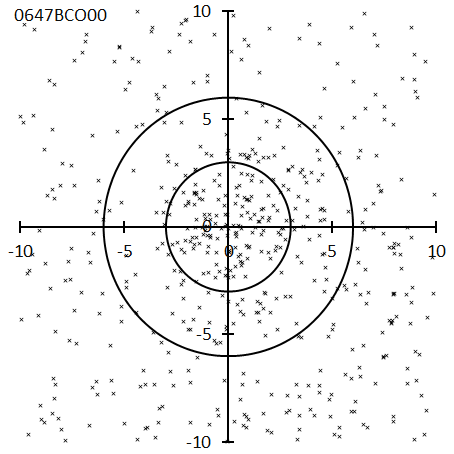
Figure 1 – Radiant point distribution map for the beta-Comae Berenicids.
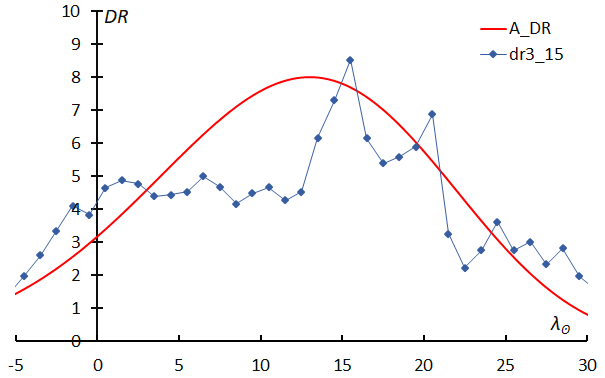
Figure 2 – Activity profile for the beta-Comae Berenicids.
0040ZCY_0: zeta-Cygnids
λʘ = 16°, λ–λʘ = 300.4°, β = 59.1°, α = 299.2°, δ = 40.2°, vg = 43.5 km/s.
0040ZCY and 0348ARC are described in detail in Part II. “Meteor showers that need careful attention” (Koseki, 2024b). As seen in the radiant distribution and activity profile shown in Figures 3 and 4, this is on the boundary between a coincidental increase in scattered meteor activity and what is recognized as meteor shower activity. Here, based on the activity curve, ZCY is divided into ZCY_0 around λʘ = 15° and ZCY_1 around λʘ = 30°. None of these activities were covered in the previous article (Koseki, 2021), and they are not listed on SonotaCo net J14 list. GMN treats ZCY as a single meteor shower.
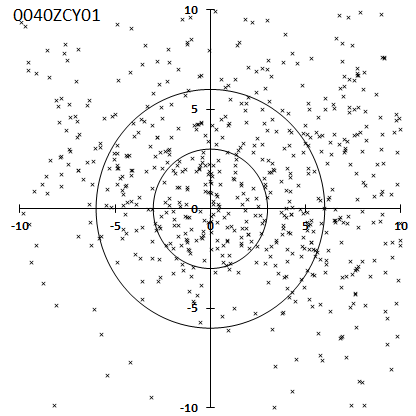
Figure 3 – Radiant point distribution map for the zeta-Cygnids.
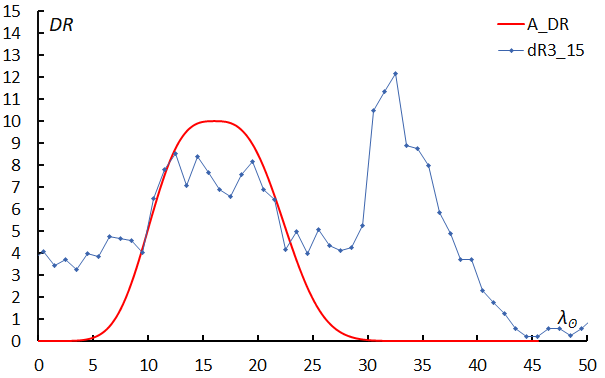
Figure 4 – Activity profile for the zeta-Cygnids.
0841DHE: delta-Herculids
λʘ = 19.6°, λ–λʘ = 231.9°, β = 46.5°, α = 256.2°, δ = 23.9°, vg = 49.3 km/s.
DHE was covered in the second report of CAMS (Jenniskens, et al., 2018b). DHE is an activity that was not covered in the previous article (Koseki, 2021) and is not listed on SonotaCo net J14 list. As seen in the activity profile, the period of activity is short and is one of the meteor showers in which the number of meteors observed by GMN is small. It will be difficult to detect unless it reaches a maximum.
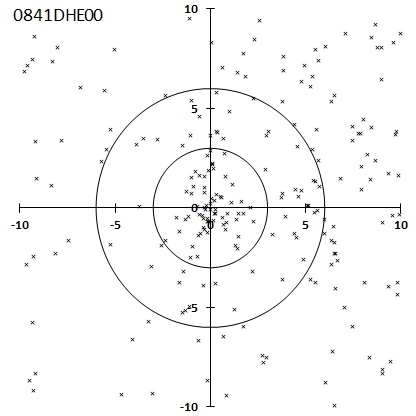
Figure 5 – Radiant point distribution map for the delta-Herculids.
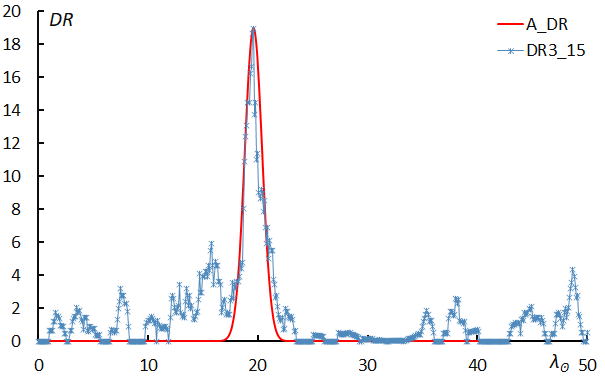
Figure 6 – Activity profile for the delta-Herculids.
0450AED: April epsilon-Delphinids
λʘ = 20°, λ–λʘ = 293.1°, β = 30.1°, α = 307.2°, δ = 12.0°, vg = 60.6 km/s.
This meteor shower was detected by combining SonotaCo net and CAMS data (Rudawska and Jenniskens, 2014). This group was covered in the previous article (Koseki, 2021) and is also listed on SonotaCo Net’s J14 list and GMN. Although not many meteors appear, as the radiant point distribution map shows, they stand out from the surroundings, and the activity curve is clear.
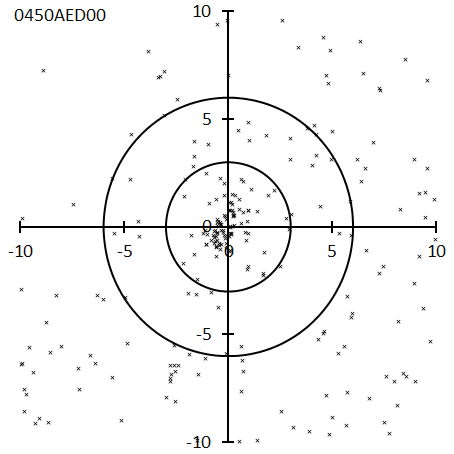
Figure 7 – Radiant point distribution map for the April epsilon-Delphinids.
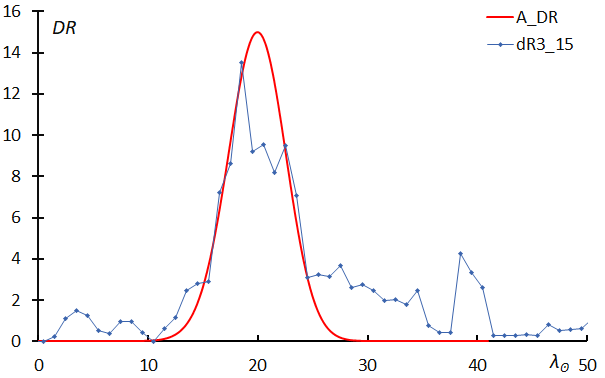
Figure 8 – Activity profile for the April epsilon-Delphinids.
0839PSR: phi-Serpentids
λʘ = 24.7°, λ–λʘ = 211.4°, β = 34.7°, α = 241.7°, δ = 14.6°, vg = 45.1 km/s.
KSE03, which was discussed in the previous article (Koseki, 2021), has been deleted in the current IAUMDCSD. The relationship between KSE and PSR is described in detail in Part II, “Meteor showers that need careful attention” (Koseki, 2024b), so please refer to that for information on KSE03.
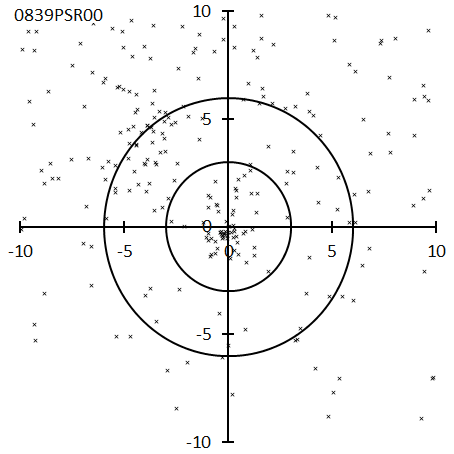
Figure 9 – Radiant point distribution map for the phi-Serpentids.
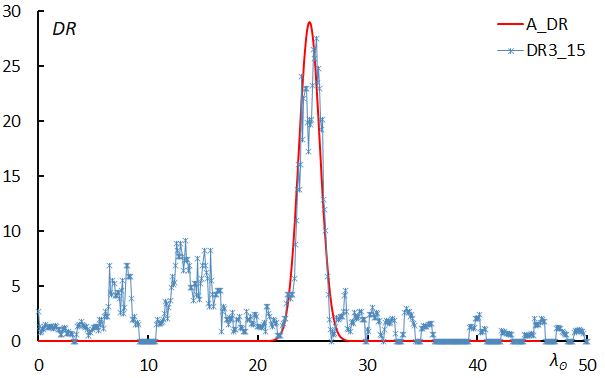
Figure 10 – Activity profile for the phi-Serpentids.
0021AVB: alpha-Virginids
λʘ = 25°, λ–λʘ = 171.4°, β = 11.7°, α = 199.6°, δ = 4.4°, vg = 19.7 km/s.
It is a different meteor shower activity than 0021AVB00, 0021AVB01, and 0021AVB02, which gave rise to the name AVB, and consists of 0021AVB03, 0021AVB04, 0021AVB06, and 0136SLE02 (Koseki, 2019).
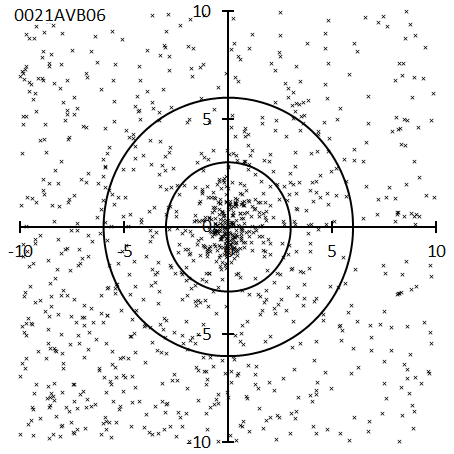
Figure 11 – Radiant point distribution map for the alpha-Virginids.
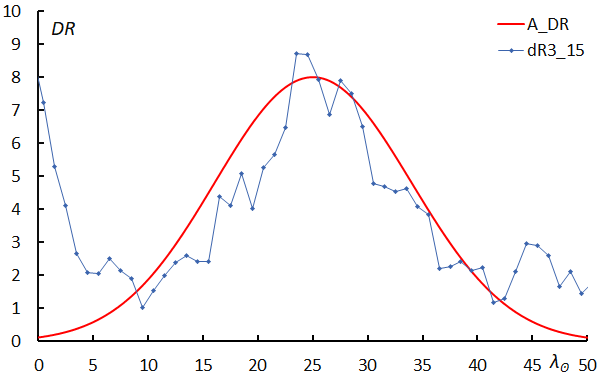
Figure 12 – Activity profile for the alpha-Virginids.
0040ZCY_1: zeta-Cygnids
λʘ = 31.5°, λ–λʘ = 299.1°, β = 58.1°, α = 308.6°, δ = 42.5°, vg = 41.8 km/s.
ZCY and ARC are described in detail in Part II, “Meteor showers that need careful attention” (Koseki, 2024b). This ZCY_1 activity shows a very clear maximum at λʘ = 31.5°. The graph below the activity profile shown in the second row was compiled by GMN. The activity period of ZCY is λʘ = 1.6~33.9°, and the activity near the maximum estimated in this paper is active.
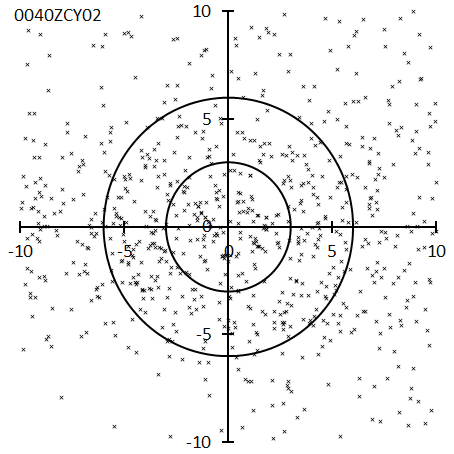
Figure 13 – Radiant point distribution map for the zeta-Cygnids.
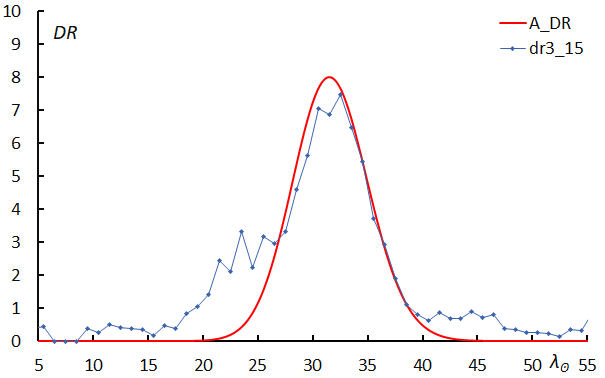
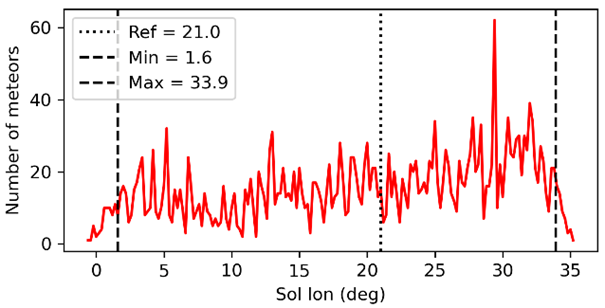
Figure 14 – Activity profile for the zeta-Cygnids (top), determed by GMN (bottom).
0006LYR: April Lyrids
λʘ = 32.3°, λ–λʘ = 240.8°, β = 56.7°, α = 272.1°, δ = 33.3°, vg = 46.6 km/s.
The period of LYR’s activity was once thought to be quite long, but the SonotaCo net sets it as λʘ = 27.60~35.86°, and GMN also sets it as λʘ = 30~34°, which is quite short. A structure resembling the base of a spire can be seen in the activity curve, and this is also common to the previous results obtained from SonotaCo net data.
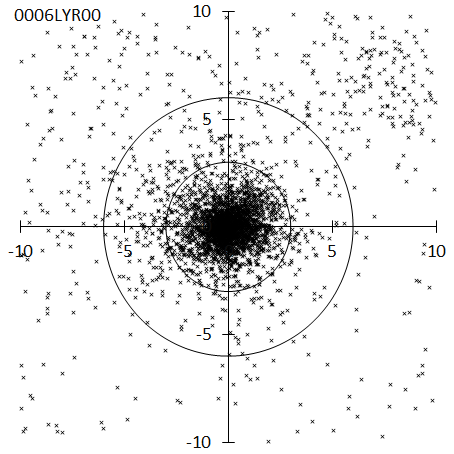
Figure 15 – Radiant point distribution map for the April Lyrids.
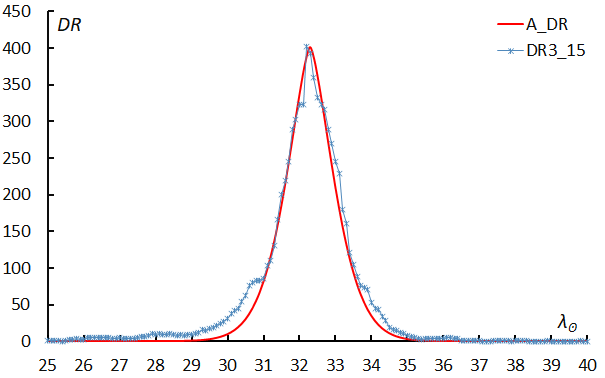
Figure 16 – Activity profile for the April Lyrids.
0343HVI: h-Virginids
λʘ = 39°, λ–λʘ = 166.2°, β = –1.3°, α = 202.9°, δ = –11.0°, vg = 18.4 km/s.
0343HVI01 is quite different from the other HVI in both, the position of the radiant point and the solar longitude and cannot be recognized as an observation of HVI. HVI’s activity changes significantly from year to year, so observations by GMN are mostly limited to 2020.
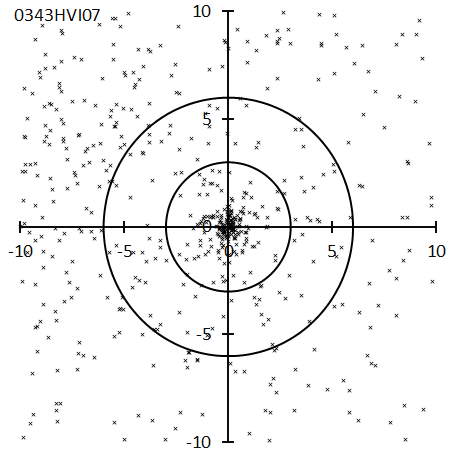
Figure 17 – Radiant point distribution map for the h-Virginids.
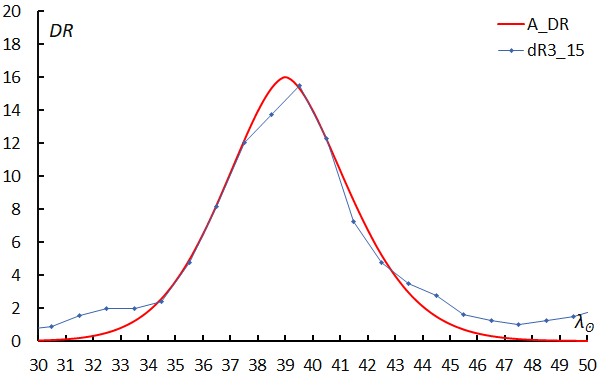
Figure 18 – Activity profile for the h-Virginids.
0348ARC: April rho-Cygnids
λʘ = 39.5°, λ–λʘ = 312.7°, β = 56.5°, α = 323.8°, δ = 47.3°, vg = 41.3 km/s.
ARC is adjacent to the active area of ZCY, and the activity around λʘ = 30° is presumed to be due to the contamination of ZCY. For the relationship between ARC and ZCY, please refer to Part II, “Meteor showers that need careful attention” (Koseki, 2024b). Although the activity profile is not clear, the radiant shift is clear. This meteor shower was not covered in the previous article (Koseki, 2021) and is not even on the J14 list on SonotaCo net.
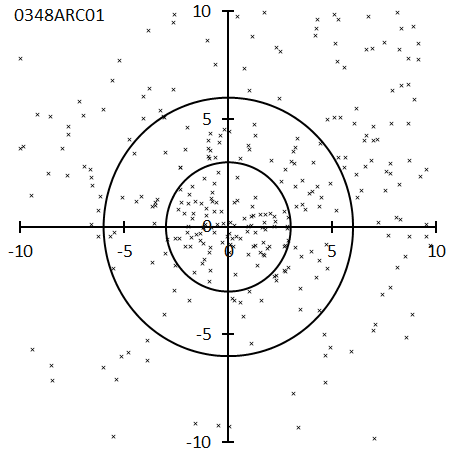
Figure 19 – Radiant point distribution map for the April rho-Cygnids.
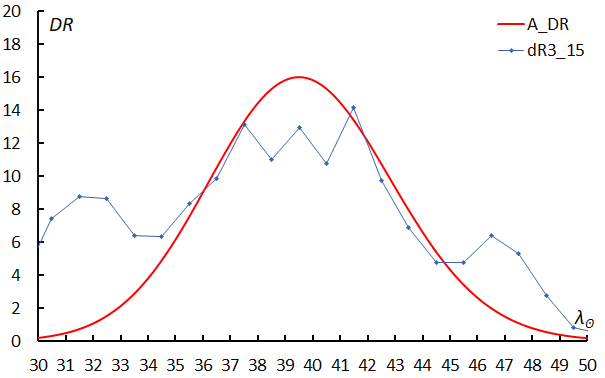
Figure 20 – Activity profile for the April rho-Cygnids.
0519BAQ: beta-Aquariids
λʘ = 44°, λ–λʘ = 279.3°, β = 13.3°, α = 321.3°, δ = –1.2°, vg = 68.3 km/s.
This activity was detected by combining observations from Croatia and SonotaCo net (Andreić et al., 2013). Although the radiant points are well concentrated, they are few, so they are on the GMN list but not on the SonotaCo net J14 list. This meteor shower was not covered in the previous article (Koseki, 2021).
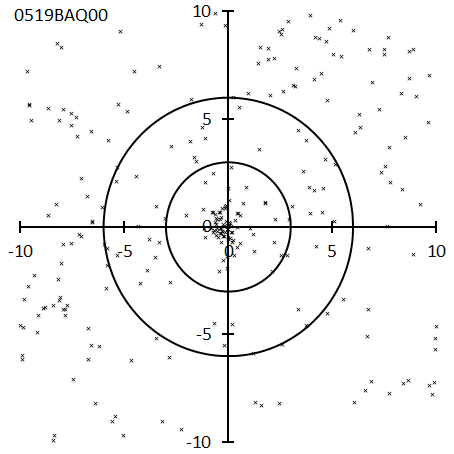
Figure 21 – Radiant point distribution map for the beta-Aquariids.
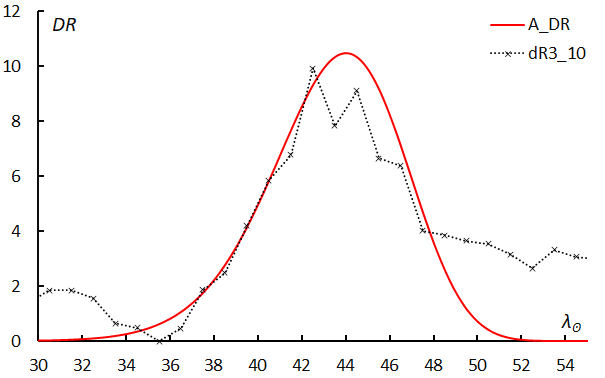
Figure 22 – Activity profile for the beta-Aquariids.
0031ETA: eta-Aquariids
λʘ = 44.3°, λ–λʘ = 294.0°, β = 7.6°, α = 337.1°, δ = –1.4°, vg = 65.4 km/s.
The radiant points are well concentrated. The activity curve is not symmetrical, and the activity period after the maximum is long. The activity after the maximum is up to λʘ = 65.48° in the J14 list of SonotaCo net, and λʘ = 66° in GMN. However, in GMN’s meteor list, there are meteors that are classified to be ETA even if they are λʘ = 95°. For more details, as mentioned in Part II, “Meteor showers that need careful attention” (Koseki, 2024b), this may be meteor activity linked to the PPS.
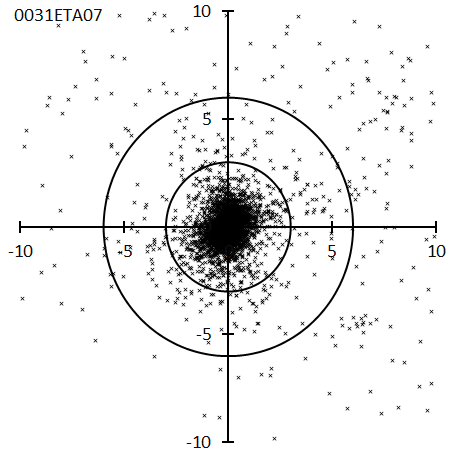
Figure 23 – Radiant point distribution map for the eta-Aquariids.
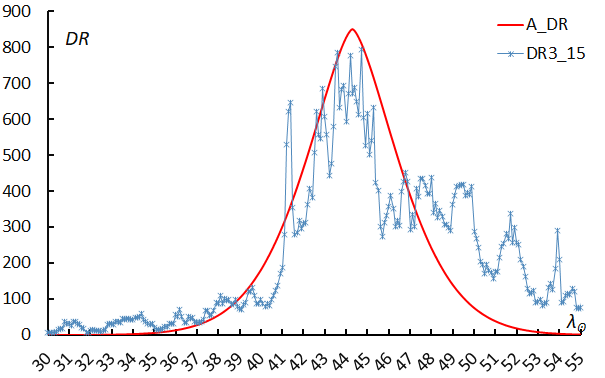
Figure 24 – Activity profile for the eta-Aquariids.
0531GAQ: gamma-Aquilids
λʘ = 48°, λ–λʘ = 262.5°, β = 33.3°, α = 304.1°, δ = 14.5°, vg = 62.0 km/s.
This was discovered during a search for the parent object by combining observations from Croatia and the SonotaCo network (Šegon et al., 2014), and it has been pointed out that it may be related to C/1853G1 (Schweizer). The activity period is set as λʘ = 44.6~65° in GMN, but in the J14 list of SonotaCo net, it is shorter as λʘ = 51.04~52.44°, and moreover, it is in the latter period of the activity profile in Figure 26. This meteor shower was not covered in the previous article (Koseki, 2021).
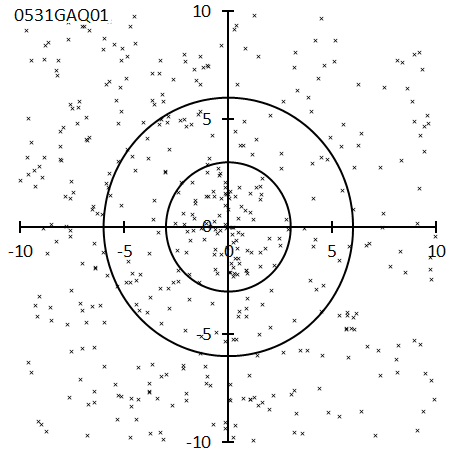
Figure 25 – Radiant point distribution map for the gamma-Aquilids.
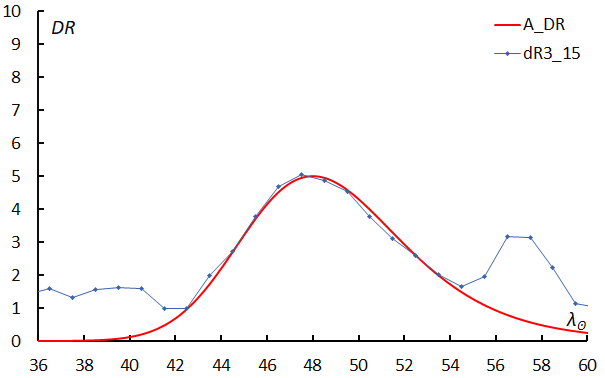
Figure 26 – Activity profile for the gamma-Aquilids.
0854PCY: psi-Cygnids
λʘ = 49.5°, λ–λʘ = 278.1°, β = 71.5°, α = 296.6°, δ = 53.4°, vg = 39.4 km/s.
This meteor shower appears in the second report of CAMS (Jenniskens, et al., 2018b), but there are no other reports in IAUMDCSD. The activity at the bottom right of the radiant distribution is 0145ELY, which is only about 10 degrees away. The radiant point is somewhat diffused and the maximum is unclear. This meteor shower is not listed in the SonotaCo net J14 list and was not featured in the previous article (Koseki, 2021).
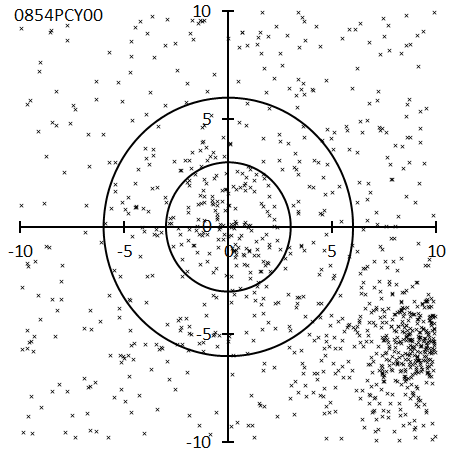
Figure 27 – Radiant point distribution map for the psi-Cygnids.
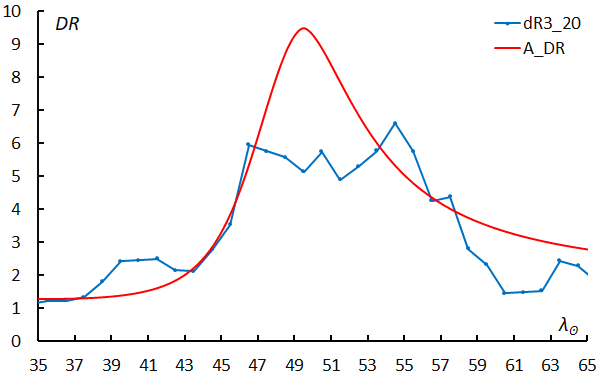
Figure 28 – Activity profile for the psi-Cygnids.
0145ELY: eta-Lyrids
λʘ = 50.2°, λ–λʘ = 256.3°, β = 64.5°, α = 290.7°, δ = 43.7°, vg = 44.0 km/s.
Although the current IAUMDCSD version mentions the SonotaCo net for the first time, the shower’s existence has been known since shortly after C/1983 H1 (IRAS-Araki-Alcock) appeared. The author also presented it as a meteor shower related to this comet at the 1985 Japanese Meteor Conference (Koseki, 1985). Now SonotaCo’s report is considered the first report on 0145ELY00, but formerly this was Jenniskens’ 2006 book mentioned in the IAUMDCSD. Even if the IAUMDCSD is revised, it may be necessary to save and verify previous versions.
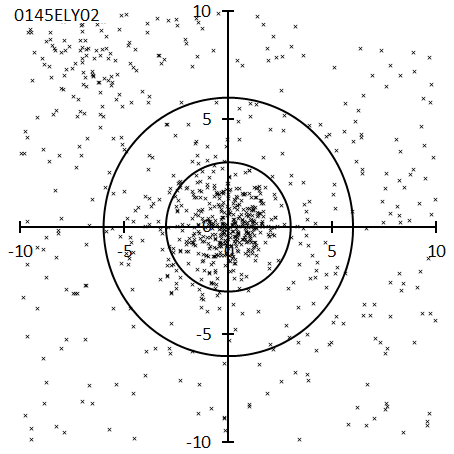
Figure 29 – Radiant point distribution map for the eta-Lyrids.
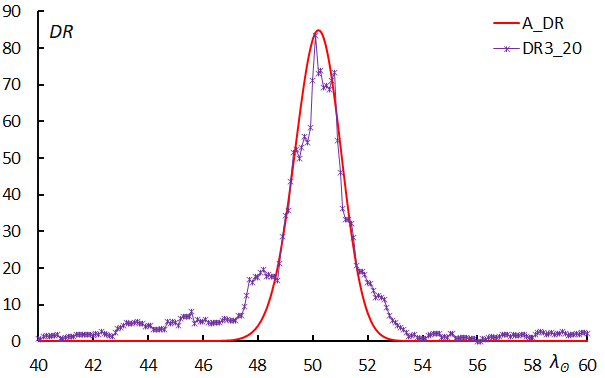
Figure 30 – Activity profile for the eta-Lyrids.
0520MBC: May beta-Capricornids
λʘ = 55°, λ–λʘ = 245.8°, β = 4.8°, α = 302.0°, δ = –15.3°, vg = 65.7 km/s.
This is also a meteor shower detected by combining observations from Croatia and SonotaCo Net (Andreić et al., 2013), but SonotaCo Net’s J14 list only recognizes activity near the maximum of λʘ = 53.72~54.38°. This meteor shower was not discussed in the previous article (Koseki, 2021), but although the number of meteors observed is small, the radiant point plot and the activity curve are distinct.
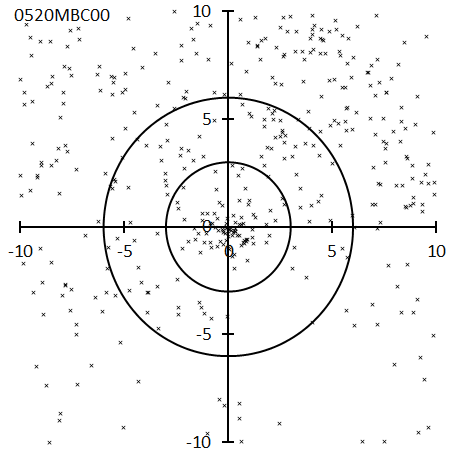
Figure 31 – Radiant point distribution map for the May beta-Capricornids.
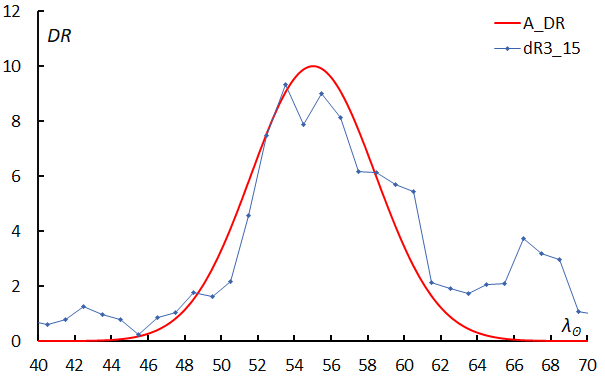
Figure 32 – Activity profile for the May beta-Capricornids.
0061TAH: tau-Herculids
λʘ = 69.45°, λ–λʘ = 125.3°, β = 36.9°, α = 208.9°, δ = 28.0°, vg = 11.4 km/s.
The data shown here is for the outburst in 2022. No meteors falling within 3 degrees of the radiant distribution map were observed from 2019 to 2021 in GMN observations. For more information, please refer to Part II, “Meteor showers that need careful attention” (Koseki, 2024b). This meteor shower was not mentioned in the previous article (Koseki, 2021) and is not on the SonotaCo net J14 list. GMN lists the observed values for 2022 as TAH, not the IAUMDCSD’s data on TAH.
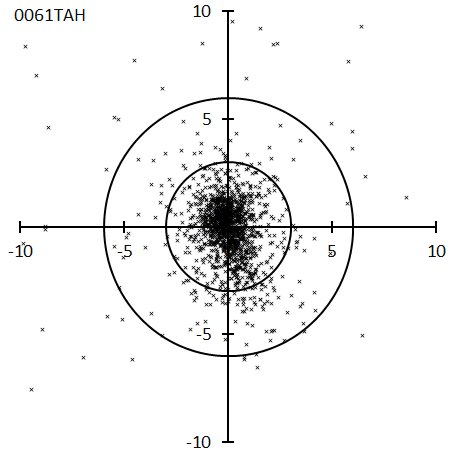
Figure 33 – Radiant point distribution map for the tau-Herculids.
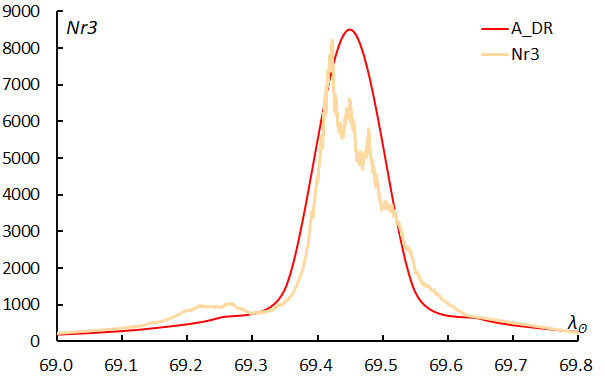
Figure 34 – Activity profile for the tau-Herculids.
0860PAN: psi-Andromedids
λʘ = 72°, λ–λʘ = 307.1°, β = 43.6°, α = 355.3°, δ = 46.6°, vg = 50.4 km/s.
This was first detected in the second CAMS observation report (Jenniskens et al, 2018b), and there are no other reports in the IAUMDCSD yet. Although the maximum is short and the number of meteors observed is small, the radiant points are well clustered. This was not mentioned in the previous article (Koseki, 2021).
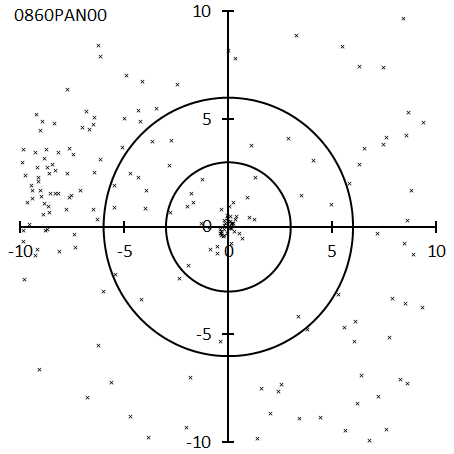
Figure 35 – Radiant point distribution map for the psi-Andromedids.
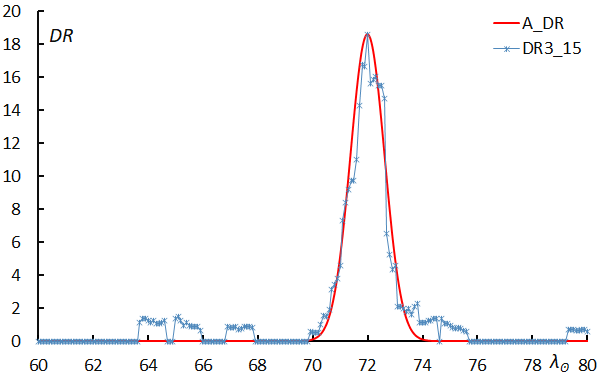
Figure 36 – Activity profile for the psi-Andromedids.
0362JMC: June mu-Cassiopeiids
λʘ = 72°, λ–λʘ = 323.5°, β = 43.6°, α = 10.7°, δ = 53.2°, vg = 42.7 km/s.
This meteor shower was first detected by CMOR2 radar observations (Brown et al., 2010), but there have also been multiple reports from video observations. The radiant points are diffuse, and the activity profile is not clear. It was not mentioned in the previous article (Koseki, 2021) and this shower is not on the SonotaCo net J14 list.
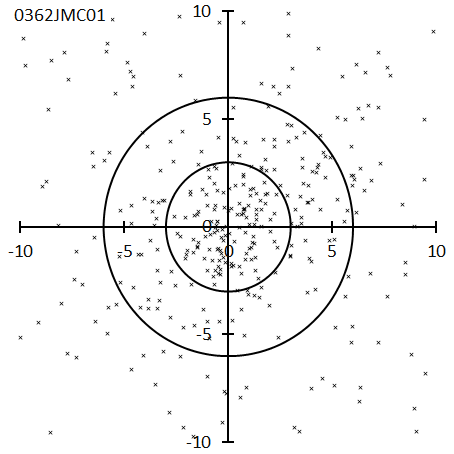
Figure 37 – Radiant point distribution map for the June mu-Cassiopeiids.
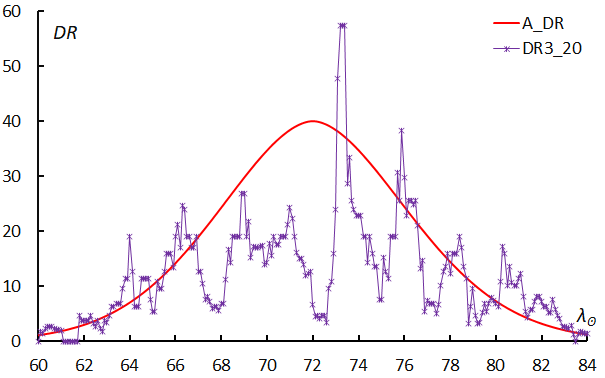
Figure 38 – Activity profile for the June mu-Cassiopeiids.
0171ARI: Daytime Arietids
λʘ = 79.5°, λ–λʘ = 330.6°, β = 7.8°, α = 45.3°, δ = 25.2°, vg = 40.8 km/s.
Although Sekanina’s radio observations are the first reports in the IAUMDCSD (Sekanina, 1976), ARI has been known since the early days of radio observations, and Lovell’s radio observations are well known (Lovell, 1954). Because it is relatively far from the Sun, these meteors can be seen by visual observers in the Northern Hemisphere. However, even with video observations, the number of meteors obtained is not large, so the activity profile is not clear.
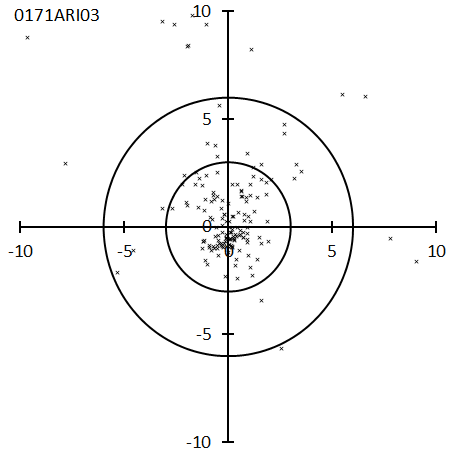
Figure 39 – Radiant point distribution map for the Daytime Arietids.
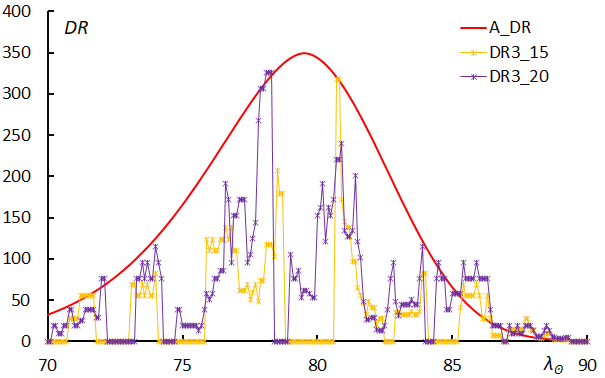
Figure 40 – Activity profile for the Daytime Arietids.
0458JEC: June epsilon-Cygnids
λʘ = 82.6°, λ–λʘ = 249.2°, β = 47.9°, α = 315.3°, δ = 33.7°, vg = 52.7 km/s.
This meteor shower was detected by combining SonotaCo net and CAMS data (Rudawska and Jenniskens, 2014). Both the radiant point and the activity curve are clear. Because the width of the maximum is narrow, the number of meteors obtained tends to vary from year to year.
Figure 41 – Radiant point distribution map for the June epsilon-Cygnids.
Figure 42 – Activity profile for the June epsilon-Cygnids.
0510JRC: June rho-Cygnids
λʘ = 84°, λ–λʘ = 262.2°, β = 55.4°, α = 320.7°, δ = 44.5°, vg = 49.7 km/s.
This meteor shower was detected by combining observations from Croatia and SonotaCo net (Šegon et al., 2013). 0458JEC is visible at the bottom right of the radiant point distribution. The activity period of this meteor shower is short, so it was not discussed in the previous article (Koseki, 2021).
Figure 43 – Radiant point distribution map for the June rho-Cygnids.
Figure 44 – Activity profile for the June rho-Cygnids.
0069SSG: Southern mu-Sagittariids
λʘ = 87°, λ–λʘ = 186.7°, β = –6.5°, α = 274.2°, δ = –29.9°, vg = 25.2 km/s.
The region between Scorpius and Sagittarius is known to be the active area of the ecliptical meteor showers based on visual observations, and various meteor showers have been proposed based on photographic observations also. The upper half of the radiant distribution map is the ANT region. Among them, SSG can be clearly distinguished from ANT activity by its radiant distribution and activity curve. 0069SSG00 is an activity determined from photographic meteors brighter than magnitude –3 (Porubcan and Gavajdova, 1994), and in the radiant distribution in
Figure 45, it is located at the upper right, slightly outside the circle with a radius of 3 degrees from the center, and is close to ANT. SSG was not mentioned in the previous article (Koseki, 2021) and is not listed on the SonotaCo net J14 list.
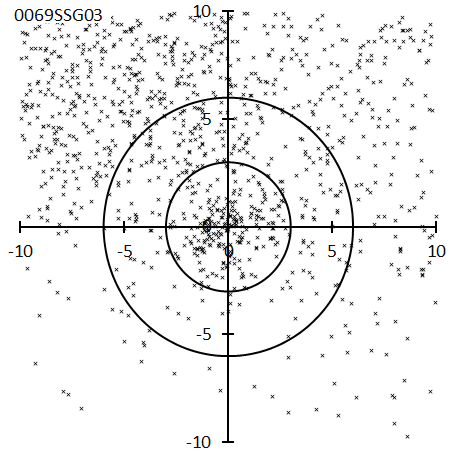
Figure 45 – Radiant point distribution map for the Southern mu-Sagittariids.
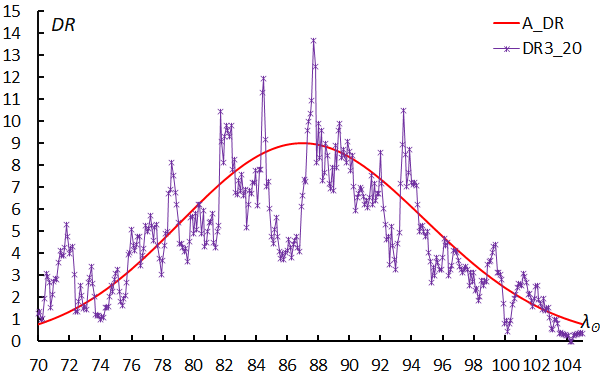
Figure 46 – Activity profile for the Southern mu-Sagittariids.
0170JBO: June Bootids
λʘ = 90.3°, λ–λʘ = 101.2°, β = 59.4°, α = 221.1°, δ = 48.5°, vg = 14.0 km/s.
It is well known as the meteor shower related to 7P/Pons-Winnecke, but in normal years it is almost hidden by sporadic meteor activity and cannot be detected. If GMN had not observed it in 2022, it would have been unconfirmed here as well. Prior to that, the only reliable orbit was one taken by the European Fireball Network in 1998 (Spurný, 1999); radar observation of 0170JBO00 is unreliable. Since then, observations every six years, in 2010, 2016 and 2022, have caught weak activities of JBO (Roggemans et al., 2023). JBO is not on the SonotaCo net J14 list and was not mentioned in the previous article (Koseki, 2021).
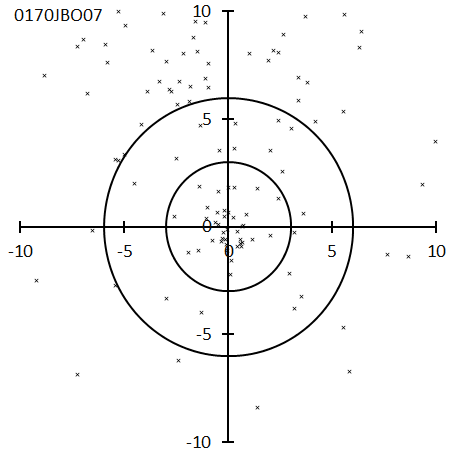
Figure 47 – Radiant point distribution map for the June Bootids.
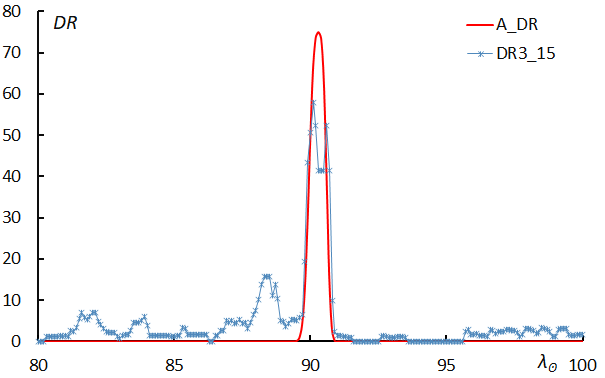
Figure 48 – Activity profile for the June Bootids.
0410DPI: delta-Piscids
λʘ = 91.2°, λ–λʘ = 280.4°, β = 1.0°, α = 10.2°, δ = 5.5°, vg = 69.8 km/s.
This meteor shower was detected by IMO’s video net (Molau and Rendtel, 2009). Although the number of meteors observed by GMN is small, the radiant distribution and activity curve are clear. DPI is not on the SonotaCo net J14 list and was not mentioned in the previous article (Koseki, 2021).
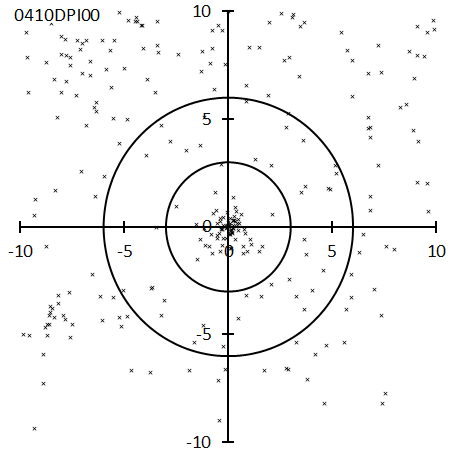
Figure 49 – Radiant point distribution map for the delta-Piscids.
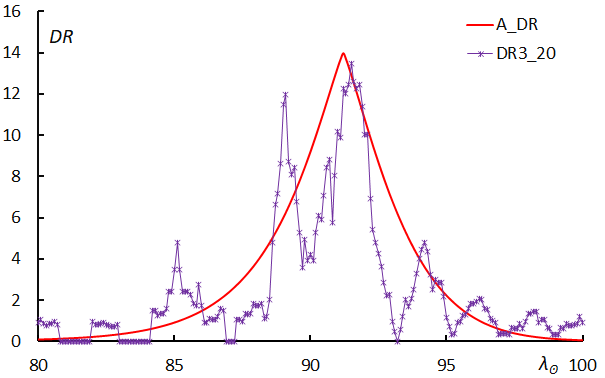
Figure 50 – Activity profile for the delta-Piscids.
0459JEO: June epsilon-Ophiuchids
λʘ = 92°, λ–λʘ = 152.7°, β = 13.1°, α = 245.1°, δ = –8.2°, vg = 13.7 km/s.
This meteor shower was detected by combining SonotaCo net and CAMS data (Rudawska and Jenniskens, 2014). However, this 0459JEO00 is located in the upper left outside the circle with a radius of 6 degrees in the radiant point distribution map, and the maximum solar longitude of λʘ = 84.1° is also difficult to call a representative value when considering the activity curve. JEO was not mentioned in the previous paper (Koseki, 2021).
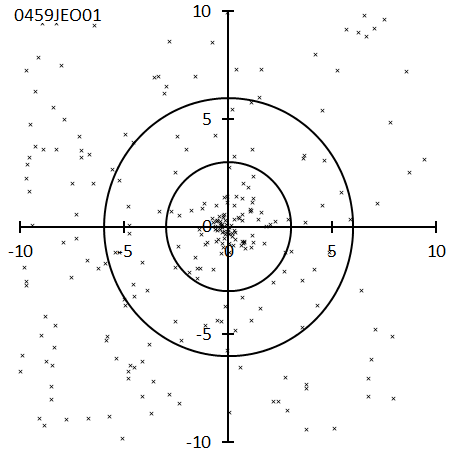
Figure 51 – Radiant point distribution map for the June epsilon-Ophiuchids.
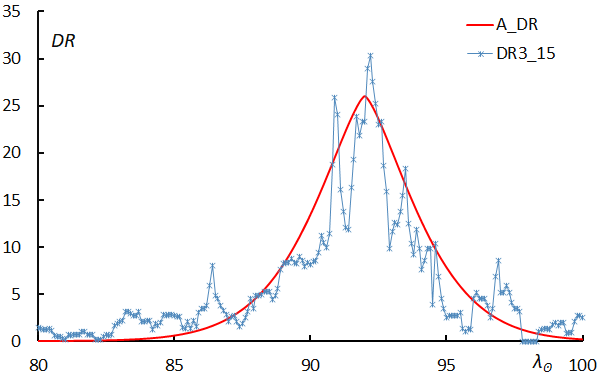
Figure 52 – Activity profile for the June epsilon-Ophiuchids.
0431JIP: June iota-Pegasids
λʘ = 94.1°, λ–λʘ = 252.4°, β = 37.8°, α = 331.7°, δ = 29.3°, vg = 58.5 km/s.
This is one of four meteor activities identified by Greaves (2012) in the UK using SonotaCo net data. The radiant points are well concentrated, and the activity curve is sharp and clear.
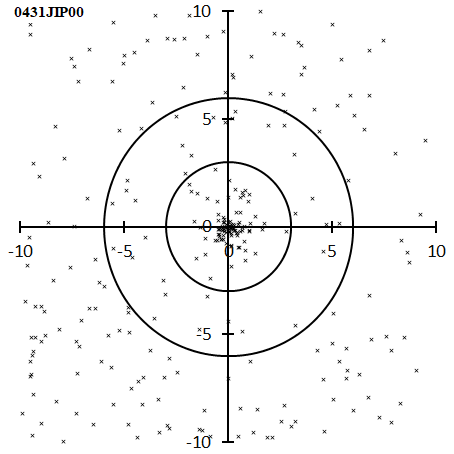
Figure 53 – Radiant point distribution map for the June iota-Pegasids.
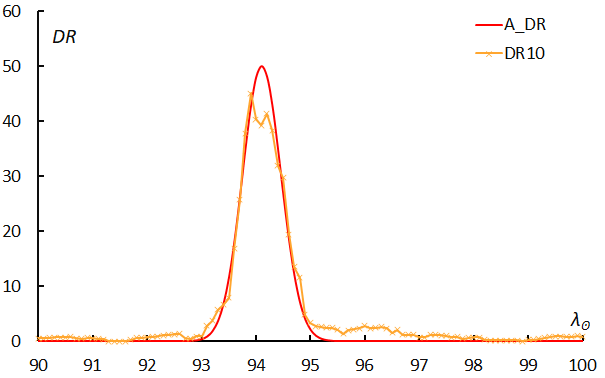
Figure 54 – Activity profile for the June iota-Pegasids.
0867FPE: 52-Pegasids
λʘ = 95.8°, λ–λʘ = 254.9°, β = 15.9°, α = 345.2°, δ = 11.0°, vg = 66.7 km/s.
This meteor shower appeared in the second CAMS report (Jenniskens et al., 2018b). Although the number of meteors obtained by GMN is small, the radiant points are well-grouped, and the activity profile is clear. FPE is not on the SonotaCo net J14 list and was not mentioned in the previous article (Koseki, 2021).
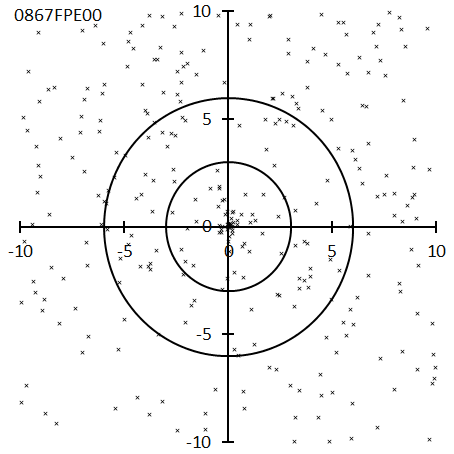
Figure 55 – Radiant point distribution map for the 52-Pegasids.
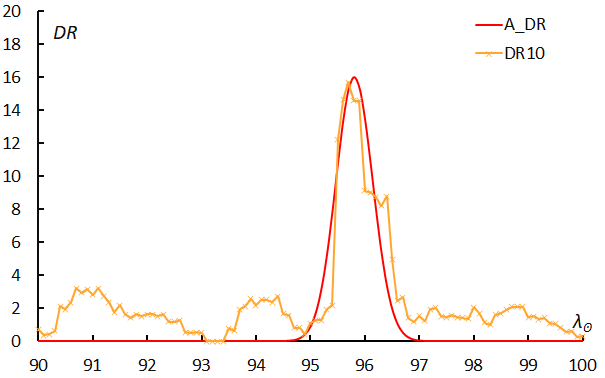
Figure 56 – Activity profile for the 52-Pegasids.
0372PPS_0: phi-Piscids
λʘ = 98.5°, λ–λʘ = 282.9°, β = 16.1°, α = 13.3°, δ = 23.2°, vg = 66.3 km/s.
This meteor shower was detected by radar observation by CMOR2 (Brown et al., 2010). Meteor activity around PPS is complicated, so we refer for the details to Part II, “Meteor showers that need careful attention” (Koseki, 2024b). The SonotaCo net J14 list states that the active period is λʘ = 91.68~98.20°, but GMN sets it as λʘ = 89~132.7° and actually extends further to both sides. The J14 list only deals with the pre-maximum period of PPS activity, and GMN seems to be taking the late activity period too long.
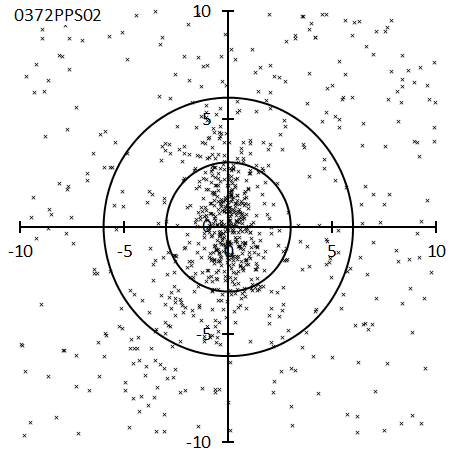
Figure 57 – Radiant point distribution map for the phi-Piscids.
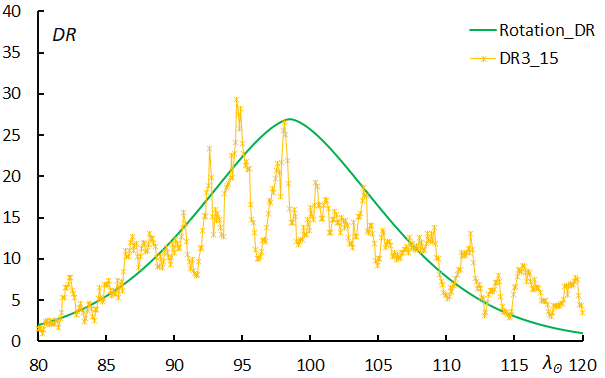
Figure 58 – Activity profile for the phi-Piscids.
0164NZC: Northern June Aquilids
λʘ = 101°, λ–λʘ = 209.5°, β = 12.4°, α = 309.6°, δ = –5.6°, vg = 38.9 km/s.
0164NZC00 is a radar observation by Sekanina (1976), and NZC01 is also a radar observation by CMOR1 (Brown et al., 2008). The radiant points are scattered as seen in the distribution map, and are located in a continuous area of meteor activity from the upper left to the lower right. It is necessary to note that the SonotaCo net J14 list uses the abbreviation AQI of 1111AQI, which they proposed to the IAUMDCSD for NZC. Regarding the activity period, in J14, λʘ = 92.55~96.10°, which is a short period before the maximum of the activity curve in Figure 60, whereas in GMN, on the other hand, λʘ = 80.8~148.2°. The GMN period is suspected to be influenced by the meteor activity area mentioned above.
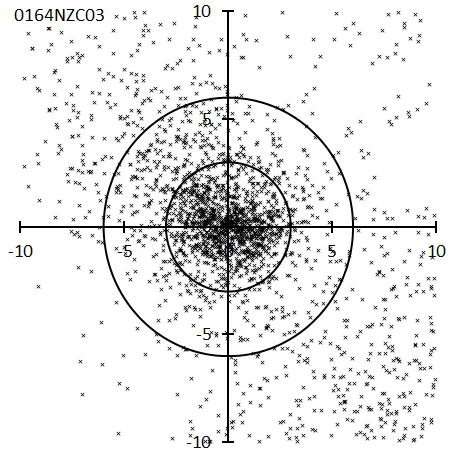
Figure 59 – Radiant point distribution map for the Northern June Aquilids.
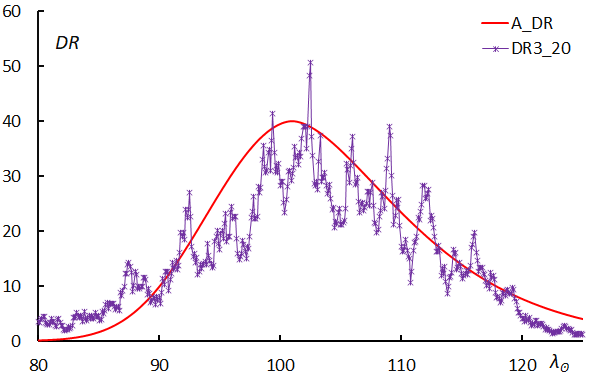
Figure 60 – Activity profile for the Northern June Aquilids.
0370MIC: Microscopiids
λʘ = 101.3°, λ–λʘ = 208.8°, β = –10.3°, α = 315.7°, δ = –27.6°, vg = 40.0 km/s.
As pointed out in the previous article (Koseki, 2021) and mentioned in Part II, “Meteor showers that need careful attention” (Koseki, 2024b), the IAUMDC’s SZC includes two different meteor showers. SZC00 and SZC01 should be called SZC, but both are radio observations and are hardly captured by video observations. SZC02 and SZC04 are video observations that should be considered as MIC. The meteor shower, which was referred to as “SZC” due to the confusion, will now be referred to by its original name, MIC. In the previous article (Koseki, 2021), it was called SZC, but it has been changed to MIC.
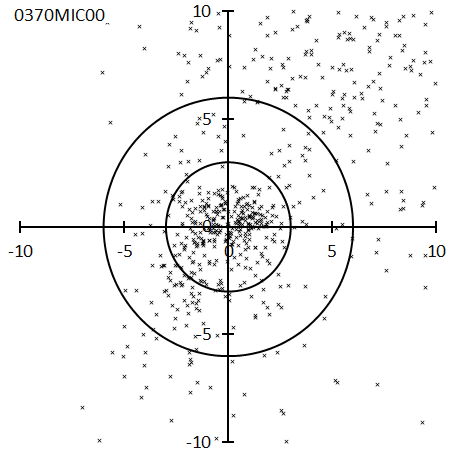
Figure 61 – Radiant point distribution map for the Microscopiids.
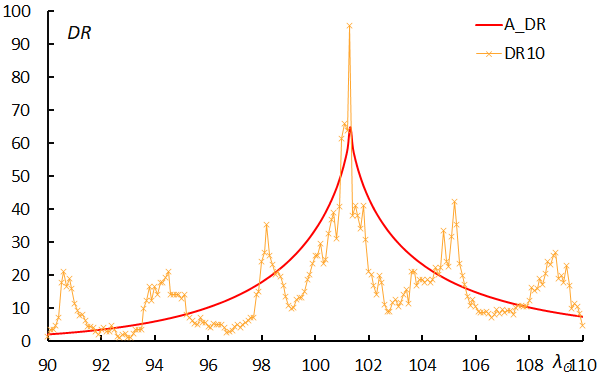
Figure 62 – Activity profile for the Microscopiids.
1133TCS: 32-Cassiopeiids
λʘ = 104.6°, λ–λʘ = 303.6°, β = 52.7°, α = 13.7°, δ = 65.4°, vg = 46.3 km/s.
This shower appears in the IAUMDCSD with the third report of CAMS (mentioned as ‘2022 submitted’ in the IAUMDCSD). Although it is close to 0187PCA00 and PCA02, it is TCS that is active. The SonotaCo net J14 list has neither, but it is listed as PCA on GMN. PCA00 has λʘ = 114.40°, and PCA02 has λʘ = 119°, but as seen in the activity profile in Figure 64, TCS activity has ceased at that time. This activity was not discussed in the previous paper as either PCA or TCS (Koseki, 2021).
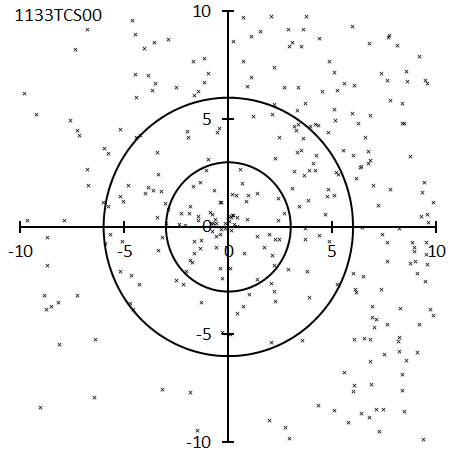
Figure 63 – Radiant point distribution map for the 32-Cassiopeiids.
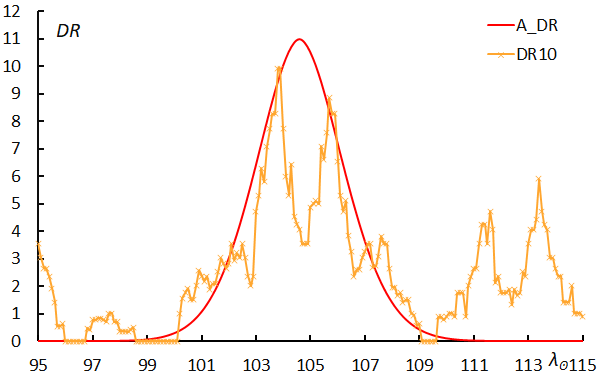
Figure 64 – Activity profile for the 32-Cassiopeiids.
0411CAN: c-Andromedids
λʘ = 105°, λ–λʘ = 298.1°, β = 32.8°, α = 27.0°, δ = 46.5°, vg = 57.1 km/s.
This meteor shower was detected by IMO’s video network (Molau and Rendtel, 2009). The SonotaCo net J14 list gives the activity period as λʘ = 108.62~113.18°, which corresponds to the latter half of the activity profile in Figure 66. This activity profile is not the raw number of meteors observed but is corrected based on the number of meteors observed in the surrounding area. If the number of meteors is used to express activity, the activity will look different depending on the observation conditions; The weather during the first half of CAN’s activities was bad in Japan.
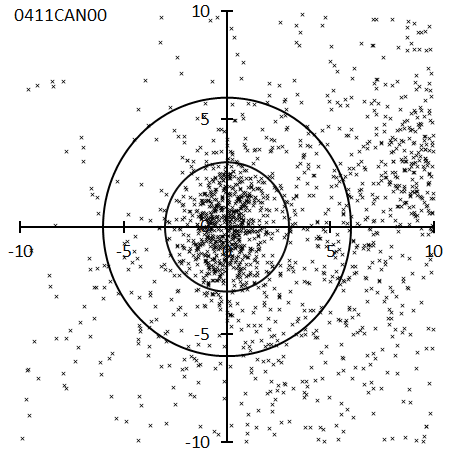
Figure 65 – Radiant point distribution map for the c-Andromedids.
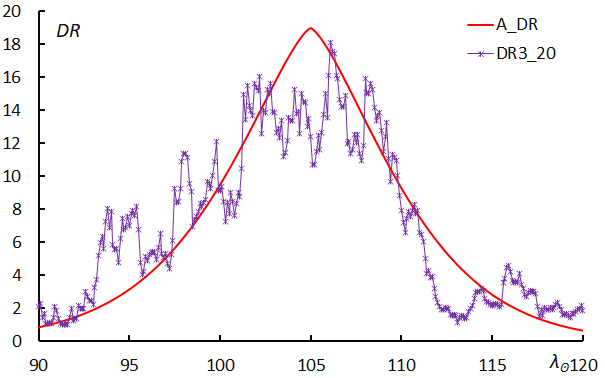
Figure 66 – Activity profile for the c-Andromedids.
0175JPE: July Pegasids
λʘ = 109.6°, λ–λʘ = 244.6°, β = 14.6°, α = 348.8°, δ = 11.1°, vg = 63.8 km/s.
According to Kronk (2013), JPE began to attract attention in 1987 when Olsson-Steel announced it as a predicted radiant point for C/1979 Y1 (Bradfield), C/1771 A1. Kronk’s book cites Ueda’s data as having clarified the orbit. Jennikens’ famous book used to be JPE00 (Jenniskens, 2006), but IAUMDCSD’s AdNo has been changed from the previous version. Currently, the IMO video observation by Molau and Rendtel (2009) is designated as JPE00, and the report by Jenniskens became JPE01. Although the current edition has added a publication date and time column, care must be taken when comparing AdNo with previous editions. 0507UAN00 is identified as JPE.
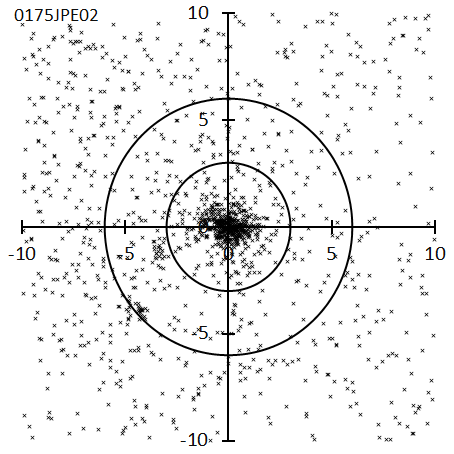
Figure 67 – Radiant point distribution map for the July Pegasids.
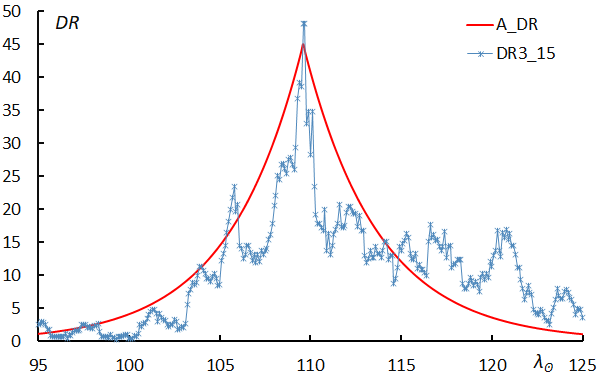
Figure 68 – Activity profile for the July Pegasids.
0444ZCS: zeta-Cassiopeiids
λʘ = 113.6°, λ–λʘ = 277.9°, β = 42.7°, α = 7.5°, δ = 50.8°, vg = 57.1 km/s.
The first report on IAUMDC’s record was made by observers in Poland and Croatia in 2012 (Zoladek and Wisniewski, 2012, Segon et al., 2012). However, visual observations have long shown that the activity of the Perseid progenitor begins around July 10 (Denning, 1899), and there has been some debate as to whether this is a separate shower activity. Polish observers used observations from the SonotaCo network to reach their conclusions, and advances in video observations led to the conclusions for the progenitor. In the activity profile (Figure 70), the increase after λʘ > 117° is due to the activity of the Perseids.
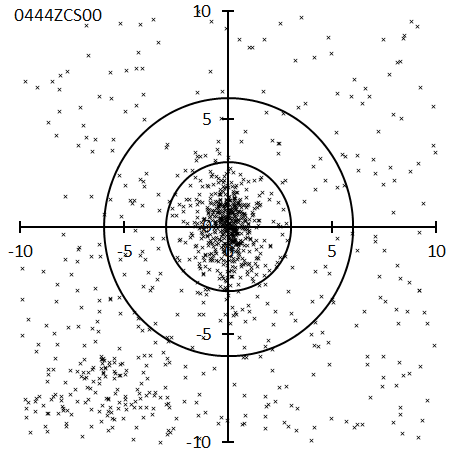
Figure 69 – Radiant point distribution map for the zeta-Cassiopeiids.
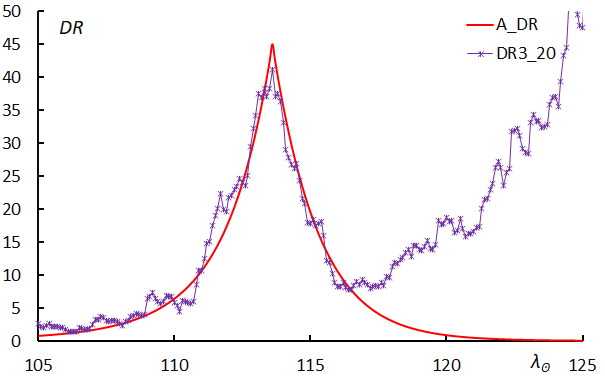
Figure 70 – Activity profile for the zeta-Cassiopeiids.
0533JXA: July xi-Arietids
λʘ = 115°, λ–λʘ = 283.2°, β = –5.5°, α = 37.7°, δ = 9.0°, vg = 68.8 km/s.
JXA was registered in IAUMDC in 2014 based on observations from Croatia and EDMOND, and observations from SonotaCo net are also utilized here (Šegon et al., 2014). In the SonotaCo net J14 list, a short period before the maximum is listed, λʘ = 104.67~107.29°, while GMN has a long period of λʘ = 94.1~123.8°. It seems to be a general trend that the GMN list is longer than the J14 list.
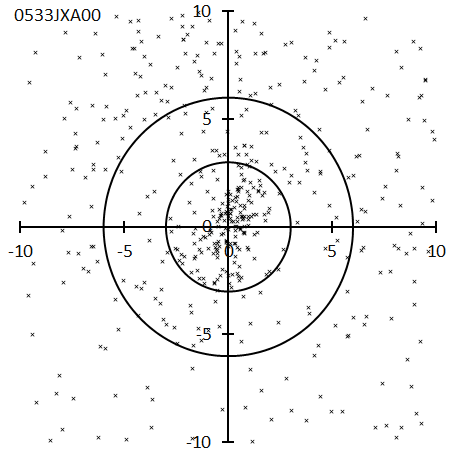
Figure 71 – Radiant point distribution map for the July xi-Arietids.
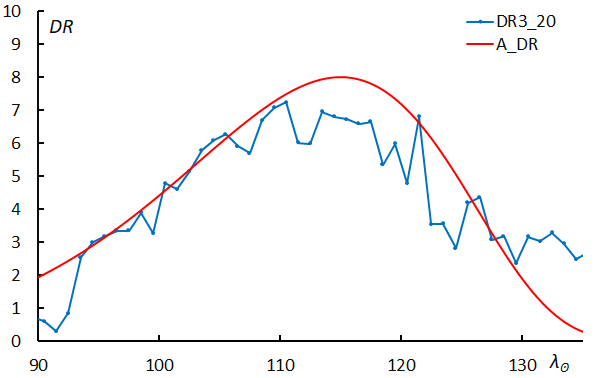
Figure 72 – Activity profile for the July xi-Arietids.
0623XCS: xi2-Capricornids
λʘ = 116.3°, λ–λʘ = 185.1°, β = 8.4°, α = 301.8°, δ = –11.7°, vg = 25.1 km/s.
This activity has only been published in the first report of CAMS in IAUMDCSD (Jenniskens et al., 2016a). The spread of radiant points extending to the right from the center in the radiant distribution in Figure 73 is 0001CAP, and XCS is only 3 to 5 degrees away from CAP. However, the author also pointed out that the geocentric velocity of XCS is slightly higher by about 2 km/s, and that it should be distinguished from CAP (Koseki, 2018). The SonotaCo net J14 list treats XCS as part of CAP, but GMN distinguishes it.
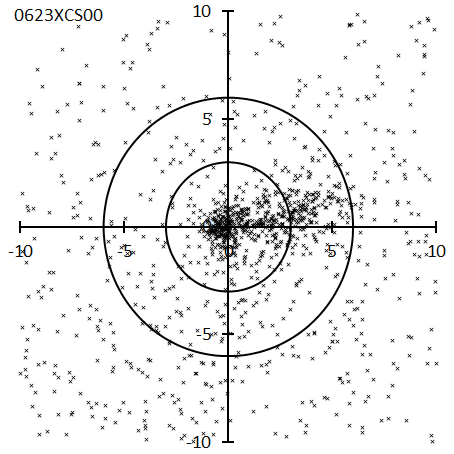
Figure 73 – Radiant point distribution map for the xi2-Capricornids.
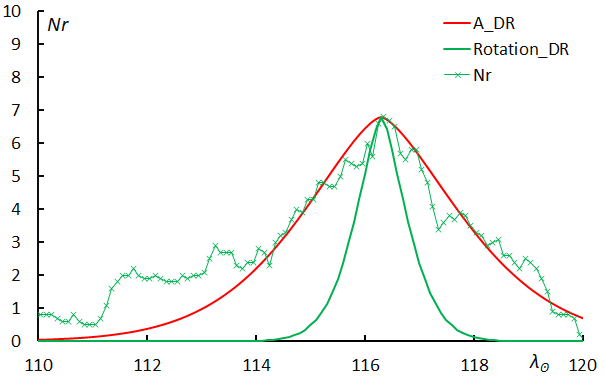
Figure 74 – Activity profile for the xi2-Capricornids.
0372PPS_1: phi-Piscids
λʘ = 117.5°, λ–λʘ = 280.5°, β = 17.7°, α = 29.1°, δ = 30.8°, vg = 66.1 km/s.
As in the previous paper (Koseki, 2021), PPS is divided into two activities. As mentioned in Part II, “Meteor showers that need careful attention” (Koseki, 2024b), it is estimated that the radiant movement paths of the previously mentioned PPS_0 and this PPS_1 intersect around λʘ = 115°. The radiant distribution in Figure 75 is for the period λʘ = 115~125°, and the upper left side of the 3-degrees circle corresponds to the terminal activity of PPS_0. PPS_0 moves to the upper right and PPS_1 moves to the lower right.
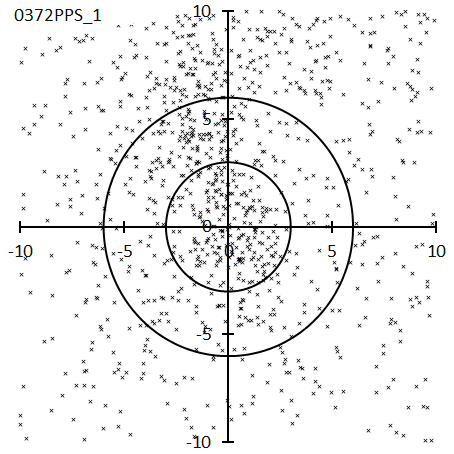
Figure 75 – Radiant point distribution map for the phi-Piscids.
Figure 76 – Activity profile for the phi-Piscids.
0184GDR: July gamma-Draconids
λʘ = 125.5°, λ–λʘ = 167.3°, β = 73.4°, α = 280.1°, δ = 50.7°, vg = 27.6 km/s.
0184GDR00, as reported by the SonotaCo net (SonotaCo, 2009), is a meteor shower that has been attracting attention since the era of photographic observation, beginning with Babadzhanov’s observations in the 1950s (Babadzhanov and Kramer, 1967). In the radiant distribution, the band of sparse radiant points extending from the upper left to the lower right is the early activity of 0012KCG, which was confused in visual observations. However, the geocentric velocity of GDR around λʘ = 125° is nearly 10 km/s faster than that of KCG, so it is possible to distinguish them by careful visual observation.
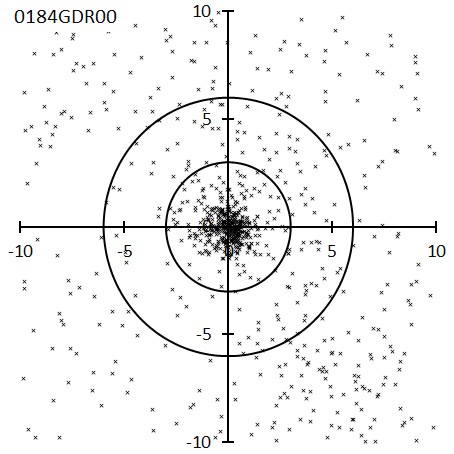
Figure 77 – Radiant point distribution map for the July gamma-Draconids.
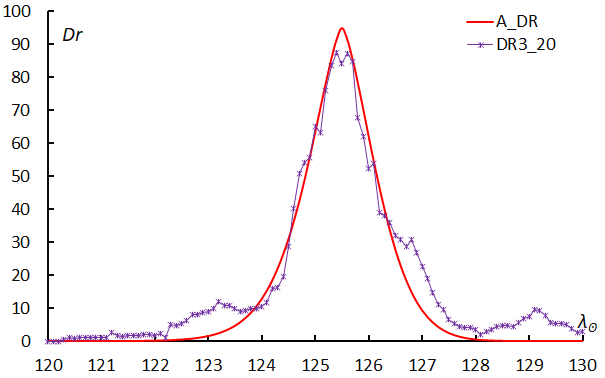
Figure 78 – Activity profile for the July gamma-Draconids.
0001CAP: alpha-Capricornids
λʘ = 126.9°, λ–λʘ = 178.6°, β = 9.9°, α = 305.4°, δ = –9.3°, vg = 22.1 km/s.
This meteor shower has been known since the earliest visual observations. As an ecliptical meteor shower, the radiant distribution is highly concentrated and the activity profile is clear. 692EQA00 seems to be part of CAP’s final stage activities.
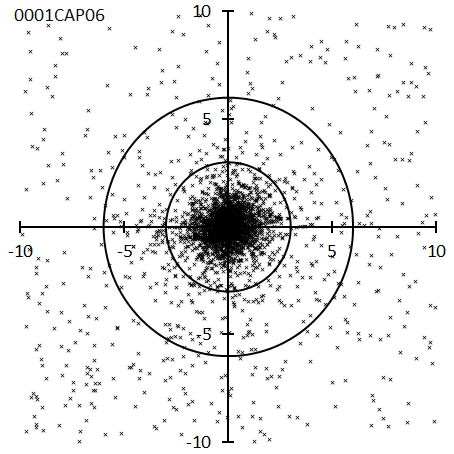
Figure 79 – Radiant point distribution map for the alpha-Capricornids.
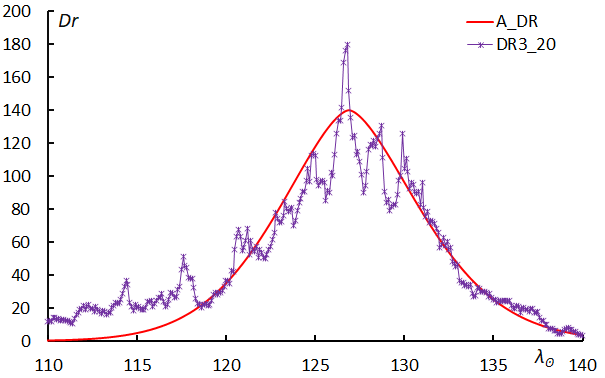
Figure 80 – Activity profile for the alpha-Capricornids.
0005SDA: Southern delta-Aquariids
λʘ = 126.9°, λ–λʘ = 208.4°, β = –7.4°, α = 340.0°, δ = –16.4°, vg = 40.4 km/s.
This meteor shower has been known for a long time also. Compared to CAP, the radiant distribution shows more diffused, especially in the latter half of the activity, showing an elongated oval shape. 0003SIA01, 0640AOA00 are considered part of SDA. Regarding the activity profile, the increase before the peak was rapid in the previous paper (Koseki, 2021) because the data from the SonotaCo network were not fully compensated for the decrease in observed amount due to the rainy season, but the GMN data shows that it is almost symmetrical.
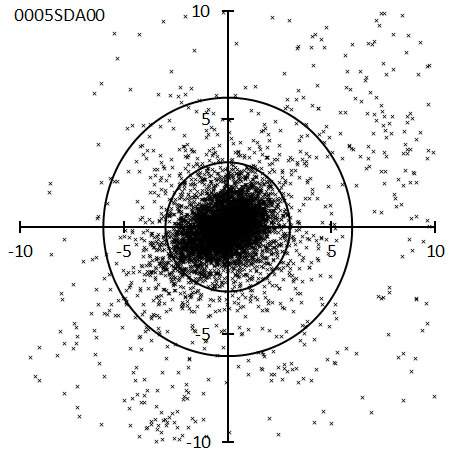
Figure 81 – Radiant point distribution map for the Southern delta-Aquariids.
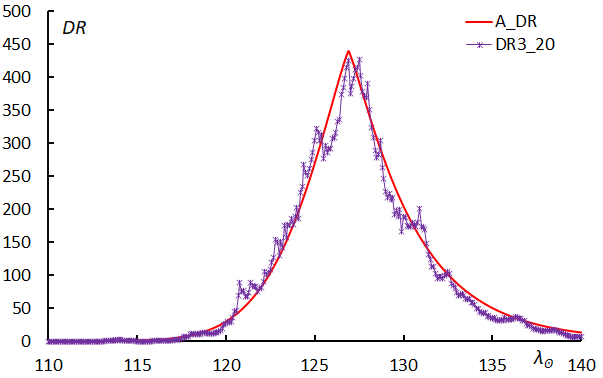
Figure 82 – Activity profile for the Southern delta-Aquariids.
0191ERI: eta-Eridanids
λʘ = 132.3°, λ–λʘ = 260.0°, β = –27.4°, α = 39.5°, δ = –13.5°, vg = 64.2 km/s.
This activity was detected by Ohtsuka and his team using a combination of visual observation, photography, etc. (Ohtsuka et al., 2001). It appears to be the tail end of the so-called “the tail of Orionids” and Jenniskens notes that it is a member of it in the IAUMDCSD. The radiant distribution extends vertically, which roughly matches the direction of “the tail of Orionids”. In the previous paper (Koseki, 2021), we set the maximum as λʘ = 137.5°, which is about 5 degrees different from the estimate in this paper. Despite the large number of meteors obtained, the activity profile has many irregularities, and there appears to be a maximum between λʘ = 135° and 140° in the activity profile (Figure 84).
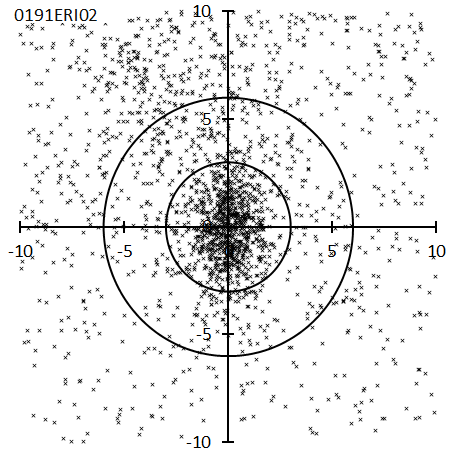
Figure 83 – Radiant point distribution map for the eta-Eridanids.
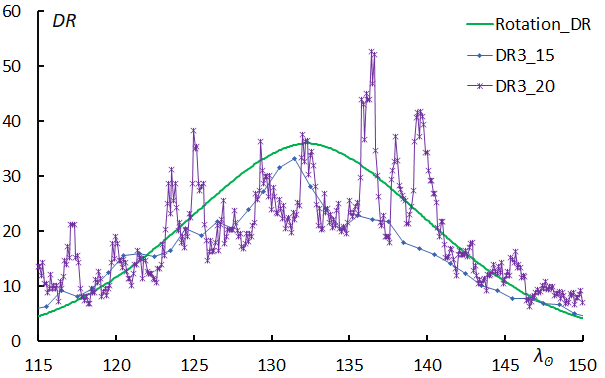
Figure 84 – Activity profile for the eta-Eridanids.
0465AXC: August xi-Cassiopeiids
λʘ = 135.5°, λ–λʘ = 252.1°, β = 42.6°, α = 3.8°, δ = 49.1°, vg = 55.5 km/s.
This meteor shower was detected by combining SonotaCo net and CAMS data (Rudawska and Jenniskens, 2014). However, it is not on the SonotaCo net J14 list and was not mentioned in the previous article (Koseki, 2021). Although the number of meteors obtained is only a fraction of that of ERI, the activity profile is clear (Figure 86).
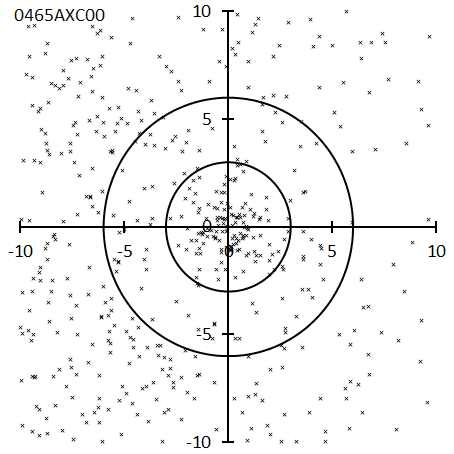
Figure 85 – Radiant point distribution map for the August xi-Cassiopeiids.
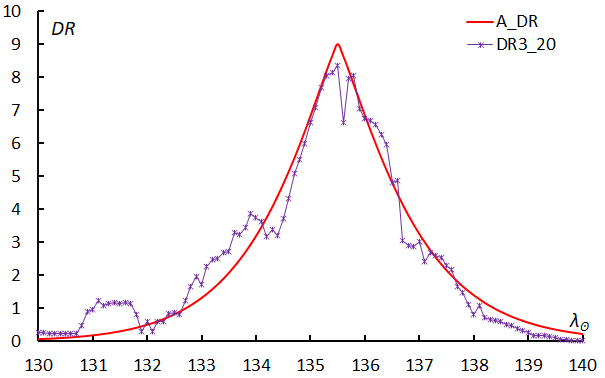
Figure 86 – Activity profile for the August xi-Cassiopeiids.
0007PER: Perseids
λʘ = 140.5°, λ–λʘ = 283.4°, β = 38.3°, α = 49.2°, δ = 58.1°, vg = 58.8 km/s.
Expressed in coordinates (λ–λʘ, β), the radiant of the Perseids is almost stationary, but its distribution is elliptical and spreads upward like the tail of a comet. Furthermore, after the maximum, the distribution of radiants rapidly becomes blurred. As is known, the activity profile has a double structure of a pedestal and a tower (Figure 88). At λʘ < 130°, which corresponds to the pedestal in the activity profile, the radiant shift also seems to change. At the start of the activity, considering the distinction from ZCS, both the SonotaCo net J14 list and GMN are close to λʘ = 115°. Regarding the end of activity, J14 sets λʘ = 156.36°, and GMN sets λʘ = 150.0°, but GMN actually judges some meteors with λʘ > 165° as PER.
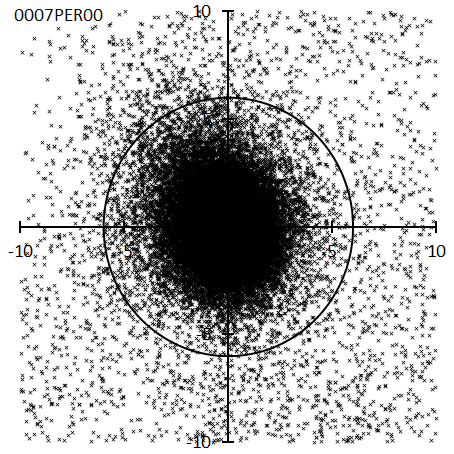
Figure 87 – Radiant point distribution map for the Perseids.
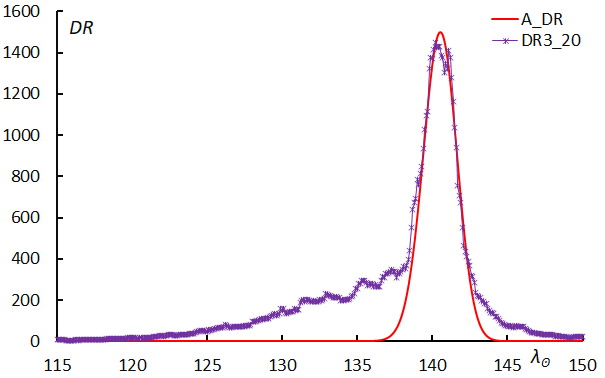
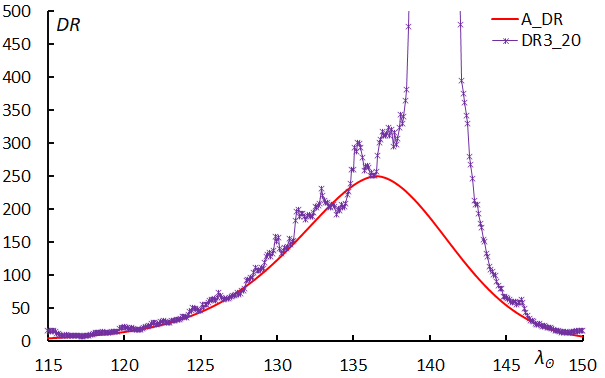
Figure 88 – Activity profile for the Perseids.
0012KCG: kappa-Cygnids
λʘ = 141.5°, λ–λʘ = 162.9°, β = 71.1°, α = 286.4°, δ = 49.6°, vg = 22.4 km/s.
This meteor shower gained attention due to photographic observations by Whipple (1954). The activity seen in the upper right corner of the radiant distribution is sometimes treated as KCG in normal years, so it is necessary to distinguish it from KCG. KCG activity increases every seven years, GMN observations began in 2019 and were lucky enough to capture the periodic activity in 2021. The activity curve in Figure 90 can be said to represent the activity in 2021. While the SonotaCo net J14 list sets the active period to λʘ = 136.55° to 150.34°, GMN sets the active period to λʘ = 93.1° to 167.1°, which seems extremely long. We discussed this problem in Part II, “Meteor showers that need careful attention” (Koseki, 2024b), please refer to this article.
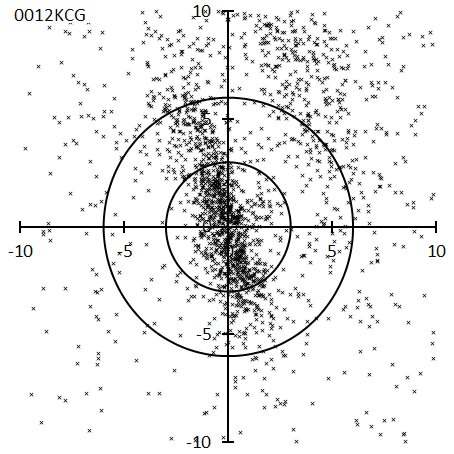
Figure 89 – Radiant point distribution map for the kappa-Cygnids.
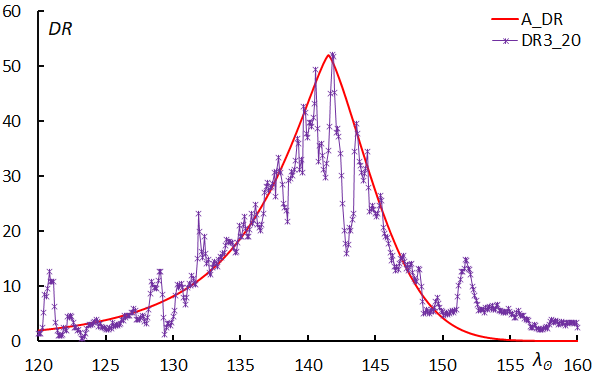
Figure 90 – Activity profile for the kappa-Cygnids.
0199ADC: August delta-Capricornids
λʘ = 143.65°, λ–λʘ = 180.1°, β = 2.2°, α = 325.3°, δ = –11.5°, vg = 23.8 km/s.
0190ADC00 is an activity detected from photographic meteors brighter than –3 magnitude (Porubcan and Gavajdova, 1994). The radiant of the ADC is located 5 degrees lower right from the center of the radiant distribution in Figure 91, and λʘ = 147.70°. The activity profile in Figure 92 is extremely sharp, suggesting that the activity captured in this paper is different from ADC. ADC is not listed on SonotaCo net J14 list or GMN. Most of the meteors captured by GMN were in 2022, so it seems better to think that this activity happened to appear suddenly near 0190ADC00. ADC01 is a report based on CAMS data for this activity (Jenniskens, 2022), and Sekiguchi announced that it was also detected by the SonotaCo net (Sekiguchi, 2022). Instead of calling it as ADC, it should be given a different number and name.
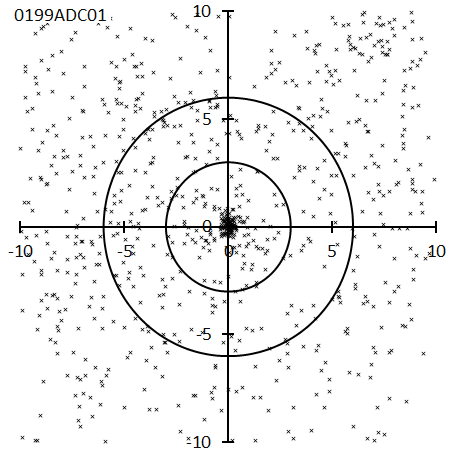
Figure 92 – Activity profile for the August delta-Capricornids.
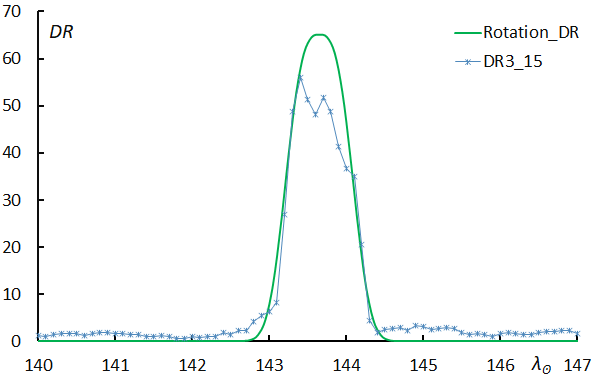
Figure 92 – Activity profile for the August delta-Capricornids.
AXD: August xi-Draconids
λʘ = 147.2°, λ–λʘ = 140.6°, β = 82.8°, α = 274.3°, δ = 59.7°, vg = 21.8 km/s.
This activity is tentatively named AXD (August xi Draconids) in this paper, and the activity at the bottom left of the radiant distribution in Figure 93 is KCG. Although the activity is clearly distinguishable, it is also confusing in the IAUMDCSD, as detailed in Part II, “Meteor showers that need careful attention” (Koseki, 2024b). As seen in the estimation of the activity profile, the activity is thought to end rapidly at λʘ > 150° and should be distinguished from the activity observed after that point.
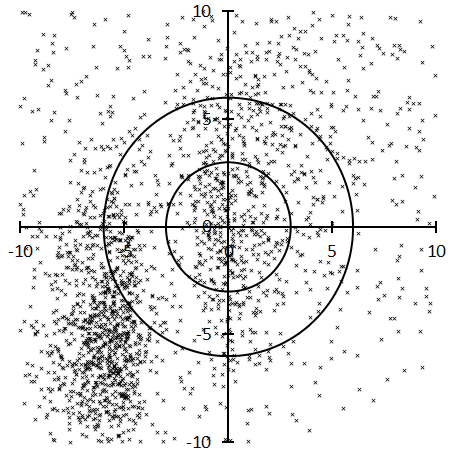
Figure 93 – Radiant point distribution map for the August xi-Draconids.
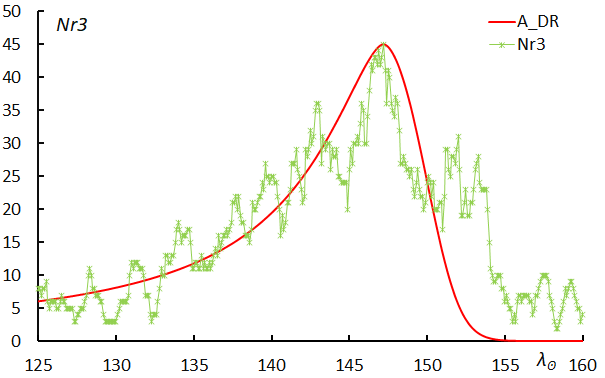
Figure 94 – Activity profile for the August xi-Draconids.
0026NDA: Northern delta-Aquariids
λʘ = 149°, λ–λʘ = 206.8°, β = 7.0°, α = 353.4°, δ = 4.8°, vg = 37.9 km/s.
The NDA remarks have the annotation “Member of 297/DAQ” except for NDA10, but the DAQ data is empty and s = 2, which means it is poor data. NDA04 (SonotaCo net observation) is annotated with “the name is 342/BPI August beta-Piscids”, and NDA06 and NDA07 have “Previously considered as 508/TPI”. It is difficult to determine when the term NDA first appeared for the meteor shower activities in this section. NDA was used to correspond to 0005SDA and was used for activities around λ–λʘ = 130° (Wright et al., 1957), but gradually it has been called NDA for activities that occurred later. BPI would be a more appropriate name than NDA. GMN calls this activity NDA, but the SonotaCo net J14 list calls it BPI.
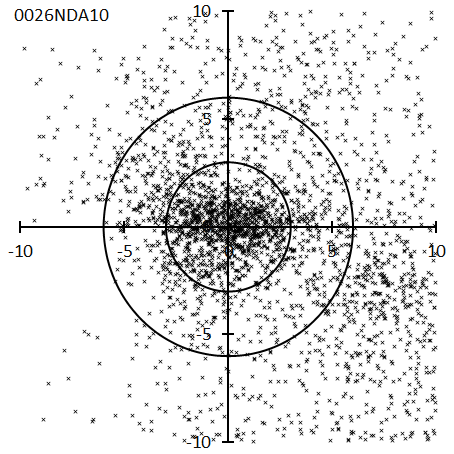
Figure 95 – Radiant point distribution map for the Northern delta-Aquariids.
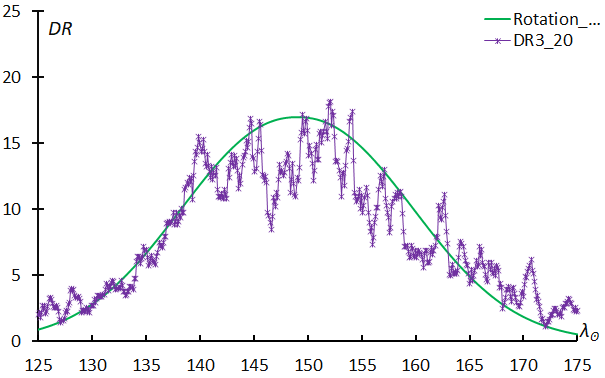
Figure 96 – Activity profile for the Northern delta-Aquariids.
ZDR: zeta-Draconids
λʘ = 153.2°, λ–λʘ = 52.7°, β = 84.6°, α = 258.9°, δ = 63.8°, vg = 21.9 km/s.
Including GMN, there have recently been cases where this activity is combined with AXD to form AUD. In the previous article (Koseki, 2021), we referred to this activity as AUD, following the IAUMDC, but we will appropriately refer to this activity as ZDR in this article. For more information on the relationship with ZDR in IAUMDC, please refer to Part II, “Meteor showers that need careful attention” (Koseki, 2024b). Since ZDR intersects with the path of AXD near λʘ = 145°, a spurious maximum occurs as a side effect in the activity curve.
Figure 97 – Radiant point distribution map for the zeta-Draconids.
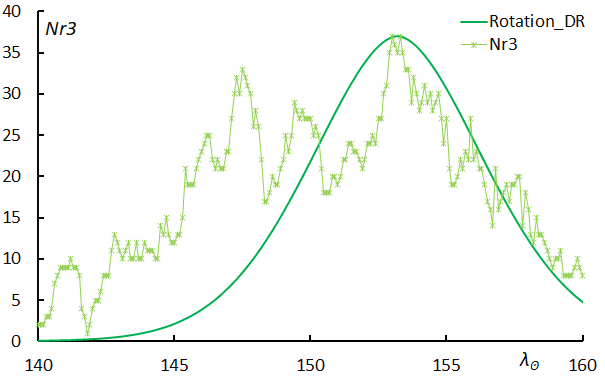
Figure 98 – Activity profile for the zeta-Draconids.
0523AGC: August gamma-Cepheids
λʘ = 155.4°, λ–λʘ = 263.2°, β = 63.6°, α = 358.0°, δ = 76.6°, vg = 43.9 km/s.
This is also a meteor shower detected by combining observations from Croatia and the SonotaCo net (Andreić et al., 2013). AGC seems to have a stable activity every year, and the SonotaCo net J14 list and GMN match well. The orbit of AGC is that of a long-period comet, intersecting the Earth’s orbit at an almost perpendicular angle almost at perihelion, but since the direction of perihelion moves along the ecliptic plane, the period of activity is relatively long.
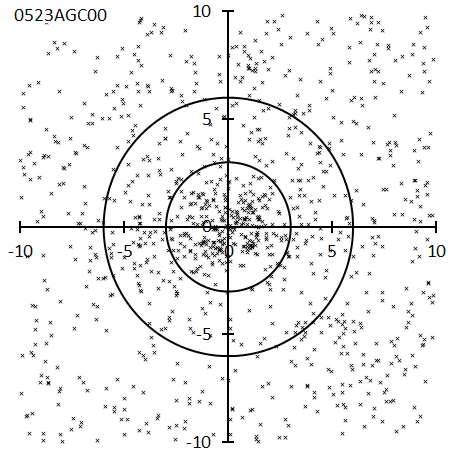
Figure 99 – Radiant point distribution map for the August gamma-Cepheids.
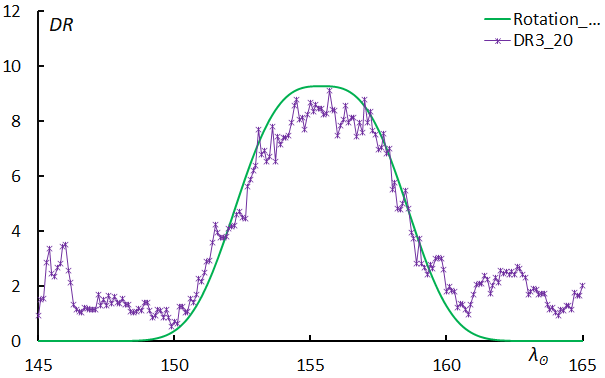
Figure 100 – Activity profile for the August gamma-Cepheids.
0206AUR: Aurigids
λʘ = 158.4°, λ–λʘ = 292.6°, β = 15.8°, α = 91.2°, δ = 39.2°, vg = 65.5 km/s.
Since Hoffmeister caught a sudden appearance in 1935 (Hoffmeister, 1948), several outbursts have been observed, however now this meteor shower is confirmed to be active every year. As seen in the activity curve, there also appears to be weak activity before and after the sharp maximum. However, as seen in the radiant distribution (Figure 101), there are many sporadic meteors in the surrounding area, so it would be better to limit the period of activity.
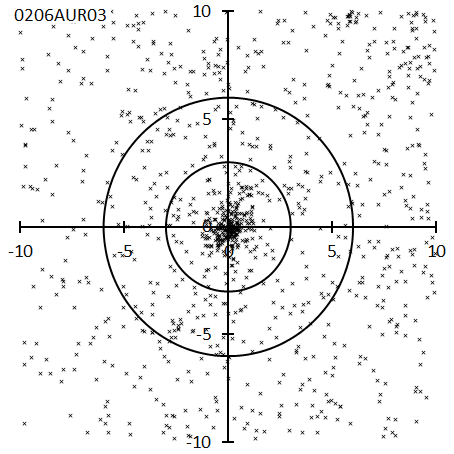
Figure 101 – Radiant point distribution map for the Aurigids.
Figure 102 – Activity profile for the Aurigids.
0552PSO: pi6-Orionids
λʘ = 160.4°, λ–λʘ = 267.4°, β = –24.3°, α = 69.8°, δ = –2.4°, vg = 65.5 km/s.
This is also a meteor shower detected by combining observations from Croatia and the SonotaCo net (Šegon et al., 2014). The IAUMDCSD meteor showers corresponding to the radiant distribution are shown in Figure 104. The Croatian group reported 0337NUE at the same time as this PSO, and the cross on the far right indicates this. The other two crosses are also considered NUE in the IAUMDCSD. Jenniskens’ PSO is the left filled box (PSO01) and he regards it a part of “the tail of Orionids”. The radiant distribution shows that it is quite difficult to distinguish between meteor showers and sporadic meteors or the “the tail of Orionids” in this region.
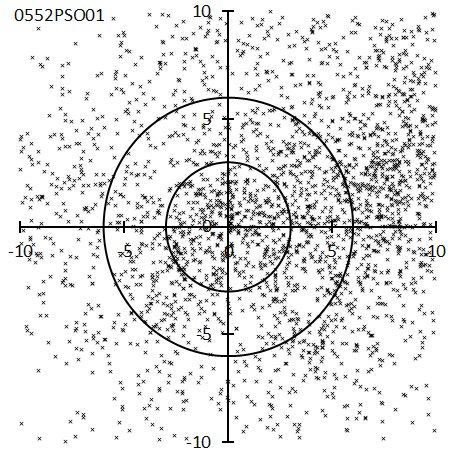
Figure 103 – Radiant point distribution map for the pi6-Orionids.
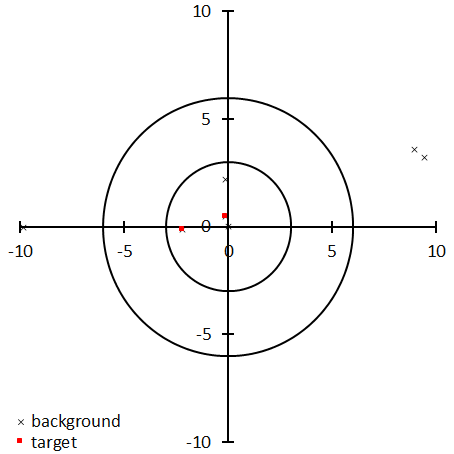
Figure 104 – The IAUMDCSD meteor showers corresponding to the radiant distribution for the pi6-Orionids.
Figure 105 – Activity profile for the pi6-Orionids.
0694OMG: omicron-Geminids
λʘ = 163.2°, λ–λʘ = 307.1°, β = 17.1°, α = 115.2°, δ = 38.8°, vg = 58.1 km/s.
Although it appears in the first CAMS report (Jenniskens et al., 2016d), there have been no subsequent confirmation observations. The position of 0695APA00 (λʘ = 146°, λ–λʘ = 308.39°, β = 18.75°) is extremely close to the position estimated from the movement of the OMG radiant point λʘ = 146°, λ–λʘ = 310.4°, β = 18.6°). Both may be the same activity. The right side of the radiant distribution is the Apex area, and OMG is located at the eastern edge of it.
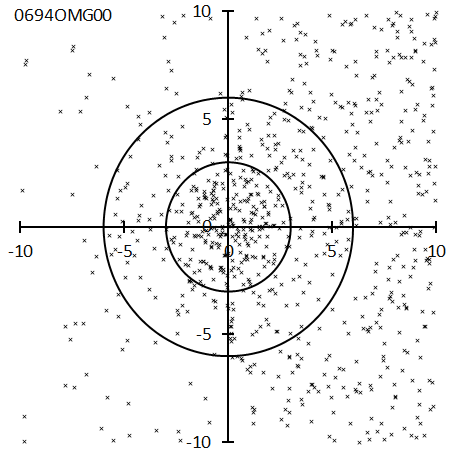
Figure 106 – Radiant point distribution map for the omicron-Geminids.
Figure 107 – Activity profile for the omicron-Geminids.
0337NUE: nu-Eridanids
λʘ = 165.5°, λ–λʘ = 259.1°, β = –21.3°, α = 66.4°, δ = 0.1°, vg = 65.4 km/s.
The first detection of NUE was made by SonotaCo net (SonotaCo, 2009). It is the second most active region after 0191ERI in the activity region of “the tail of Orionids”, but it is diffuse as seen in the radiant distribution. The part that looks like a tail branch extending to the left is 0552PSO. The area on the far right where radiant points are concentrated is the activity of 0583TTA00 and 1142SNT00, which are mentioned in Part II, “Meteor showers that need careful attention” (Koseki, 2024b). Even considering the radiant drift, the NUE activity profile is unclear. Regarding the period of activity, the SonotaCo net J14 list is limited to λʘ = 160.50°~171.46°, while GMN’s is λʘ = 147.6°~232°. The graph of the number of observed meteors published by GMN is shown below the activity profile in Figure 109, and it clearly shows including multiple activities.
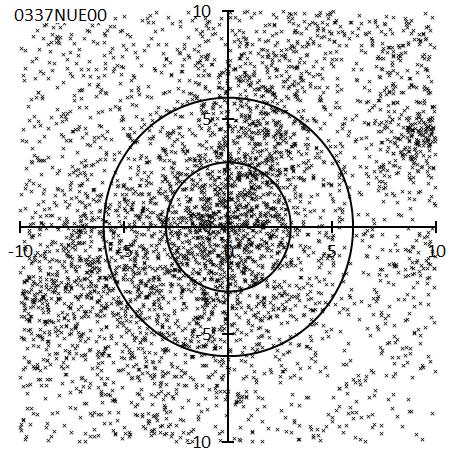
Figure 108 – Radiant point distribution map for the nu-Eridanids.
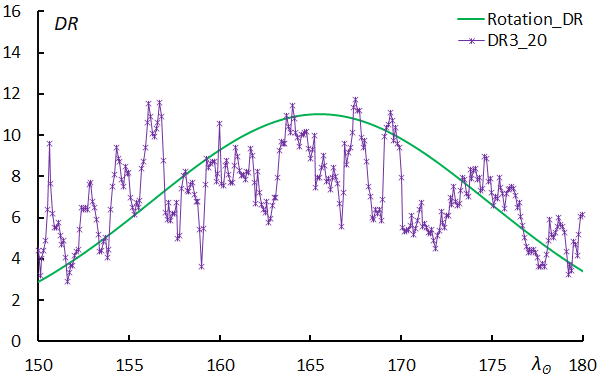
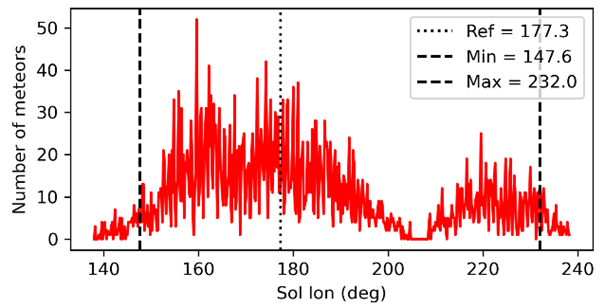
Figure 109 – Activity profile for the nu-Eridanids (top), determed by GMN (bottom).
0208SPE: September epsilon-Perseids
λʘ = 166.9°, λ–λʘ = 249.1°, β = 21.1°, α = 47.4°, δ = 39.6°, vg = 64.0 km/s.
The existence of the September Perseids has been known since the era of visual observations, but even with the advent of photographic and radio observations, no clear conclusions could be reached. Jenniskens gave it the name SPE in his famous book (Jenniskens, 2006), but the data were disorganized and did not provide a clear conclusion. The decisive blow was given by the SonotaCo net report listed as SPE00 (SonotaCo, 2009). This initial report called it “September-Perseids”, but Jenniskens identified it as SPE. Currently, SPE is one of the most prominent meteor showers in video observations.
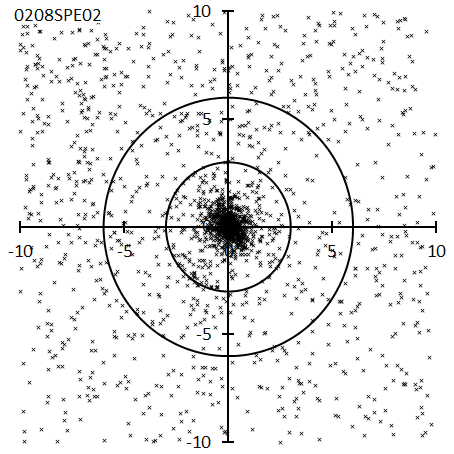
Figure 110 – Radiant point distribution map for the September epsilon-Perseids.
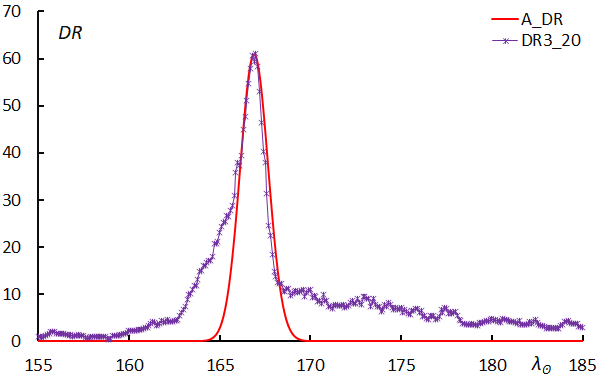
Figure 111 – Activity profile for the September epsilon-Perseids.
0215NPI: Northern delta-Piscids
λʘ = 167.2°, λ–λʘ = 196.7°, β = 3.8°, α = 2.1°, δ = 5.1°, vg = 28.7 km/s.
The combination of 0033NIA and 0215NPI is called NPI here, but in the previous article (Koseki, 2021), the same activity was called NIA. For more information on the reason, please refer to Part II, “Meteor showers that need careful attention” (Koseki, 2024b) (7. 0033NIA and 0215NPI). Both the SonotaCo net J14 list and GMN distinguish between NIA and NPI activities, and the NPI activity is in the latter half of the activity curve (Figure 113), especially in the J14 list, where the activity is extremely limited at λʘ = 181.79°~184.37°. The activity at the bottom left of the radiant distribution is sometimes called SPI, and this can almost be considered the early activity of the STA. As a side note, regarding NIA, the IAUMDCSD refers to empty data called “Member of 298/IAQ complex”, but this is a remnant of an old version.
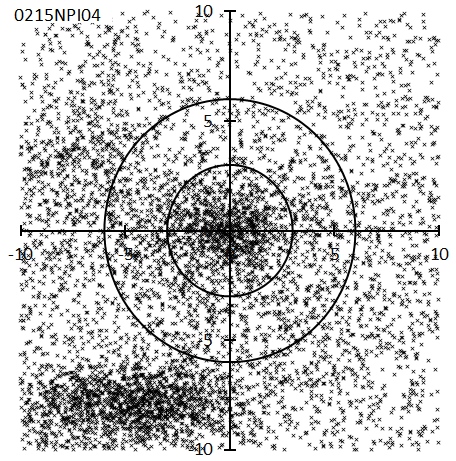
Figure 112 – Radiant point distribution map for the Northern delta-Piscids.
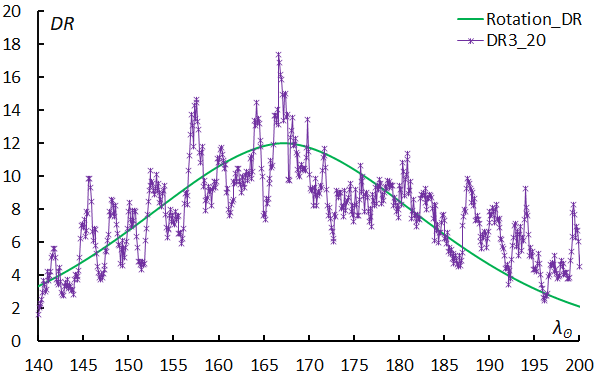
Figure 113 – Activity profile for the Northern delta-Piscids.
0081SLY_0: September Lyncids
λʘ = 169.5°, λ–λʘ = 294.9°, β = 33.5°, α = 111.7°, δ = 55.8°, vg = 58.7 km/s.
As mentioned in detail in Part II, “Meteor showers that need careful attention” (Koseki, 2024b), two different activities are registered as SLY in the IAUMDC. 0705UYL00 should be identified with this SLY_0. The SonotaCo net J14 list calls this activity as UYL.
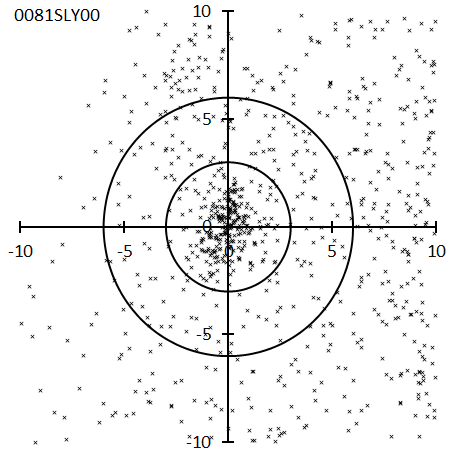
Figure 114 – Radiant point distribution map for the September Lyncids.
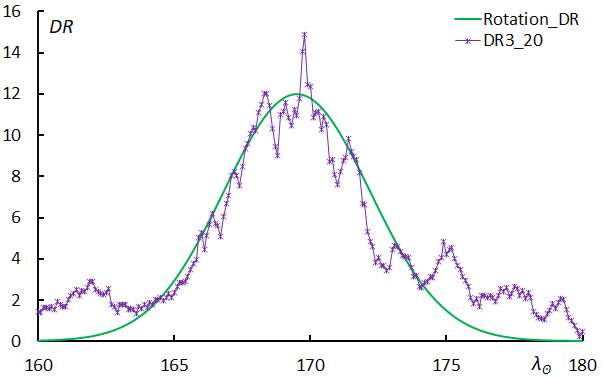
Figure 115 – Activity profile for the September Lyncids.
0757CCY: chi-Cygnids
λʘ = 173.4°, λ–λʘ = 140.1°, β = 52.6°, α = 300.2°, δ = 33.6°, vg = 14.7 km/s.
An outburst was captured by CAMS (Jenniskens, 2015) and observers in Europe in 2015 (Koukal et al., 2016). Shiba immediately pointed out the five-year activity periodicity (Shiba, 2015) and the author confirmed this using data from SonotaCo Net, CAMS, EDMOND, and GMN (Koseki, 2022b). The radiant distribution and activity profile in Figures 116 and 117 are based on GMN observations in 2020. The next return will be in 2025. There seems to be a tendency for activity to increase each time, but confirmation is required (Koseki, 2022b). Naturally, it was not mentioned in the previous article (Koseki, 2021), and it is not in the SonotaCo net J14 list.
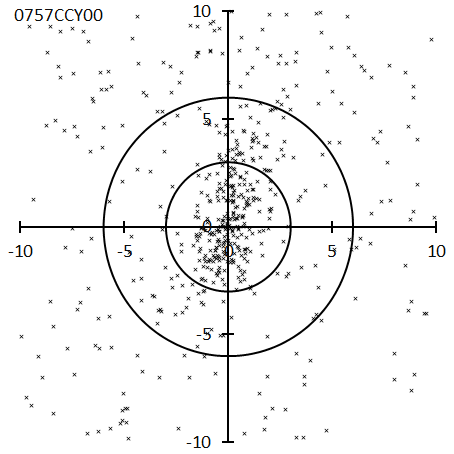
Figure 116 – Radiant point distribution map for the chi-Cygnids.
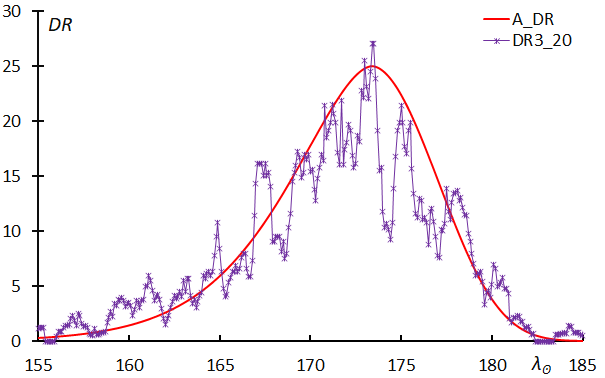
Figure 117 – Activity profile for the chi-Cygnids.
0221DSX: Daytime Sextantids
λʘ = 188.5°, λ–λʘ = 330.6°, β = –11.5°, α = 156.5°, δ = –2.5°, vg = 32.3 km/s.
IAUMDCSD uses “Galligan and Baggaley, 2002” for 0221DSX00, but this should refer to Nilsson, who first detected it through radar observations in 1961 at Adelaide (Nilsson, 1964). It is thought that they may have a twin relationship with Geminids. With the development of video observation, it became a target for optical observation.
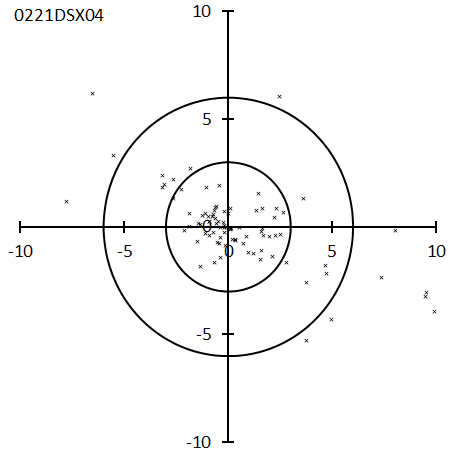
Figure 118 – Radiant point distribution map for the Daytime Sextantids.
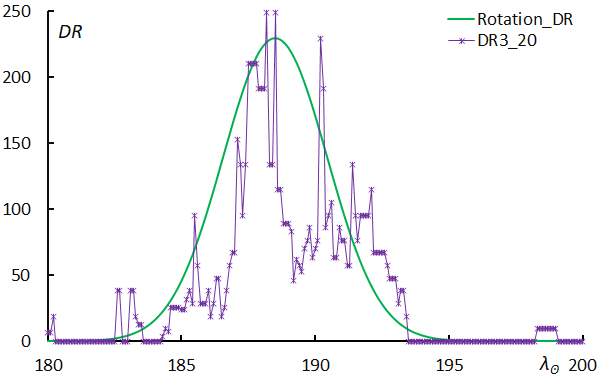
Figure 119 – Activity profile for the Daytime Sextantids.
0081SLY_1: September Lyncids
λʘ = 191.5°, λ–λʘ = 277.5°, β = 23.9°, α = 115.2°, δ = 45.7°, vg = 66.3 km/s.
0424SOL00 should be identified as this activity, as described in detail in Part II, “Meteor showers that need careful attention” (Koseki, 2024b). It appears to be a chance association of sporadic meteors, but the one listed as “Lyncids” in Lindblad’s list (Lindblad, 1971) corresponds to SLY_1. SLY01 is not featured in the SonotaCo net J14 list. On the other hand, GMN treats SLY_1 as SOL.
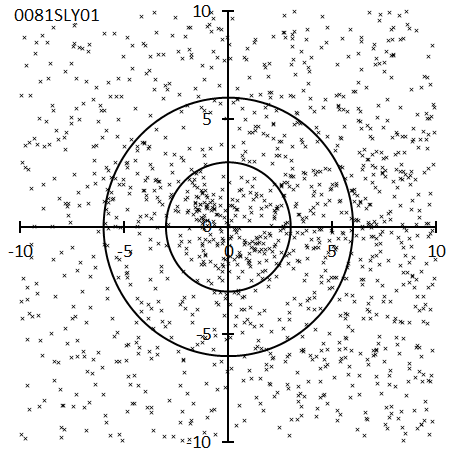
Figure 120 – Radiant point distribution map for the September Lyncids.
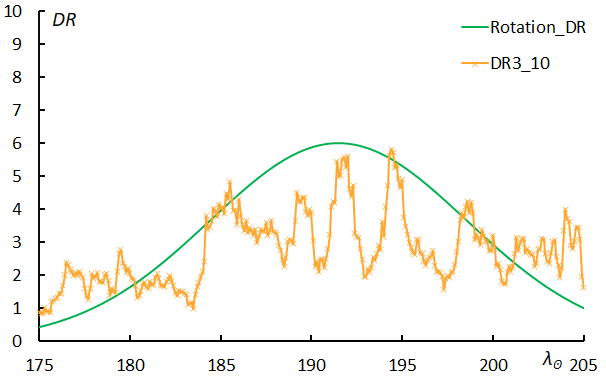
Figure 121 – Activity profile for the September Lyncids.
0281OCT: October Camelopardalids
λʘ = 192.55°, λ–λʘ = 281.6°, β = 62.0°, α = 167.6°, δ = 78.6°, vg = 45.8 km/s.
An outburst was captured in Europe in 2005 (Jenniskens et al., 2005), but observations by the SonotaCo network later confirmed that it was an annual meteor shower (SonotaCo, 2009). As can be seen from the activity profile in Figure 123, the period of high activity is limited to approximately one day, so it seems to be a matter of whether the observation point is blessed with the conditions to encounter the maximum. The density of radiant points is also high (Figure 122), and if one encounters the maximum, it will be noticeable.
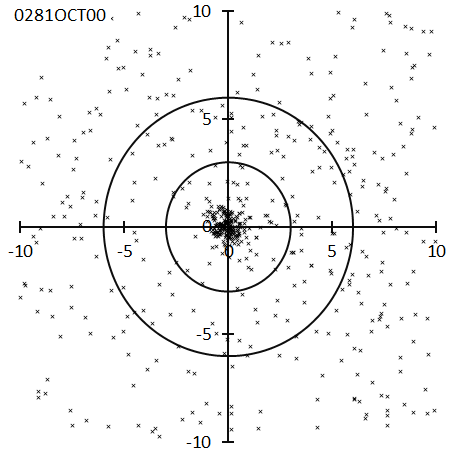
Figure 122– Radiant point distribution map for the October Camelopardalids.
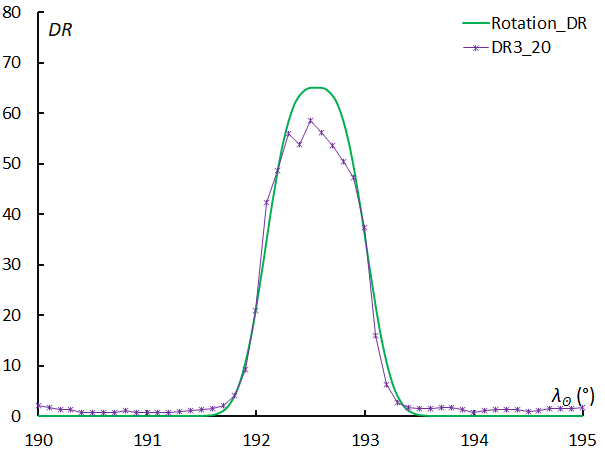
Figure 123 – Activity profile for the October Camelopardalids.
0924SAN: 62-Andromedids
λʘ = 196.8°, λ–λʘ = 214.4°, β = 29.8°, α = 37.9°, δ = 46.5°, vg = 16.9 km/s.
This activity appeared in the second report of CAMS (Jenniskens et al., 2018b), was not covered in the previous article (Koseki, 2021), and is not on the SonotaCo net J14 list. This is a very unique meteor shower; in the geocentric velocity distribution shown in Figure 126, the lower cluster is SAN, and the upper cluster are sporadic meteors. In the radiant distribution, the circled crosses are the SAN under the geocentric velocity distribution, and the surrounding crosses can be regarded as sporadic meteors.
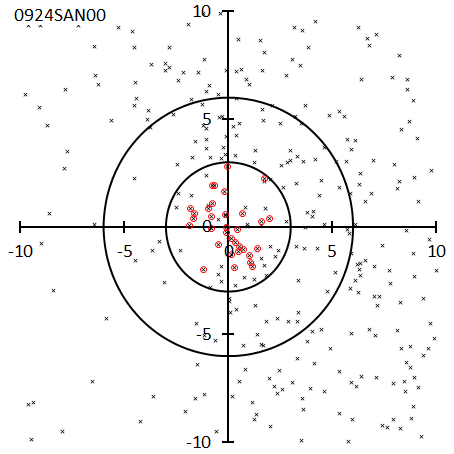
Figure 124– Radiant point distribution map for the 62-Andromedids (red circled crosses), others are sporadics.
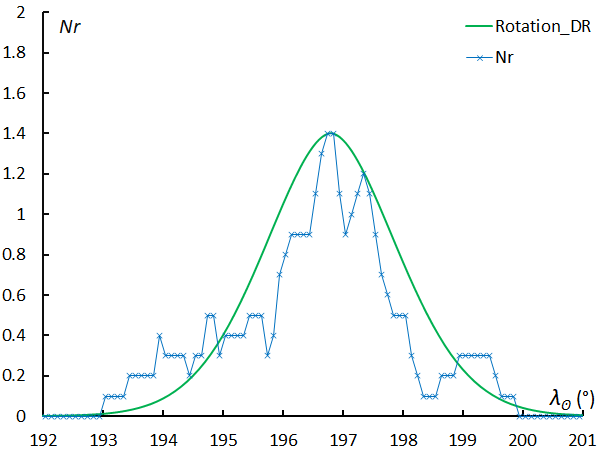
Figure 125 – Activity profile for the 62-Andromedids.
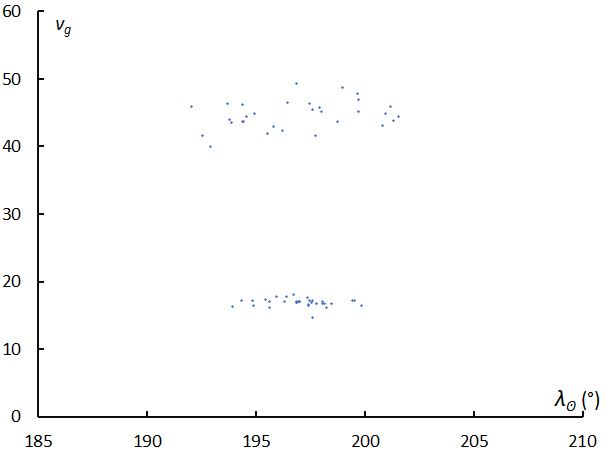
Figure 126 – The velocity distribution in function of time, upper concentration are sporadic meteors, lower concentration are SAN meteors.
0825XIE: xi-Eridanids
λʘ = 198.2°, λ–λʘ = 228.1°, β = –27.8°, α = 69.1°, δ = –6.1°, vg = 54.2 km/s.
The second CAMS report is the first detection of this meteor shower (Jenniskens et al., 2018b). XIE was not mentioned in the previous article (Koseki, 2021), and it is not in the SonotaCo net J14 list. Due to the small number of observed meteors, the status of activity is not clear. In GMN, the activity period is set at λʘ = 190.8°~200.8°, and the maximum is set slightly earlier at λʘ = 196.5°.
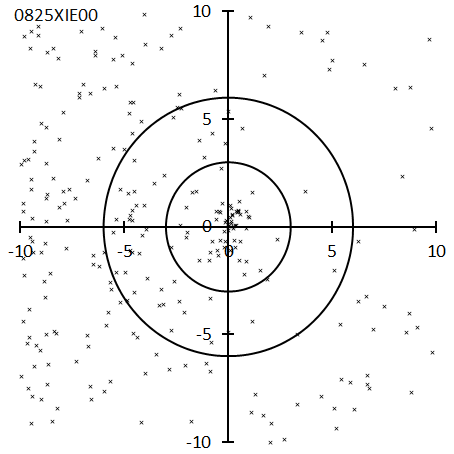
Figure 127 – Radiant point distribution map for the xi-Eridanids.
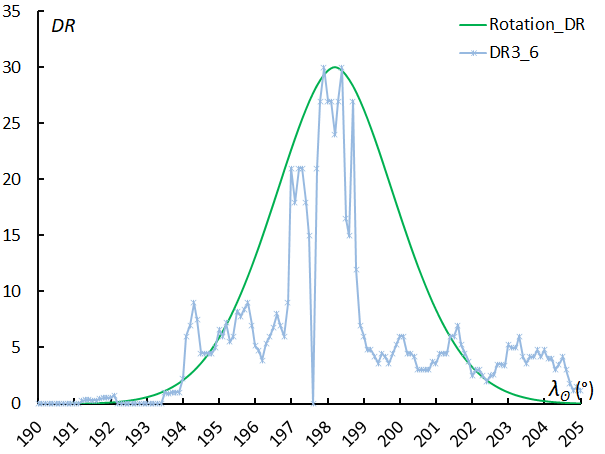
Figure 128 – Activity profile for the xi-Eridanids.
0002STA_SE: Southern Taurids_SE
λʘ = 201.5°, λ–λʘ = 195.8°, β = –4.4°, α = 36.4°, δ = 9.8°, vg = 28.8 km/s.
As mentioned in detail in Part II, “Meteor showers that need careful attention” STA must be considered separately into October Arietids (STA_SE) and Taurids in November (STA_SF). The increase seen in the activity curve after λʘ > 210° is due to STA_SF (Figure 130). Since the radiant points are close and the geocentric velocities are almost the same, the only way to distinguish these two activities is to simply assume that the October maximum is STA_SE and the November maximum is STA_SF. Although the activity of STA_SF changes greatly from year to year, the activity of this STA_SE is almost constant every year.
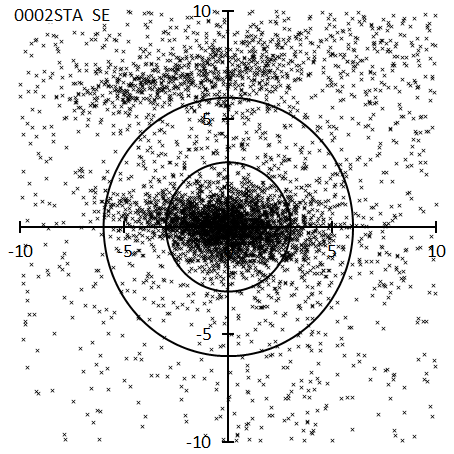
Figure 129 – Radiant point distribution map for the Southern Taurids_SE.
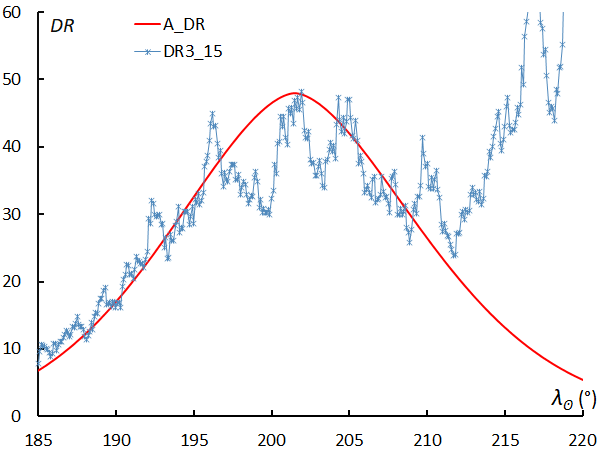
Figure 130 – Activity profile for the Southern Taurids_SE.
0333OCU: October Ursae Majorids
λʘ = 202.5°, λ–λʘ = 279.1°, β = 46.8°, α = 145.7°, δ = 64.2°, vg = 55.5 km/s.
his colleagues (Uehara et al., 2006), which was the result of the activities of the predecessor of the SonotaCo net. The radiant points are densely packed (Figure 131), and the activity profile is sharp (Figure 132). The number of meteors obtained appears to differ depending on the year, depending on whether a maximum is encountered. In 2006, when it was first detected, 14 OCU meteors were observed, but in 2007 and 2008, only 3 and 5 OCU meteors were observed by the SonotaCo net, respectively.
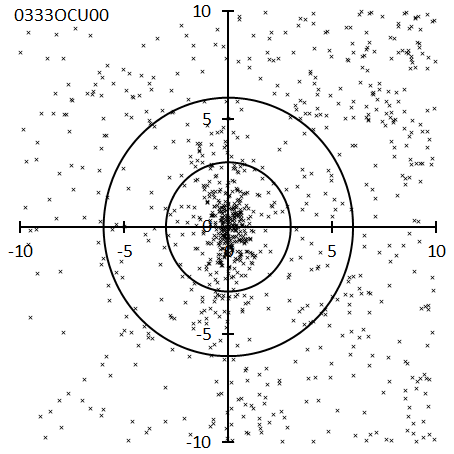
Figure 131 – Radiant point distribution map for the October Ursae Majorids.
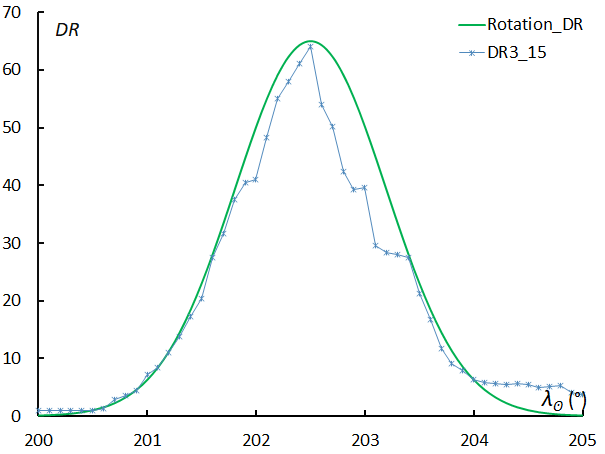
Figure 132 – Activity profile for the October Ursae Majorids.
0023EGE: epsilon-Geminids
λʘ = 203.7°, λ–λʘ = 254.9°, β = 5.1°, α = 99.7°, δ = 28.3°, vg = 68.7 km/s.
Its existence has been known since the days when it was treated as a sub radiant point of the Orionids. The Orionids are at the bottom right of the radiant distribution, and there are many sporadic meteors around it (Figure 133). The activity profile fluctuates so much that the maximum could be anywhere from λʘ = 198° to 208° (Figure 134). This is because activities vary greatly from year to year. The raw observed meteor counts (not DR) exhibit maximums in 2019 at λʘ = 211.4°, in 2020 at λʘ = 205.6°, in 2021 at λʘ = 202.1°, and in 2022 at λʘ = 208.1°, with an average of λʘ = 211.4°. The IAUMDCSD also has a range of λʘ = 198° to 209.70°, and λʘ = 203.7° shown in this paper (Table 7 of Part I “Research methods and summary of survey results”, see also Table 5 in Part I, Koseki, 2024a) is also a reference value.
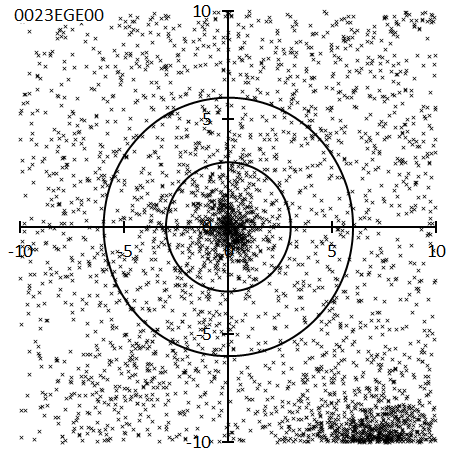
Figure 133 – Radiant point distribution map for the epsilon-Geminids.
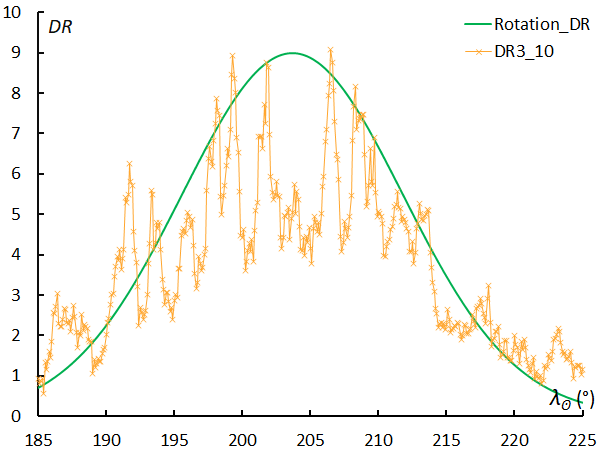
Figure 134 – Activity profile for the epsilon-Geminids.
0022LMI: Leonis Minorids
λʘ = 209.2°, λ–λʘ = 298.0°, β = 26.2°, α = 160.3°, δ = 36.8°, vg = 61.3 km/s.
This is a meteor shower discovered through photographic observation using Super Schmidt at Harvard (McCrosky and Posen, 1959). Despite being active during the Orionids maximum, it is rarely detected visually. Although it borders the Apex region, surrounding meteor activity is low, making it a conspicuous meteor shower in photographic and video observations. CMOR radar observations also capture weak but steady activity every year.
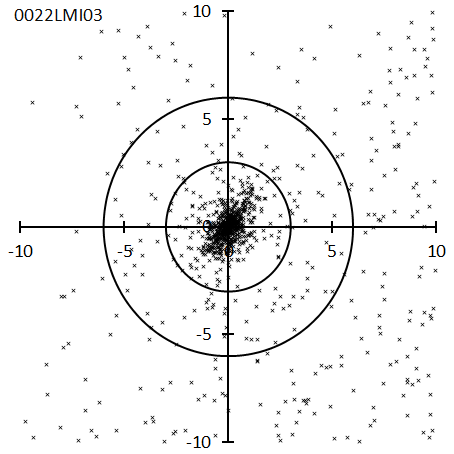
Figure 135 – Radiant point distribution map for the Leonis Minorids.
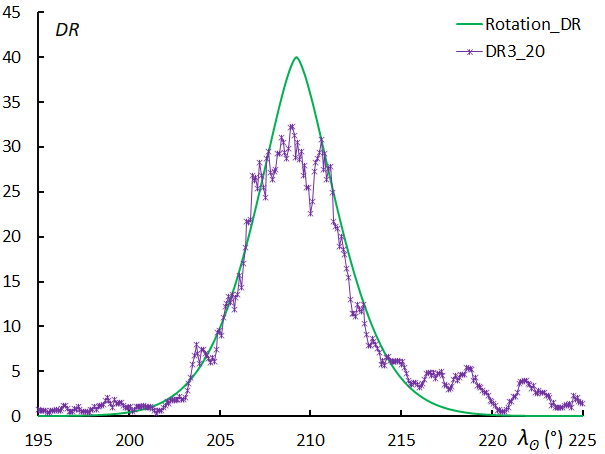
Figure 136 – Activity profile for the Leonis Minorids.
0480TCA_OML: tau-Cancrids_October mu-Leonids
λʘ = 209.5°, λ–λʘ = 283.4°, β = 13.4°, α = 139.7°, δ = 29.8°, vg = 67.0 km/s.
For details, as mentioned in Part II, “Meteor showers that need careful attention” (Koseki, 2024b), TCA and 0481OML are treated as one single activity. In the previous paper (Koseki, 2021), we only focused on TCA, but the activity profiles obtained in the previous and this paper are almost the same.
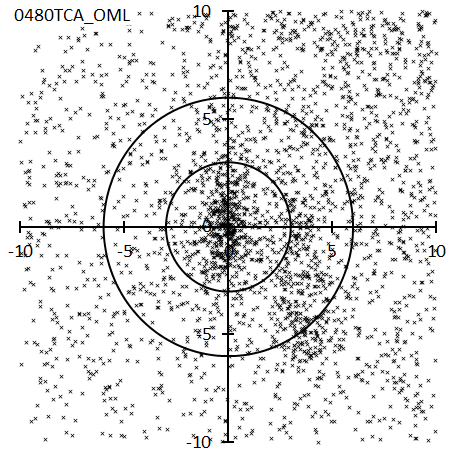
Figure 137 – Radiant point distribution map for the tau-Cancrids_October mu-Leonids.
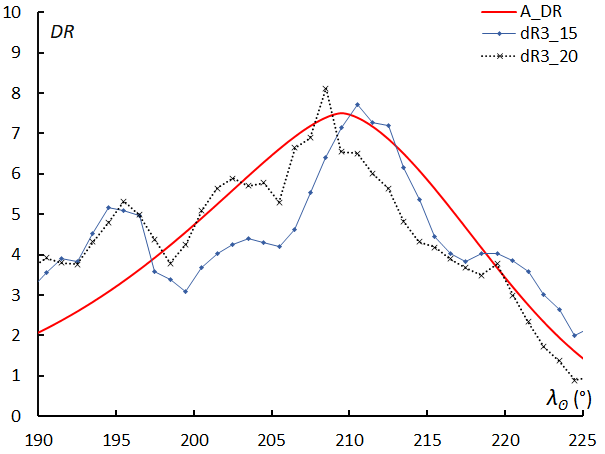
Figure 138 – Activity profile for the tau-Cancrids_October mu-Leonids.
0008ORI: Orionids
λʘ = 209.5°, λ–λʘ = 246.6°, β = –7.5°, α = 96.3°, δ = 15.8°, vg = 65.5 km/s.
In Part I, “Research methods and summary of survey results” (Koseki, 2024a), we gave a detailed explanation of the Orion group as an example, and in Part II, “Meteor showers that need careful attention” (Koseki, 2024b), we wrote about the “the tail of Orionids” so please refer to those as well. SonotaCo net observations include 2007–2009 (Koseki, 2021), when the Orion group was active, but the activity profile shown in Figure 139 corresponds to the previous period 2010–2018 (normal year).
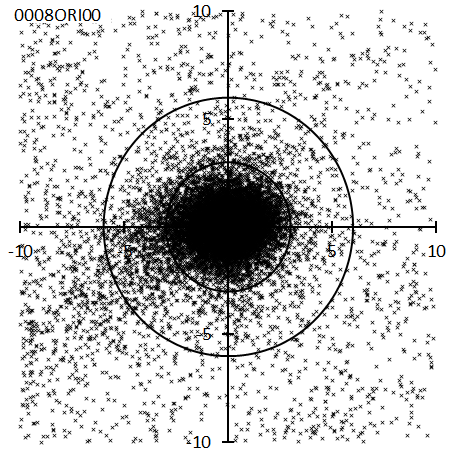
Figure 139 – Radiant point distribution map for the Orionids.
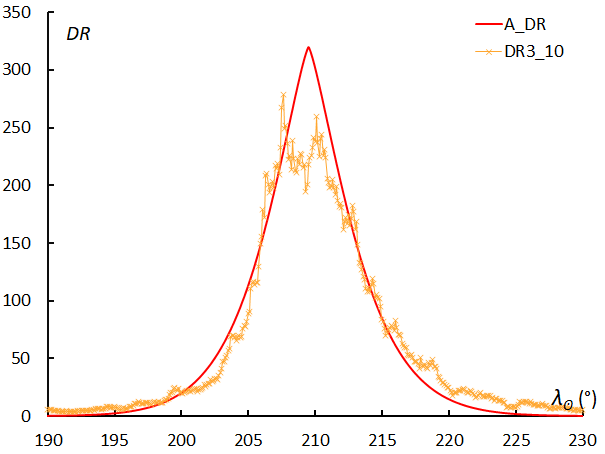
Figure 140 – Activity profile for the Orionids.
0524LUM: lambda-Ursae Majorids
λʘ = 214.8°, λ–λʘ = 284.4°, β = 36.8°, α = 158.2°, δ = 49.2°, vg = 60.5 km/s.
This activity was detected by combining observations from Croatia and SonotaCo net (Andreić et al., 2013). The orbit is such that the perihelion rotates along the ecliptic plane, and the radiant point of such meteor showers does not move much on the coordinates (λ–λʘ, β). Activity is stable every year, and the SonotaCo net J14 list and GMN’s numbers match well.
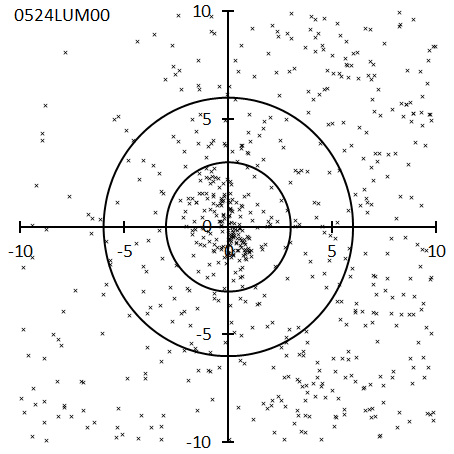
Figure 141 – Radiant point distribution map for the lambda-Ursae Majorids.
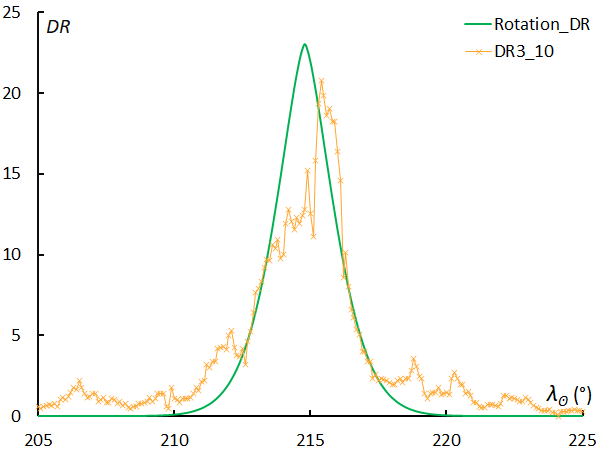
Figure 142 – Activity profile for the lambda-Ursae Majorids.
0526SLD: Southern lambda-Draconids
λʘ = 221.5°, λ–λʘ = 265.2°, β = 53.5°, α = 161.6°, δ = 68.0°, vg = 48.9 km/s.
Like 0524LUM, this activity was detected by combining observations from Croatia and SonotaCo net (Andreić et al., 2013). Although it is close to the active area of toroidal region such as 0387OKD and 0392NID, but LUM and SLD are not clearly seen in CMOR, and vice versa, OKD and NID are not clearly seen in the video. Although the orbit is similar both Jupiter family comet type, its plane intersects the ecliptic plane almost perpendicularly.
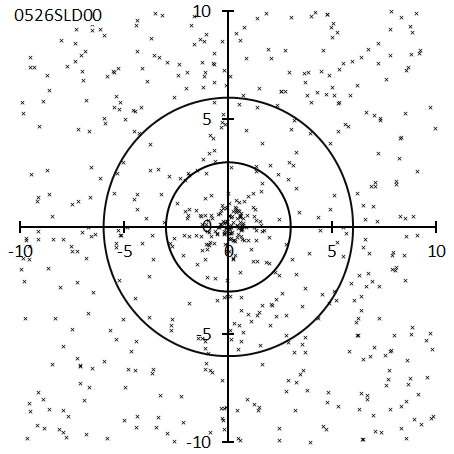
Figure 143 – Radiant point distribution map for the Southern lambda-Draconids.
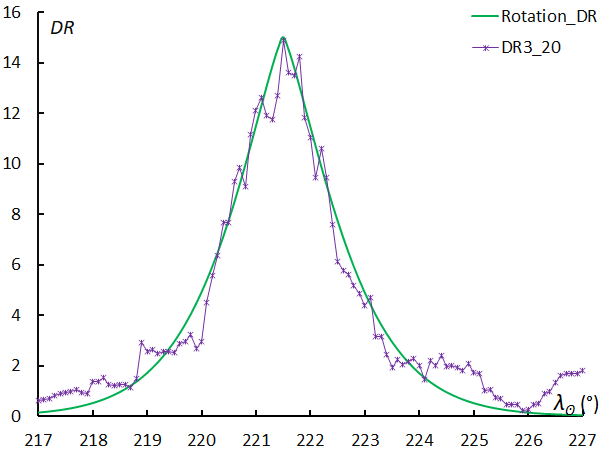
Figure 144 – Activity profile for the Southern lambda-Draconids.
0002STA_SF: Southern Taurids_SF
λʘ = 222.2°, λ–λʘ = 192.3°, β = –4.5°, α = 53.2°, δ = 14.5°, vg = 28.5 km/s.
We have discussed the details in Part II, “Meteor showers that need careful attention” (Koseki, 2024b) but we would like to reiterate that this is an activity that should be distinguished from STA_SE. In years when activity is strengthened, the number of meteors increases significantly. The radiant point distribution map in Figure 145 and activity curve in Figure 146 are mostly based on the activity in 2022, when the activity was enhanced.
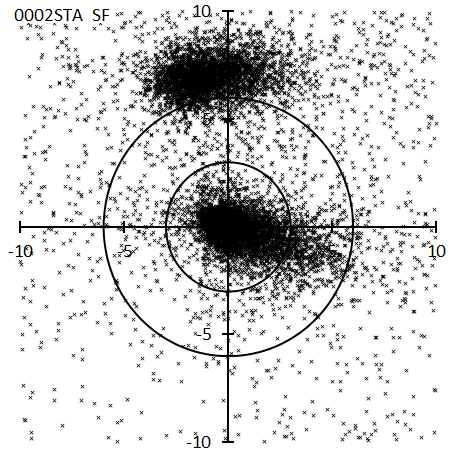
Figure 145 – Radiant point distribution map for the Southern Taurids_SF.
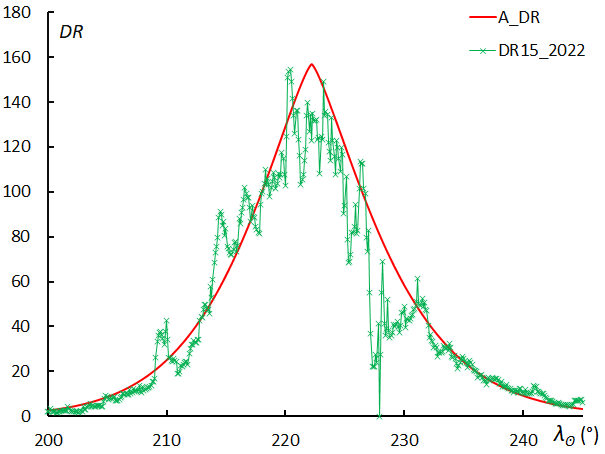
Figure 146 – Activity profile for the Southern Taurids_SF.
0445KUM: kappa-Ursae Majorids
λʘ = 222.8°, λ–λʘ = 268.0°, β = 29.7°, α = 144.4°, δ = 45.8°, vg = 64.8 km/s.
Although this meteor shower appeared in the first report of CAMS (Jenniskens et al, 2016a), there are no other reports in IAUMDCSD. Activities are stable every year, and the SonotaCo net J14 list and GMN list match well. It intersects the Earth’s orbit almost at perihelion, and its orbital inclination is high, so its activity period is short.
Figure 147 – Radiant point distribution map for the kappa-Ursae Majorids.
Figure 148 – Activity profile for the kappa-Ursae Majorids.
0338OER_DGE: omicron-Eridanids_ December delta-Eridanids
λʘ = 223°, λ–λʘ = 187.1°, β = –18.7°, α = 52.6°, δ = –0.3°, vg = 28.7 km/s.
0338OER00 was discovered by SonotaCo net (SonotaCo, 2009), and 0490DGE00 was detected by combining SonotaCo net and CAMS data (Rudawska, and Jenniskens, 2014). 0338OER appears to move its radiant point from the southern end of STA, as if branching out (Figure 149, top left is STA), and connect with 0490DGE01. After that, even weaker activity seems to extend southward, leading to 0709LCM. As mentioned in detail in Part II, “Meteor showers that need careful attention” (Koseki, 2024b), 0490DGE00 is part of this weak activity moving southward. DGE01 appears in the first report of CAMS (Jenniskens and Nénon, 2016c). Here we will only integrate OER and DGE, but this also includes 1115NXE00. Like the radiant distribution, the activity curve is unclear, and the maximum can only be seen in the range of λʘ = 215°~235° (Figure 150).
Figure 149 – Radiant point distribution map for the omicron-Eridanids_ December delta-Eridanids.
Figure 150 – Activity profile for the omicron-Eridanids_ December delta-Eridanids.
0018AND: Andromedids
λʘ = 224.5°, λ–λʘ = 165.9°, β = 18.2°, α = 21.2°, δ = 28.5°, vg = 18.1 km/s.
The Andromedids had an outburst in 2021, but its maximum was λʘ = 245.8°, a time when no activity is observed in normal years. However, the position of the radiant point at the time of a sudden event corresponds exactly to the extension of the radiant point shift in normal years (Koseki, 2022a). Table 7 in Part I (Koseki, 2024a) does not list the radiant points, etc. at the time of the outburst, so they are listed here: λʘ = 245.8°, λ–λʘ = 155.0°, β = 30.4°, α = 25.9°, δ = = 43.5°, vg = 15.4 km/s, e = 0.705, q = 0.864 A.U., i = 12.3°, ω = 225.5°, Ω = 245.8°, λΠ = 110.7°, βΠ = –8.7°, a = 2.93 A.U. Even in normal years, the activity profile is uneven, indicating that the distribution of meteoroids in orbit is uneven. The outburst in 2021 is probably an extreme example of a normal year activity. The SonotaCo net J14 list gives the active period as λʘ = 231.79°~232.48°, but the Andromedids are active for a much longer period. It is characteristic that the radiant point moves northward at a fairly high speed.
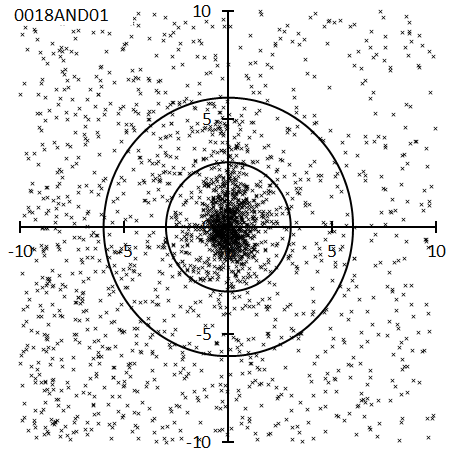
Figure 151 – Radiant point distribution map for the Andromedids.
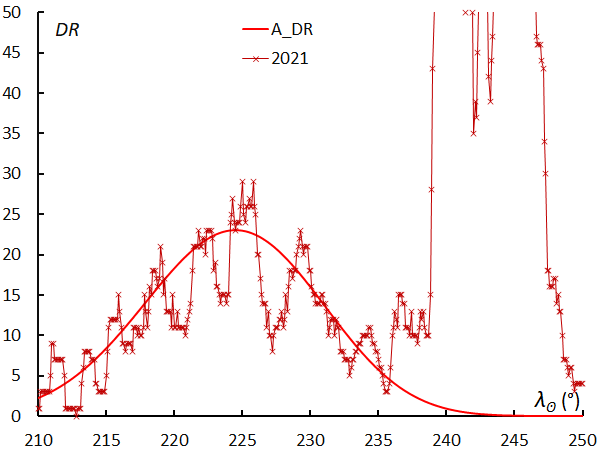
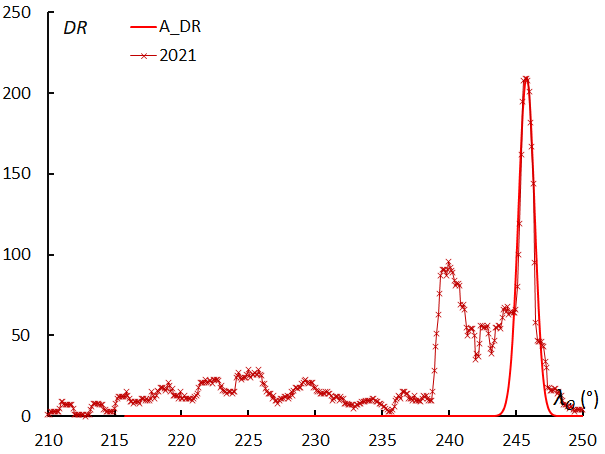
Figure 152 – Activity profile for the Andromedids, top, the usual annual activity, bottom with a DR scale to fit the 2021 peak.
0512RPU: rho-Puppids
λʘ = 226.2°, λ–λʘ = 269.6°, β = –43.5°, α = 125.1°, δ = –25.5°, vg = 57.5 km/s.
This is also an activity detected by combining observations from Croatia and the SonotaCo net (Šegon et al., 2013). The spread of the radiant points is somewhat large (Figure 153), and the activity curve is also uneven (Figure 154). It also appears that the maxima in 2021 and 2022 are different. The reason why the information obtained is ambiguous is because the period of activity is rather long, so the number of meteors per day is small compared to the total observed number of shower meteors.
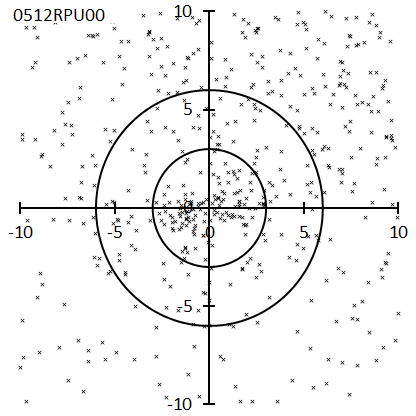
Figure 153 – Radiant point distribution map for the rho-Puppids.
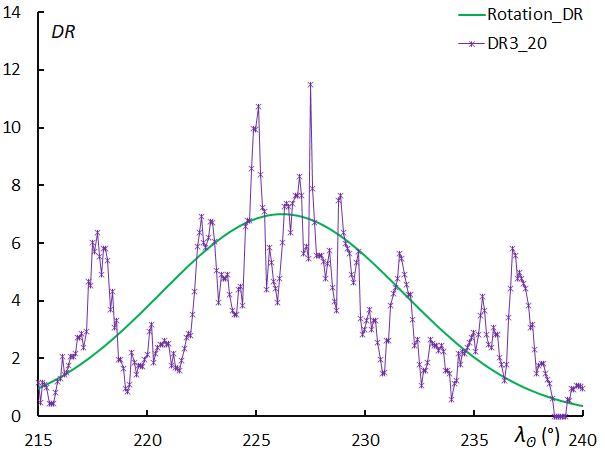
Figure 154 – Activity profile for the rho-Puppids.
0017NTA: Northern Taurids
λʘ = 226.5°, λ–λʘ = 192.1°, β = 2.4°, α = 55.8°, δ = 22.2°, vg = 28.3 km/s.
As mentioned in detail in Part II, “Meteor showers that need careful attention” (Koseki, 2024b) GMN subdivides NTA. Judging from the radiant distribution and activity profile in Figures 155 and 156, it is better to treat it as a single meteor shower activity. The dip in the activity profile around λʘ = 227.5° seems to be due to poor observation conditions for GMN in 2022 and is thought to be a sham.
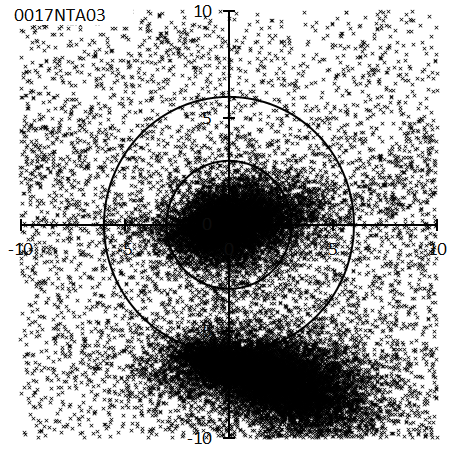
Figure 155 – Radiant point distribution map for the Northern Taurids.
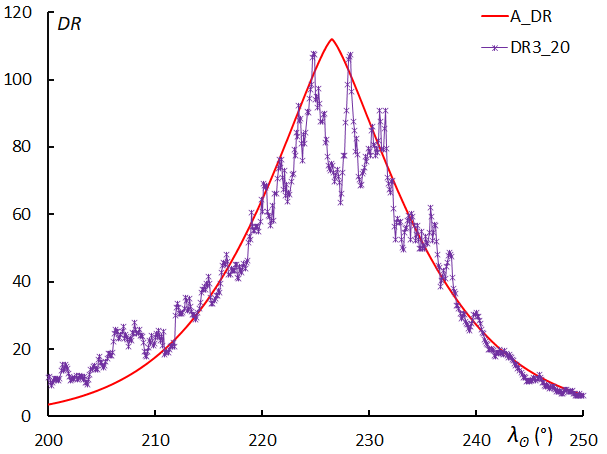
Figure 156 – Activity profile for the Northern Taurids.
0013LEO: Leonids
λʘ = 235.4°, λ–λʘ = 272.5°, β = 10.3°, α = 153.9°, δ = 21.8°, vg = 69.7 km/s.
In the activity profile, the peak at λʘ = 229° is a phenomenon unique to 2021, and the peak at λʘ = 239° is a phenomenon unique to DR3_10, which does not appear in other years or in other estimated curves. Overall, the trend appears to be roughly along the Rotation_DR curve.
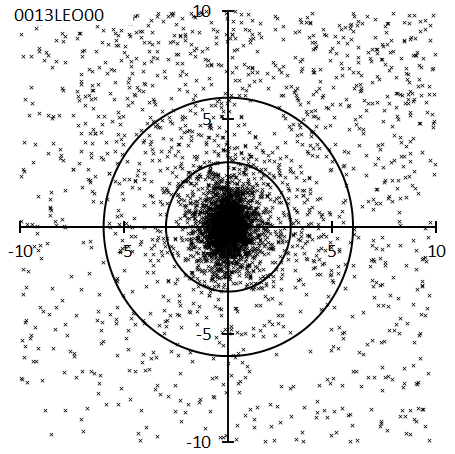
Figure 157 – Radiant point distribution map for the Leonids.
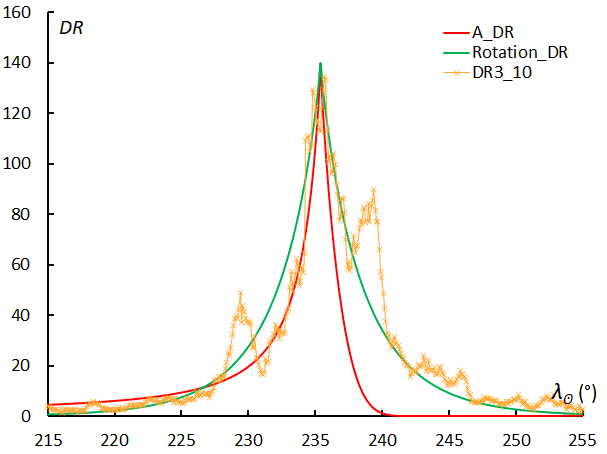
Figure 158 – Activity profile for the Leonids.
0394ACA: alpha-Canis Majorids
λʘ = 239.5°, λ–λʘ = 216.8°, β = –41.8°, α = 95.0°, δ = –18.5°, vg = 43.7 km/s.
This activity was detected by radar observation by CMOR2 (Brown et al., 2010). It was not mentioned in the previous article (Koseki, 2021) and is not on the SonotaCo net J14 list. In the radiant distribution, 0559MCB00 is on the lower left side of a circle with a radius of 3 degrees, and 0395GCM00 is on the upper right side of the circle. GCM is an observation of CMOR2 (Brown et al., 2010), but the radiant point distribution extends from the bottom left to the top right, so both MCB and GCM can be considered part of the ACA activity.
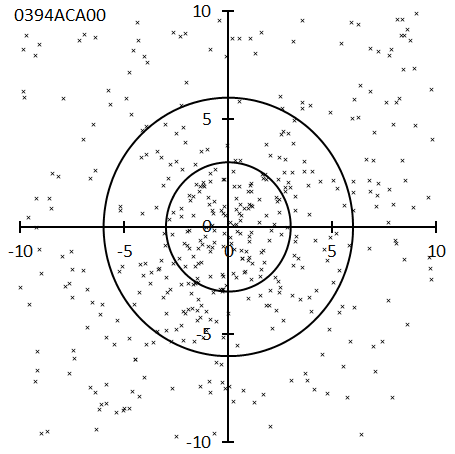
Figure 159 – Radiant point distribution map for the alpha-Canis Majorids.
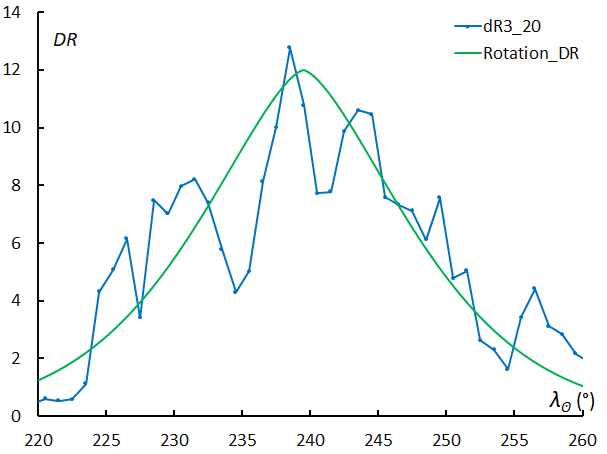
Figure 160 – Activity profile for the alpha-Canis Majorids.
0246AMO: alpha-Monocerotids
λʘ = 239.6°, λ–λʘ = 239.5°, β = –19.9°, α = 117.2°, δ = 0.8°, vg = 61.7 km/s.
After its sudden appearance in the United States in 1925 and India in 1935, AMO was not recorded in photographs or radio observations in the 1950s and 1960s and was not detected until it was observed in the United States in 1985; the detailed history is written by Jenniskens (2006) and Kronk (2013). After that, a sudden outbreak was seen in 1995 (Jenniskens et al., 1997), and a 10-year cycle of activity was expected, but since then no activity has been seen as expected. However, the widespread use of video observations has revealed that AMO activity is observed every year, albeit in small numbers. IAUMDCSD annotates the first photo observation report of AMO by DMS as “No reference”, but it should be supplemented with appropriate materials and classified as AMO00. AMO’s orbit has a period of several decades or more, and the 10-year period appears to be spurious due to the approach of the trail.
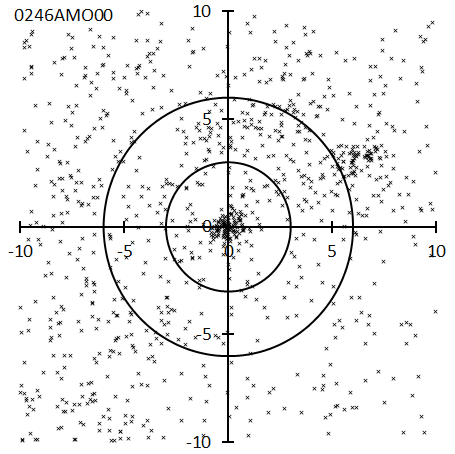
Figure 161 – Radiant point distribution map for the alpha-Monocerotids.
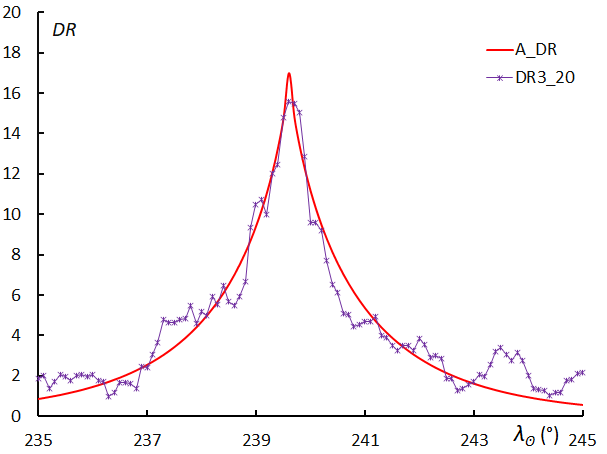
Figure 162 – Activity profile for the alpha-Monocerotids.
0488NSU: November sigma-Ursae Majorids
λʘ = 241.7°, λ–λʘ = 245.1°, β = 43.2°, α = 148.9°, δ = 59.4°, vg = 54.4 km/s.
This meteor shower was detected by combining SonotaCo net and CAMS data (Rudawska and Jenniskens, 2014). Although the period of activity is short, the radiant points are well clustered and show stable activity every year. 0527UUM00 should be included in NSU.
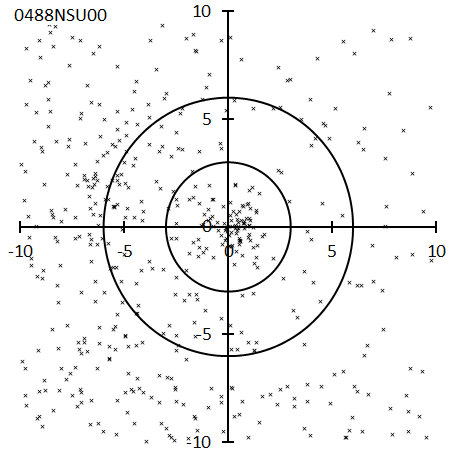
Figure 163 – Radiant point distribution map for the November sigma-Ursae Majorids.
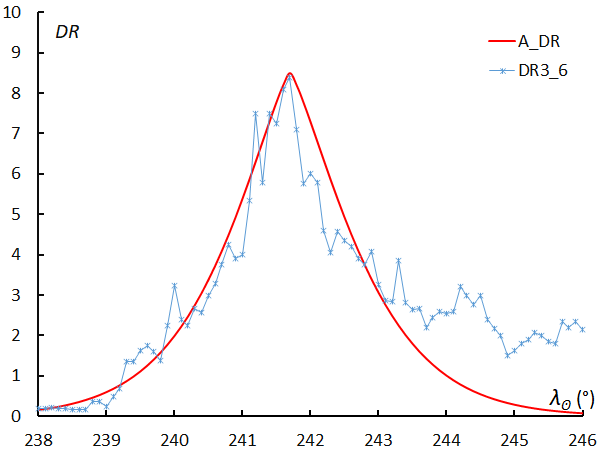
Figure 164 – Activity profile for the November sigma-Ursae Majorids.
0250NOO: November Orionids
λʘ = 246.1°, λ–λʘ = 204.0°, β = –7.9°, α = 90.1°, δ = 15.5°, vg = 42.9 km/s.
0019MON appears in the lower left of Figure 165. This activity has been known since the days of visual and photographic observation, and was sometimes collectively referred to as the “Monocerotids” together with the MON (Sekanina, 1976). It seems that NOO and MON began to be clearly distinguished after Jenniskens’s famous book (Jenniskens, 2006). The activity profile is asymmetric, with a faster decline in the second half.
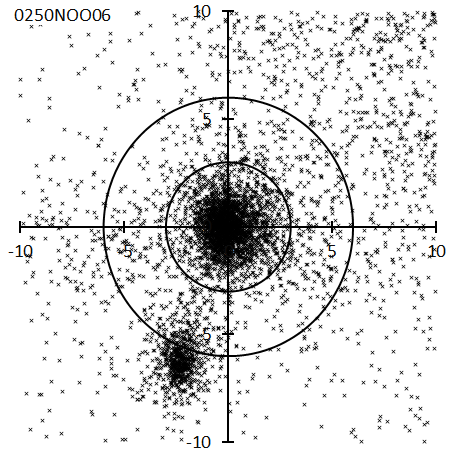
Figure 165 – Radiant point distribution map for the November Orionids.
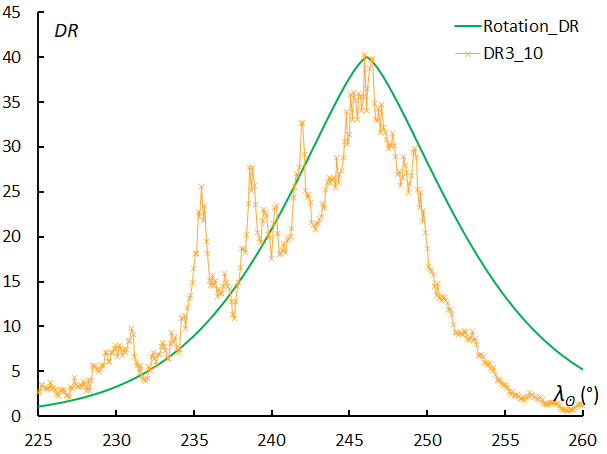
Figure 166 – Activity profile for the November Orionids.
0257ORS: Southern chi-Orionids
λʘ = 246.2°, λ–λʘ = 190.1°, β = –4.7°, α = 75.6°, δ = 18.0°, vg = 27.4 km/s.
Although the current IAUMDCSD number is missing, the classification 0014XOR (χ-Orionids) has existed since the Harvard photographic observation. Since Lindblad’s survey of the meteor shower, it has been divided into northern and southern branches (Lindblad, 1971), and Jenniskens gave them the codes 0256ORN and 0257ORS (Jenniskens, 2006). ORS is barely distinguishable from STA, as seen in the radiant distribution and activity profile in Figures 167 and 168, but ORN has not been confirmed. In the J14 list of SonotaCo net, it is treated as part of STA, and in GMN, the end of its activities is considered as long as λʘ = 275.2°.
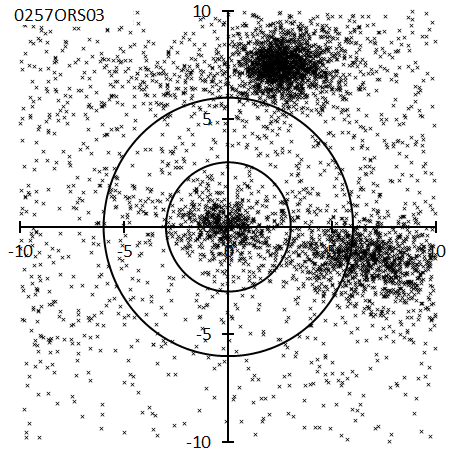
Figure 167 – Radiant point distribution map for the Southern chi-Orionids.
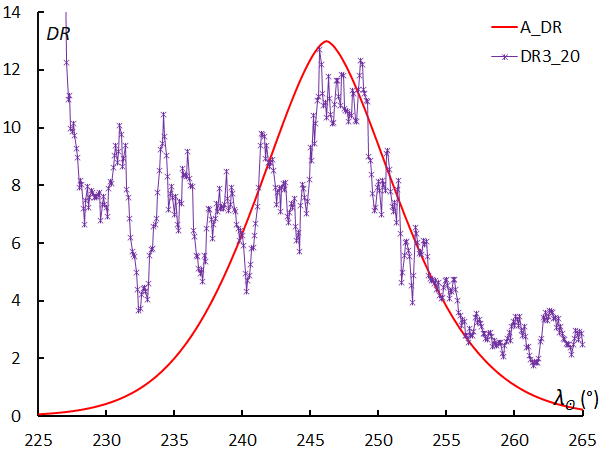
Figure 168 – Activity profile for the Southern chi-Orionids.
1096NAC: November alpha-Corvids
λʘ = 246.5°, λ–λʘ = 286.2°, β = –20.5°, α = 165.0°, δ = –16.0°, vg = 66.6 km/s.
This is a new meteor shower appearing for the first time in IAMDCSD with the third CAMS report (mentioned ‘2022 submitted’ in the IAUMDCSD). Naturally, it was not mentioned in the previous article (Koseki, 2021), and it is not on SonotaCo net J14 list or GMN. The upper right of the radiant distribution is the Apex region (Figure 169), and NAC can barely be distinguished from its activity.
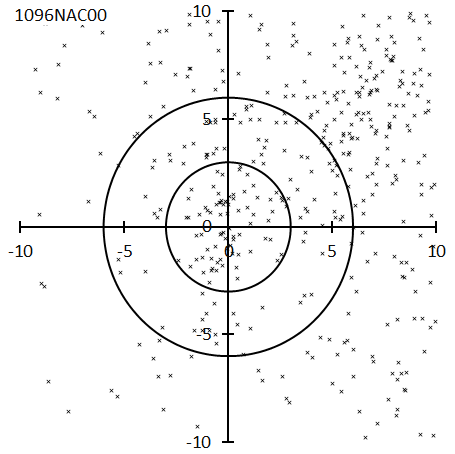
Figure 169 – Radiant point distribution map for the November alpha-Corvids.
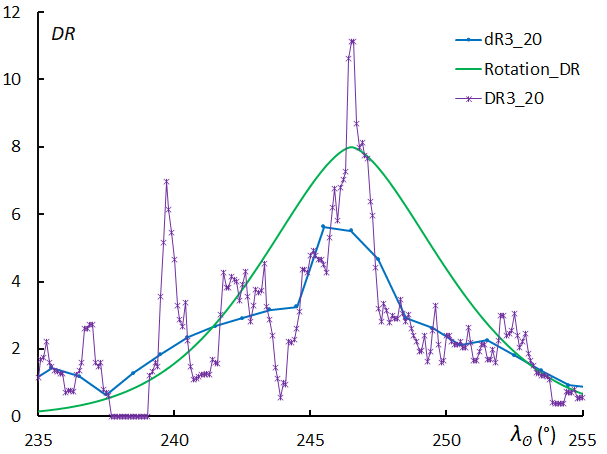
Figure 170 – Activity profile for the November alpha-Corvids.
0340TPY_0: theta-Pyxidids
λʘ = 249.4°, λ–λʘ = 261.2°, β = –39.3°, α = 138.3°, δ = –25.5°, vg = 60.1 km/s.
The group was detected by the SonotaCo network (SonotaCo, 2009), but as detailed in Part II, “Meteor showers that need careful attention” (Koseki, 2024b), there is confusion at IAUMDCSD, and two activities are in TPY. Here, they are distinguished as TPY_0 and TPY_1. It should be noted that GMN considers this activity to be DTP.
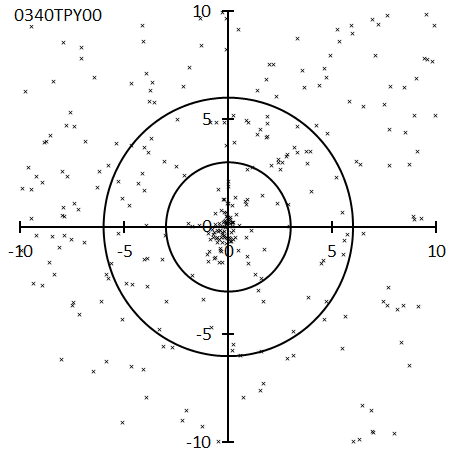
Figure 171 – Radiant point distribution map for the theta-Pyxidids.
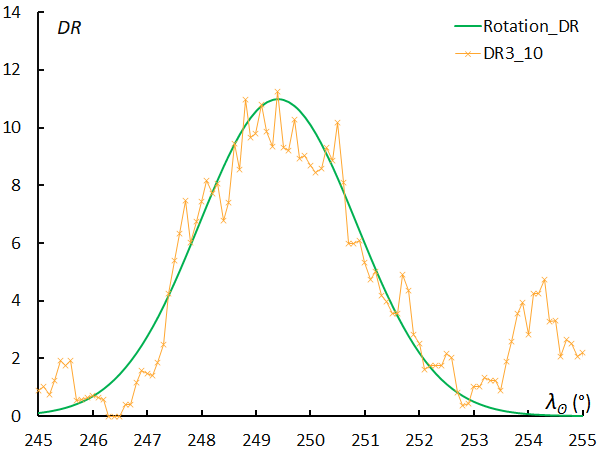
Figure 172 – Activity profile for the theta-Pyxidids.
0336DKD: December kappa-Draconids
λʘ = 251°, λ–λʘ = 243.0°, β = 61.5°, α = 186.1°, δ = 70.5°, vg = 43.8 km/s.
DKD was detected by SonotaCo net observations (SonotaCo, 2009). This activity was originally listed as KDR when it was published in WGN, but IAUMDCSD gave the CMOR2 observation (Brown et al., 2010) the name 0380KDR and designated this activity as 0336DKD. It should be noted that the J14 of the SonotaCo net remains KDR.
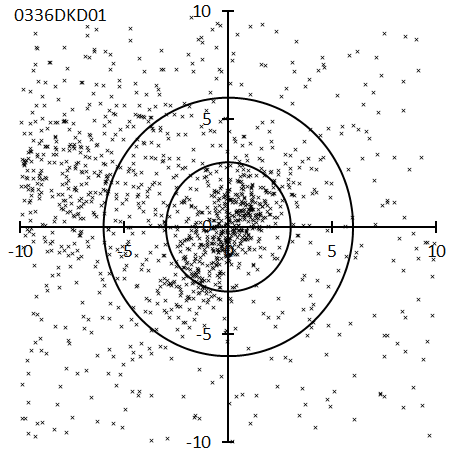
Figure 173 – Radiant point distribution map for the December kappa-Draconids.
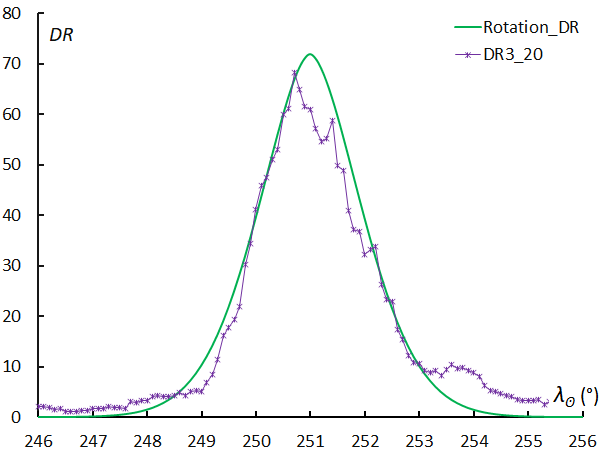
Figure 174 – Activity profile for the December kappa-Draconids.
0339PSU: psi-Ursae Majorids
λʘ = 251.5°, λ–λʘ = 258.0°, β = 35.6°, α = 168.1°, δ = 44.2°, vg = 60.9 km/s.
This is also an activity detected by SonotaCo net observations (SonotaCo, 2009). GMN typically observed more meteors in 2022 than in 2021, but the number of PSU meteors in 2021 is 1.6 times that of 2022. Similarly, the SonotaCo net observations used in the previous paper showed large fluctuations in activity from year to year (Koseki, 2021), and whether there is any periodicity is a point of interest for future observations.
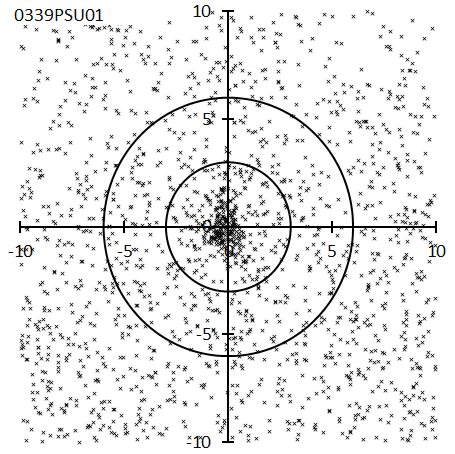
Figure 175 – Radiant point distribution map for the psi-Ursae Majorids.
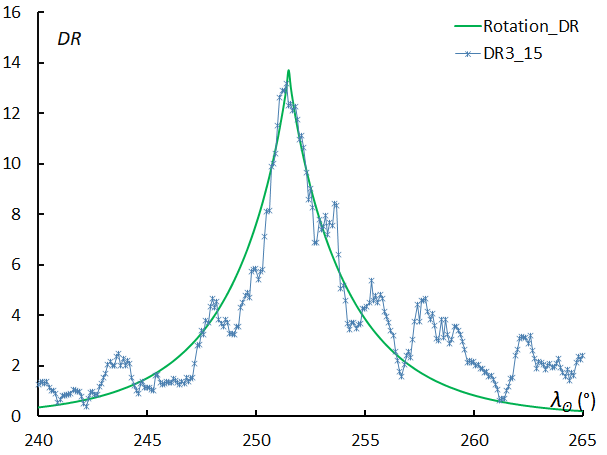
Figure 176 – Activity profile for the psi-Ursae Majorids.
0334DAD: December alpha-Draconids
λʘ = 253.5°, λ–λʘ = 264.2°, β = 62.7°, α = 204.6°, δ = 62.2°, vg = 40.6 km/s.
This activity was also first detected by SonotaCo net (SonotaCo, 2009). The radiant points are spreading, and the activity profile is also widening. In the radiant distribution in Figure 177, 0392NID01 is on the left inner side of the circle with a radius of 3 degrees, and 0392NID00 is on the slightly outer left side of the circle with a radius of 6 degrees. NID is considered a “to be established shower” by IAUMDCSD, but there is room for consideration. If the radiant shift is not considered, DAD03 and 0753NED00 will be sandwiched between NID00 and NID01. There are many unknowns about DAD’s activities, and it may be broken down into several parts.
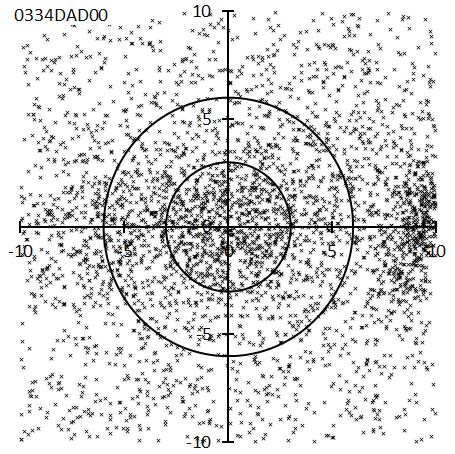
Figure 177 – Radiant point distribution map for the December alpha-Draconids.
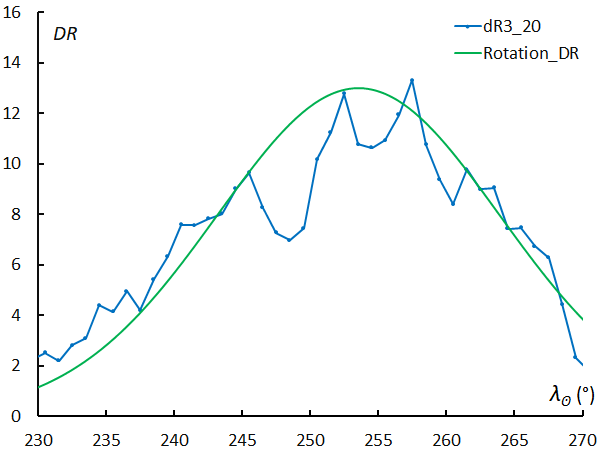
Figure 178 – Activity profile for the December alpha-Draconids.
0016HYD: sigma-Hydrids
λʘ = 255.4°, λ–λʘ = 231.0°, β = –16.5°, α = 124.7°, δ = 2.7°, vg = 58.8 km/s.
Despite its radiant distribution and activity profile are very clear, it was unknown until it was detected in photographic observations at Harvard (McCrosky and Posen, 1961). The earliest visual observation of NMS (The Nippon Meteor Society) was in 1961 (Koseki, 1971). The magnitude ratio is not particularly low (Koseki, 2023), so it is not a meteor shower suitable for photography or video. According to visual observations, this level of activity corresponds to HR=1–2, which means visual observers will miss it if they are not careful.
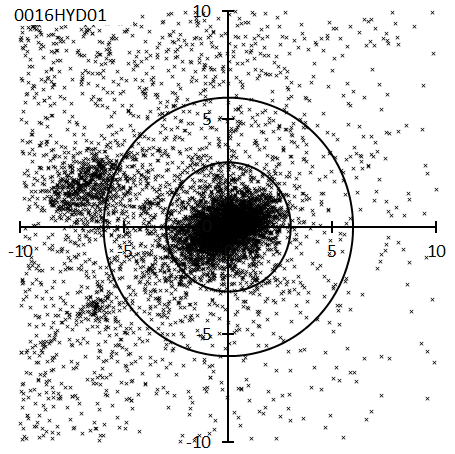
Figure 179 – Radiant point distribution map for the sigma-Hydrids.
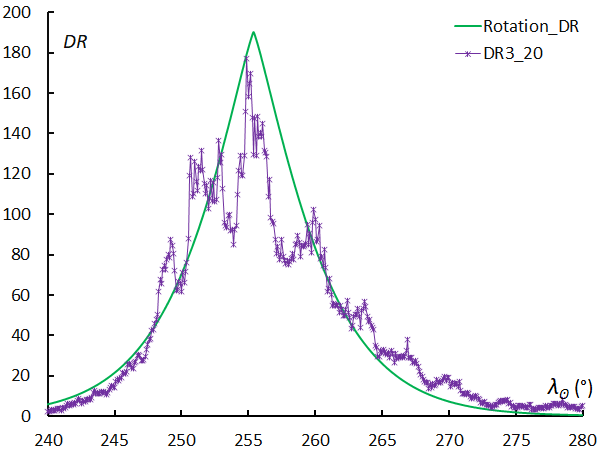
Figure 180 – Activity profile for the sigma-Hydrids.
0502DRV: December rho-Virginids
λʘ = 255.6°, λ–λʘ = 286.0°, β = 15.0°, α = 187.5°, δ = 13.1°, vg = 68.2 km/s.
This meteor shower was detected by combining SonotaCo net and CAMS data (Rudawska and Jenniskens, 2014). 1116NFL00 should be included in DRV. The period of activity for this meteor shower is shorter in the SonotaCo net J14 list, and longer in GMN.
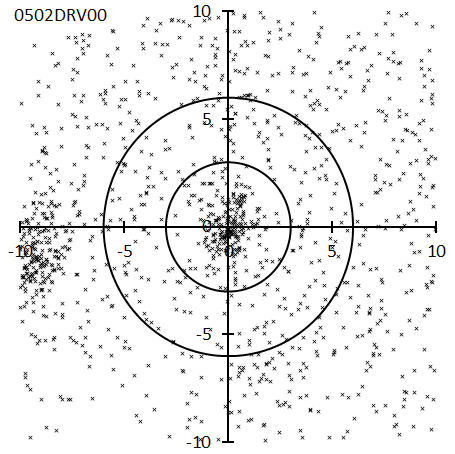
Figure 181 – Radiant point distribution map for the December rho-Virginids.
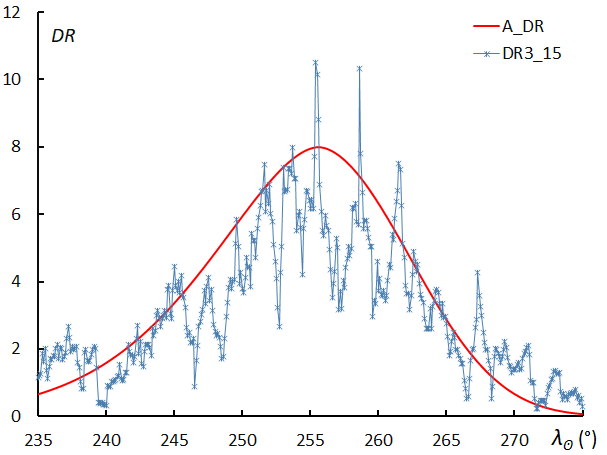
Figure 182 – Activity profile for the December rho-Virginids.
0529EHY: eta-Hydrids
λʘ = 256.2°, λ–λʘ = 237.8°, β = –14.8°, α = 132.2°, δ = 2.4°, vg = 62.1 km/s.
This is also an activity detected by combining the SonotaCo net and Croatian observations (Šegon et al., 2013). Looking at the number of meteors themselves, the maxima in 2021 and 2022 are λʘ = 252.3° and λʘ = 263.3°, respectively, a difference of 10 degrees. This is probably due to differences in observation conditions, not changes in activity itself. However, even in the observation of the SonotaCo net used in the previous paper (Koseki, 2021), the maximum is not clear, and it would be better to think of the maximum as being in the range of λʘ = 255° to 265°.
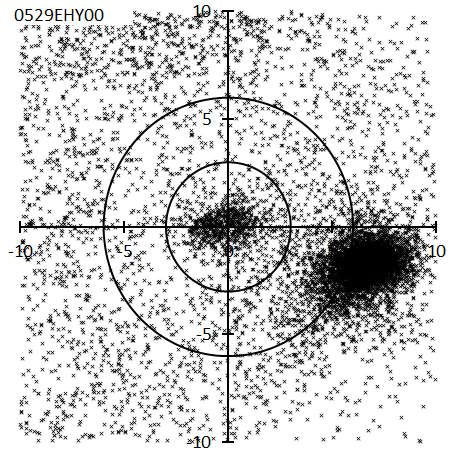
Figure 183 – Radiant point distribution map for the eta-Hydrids.
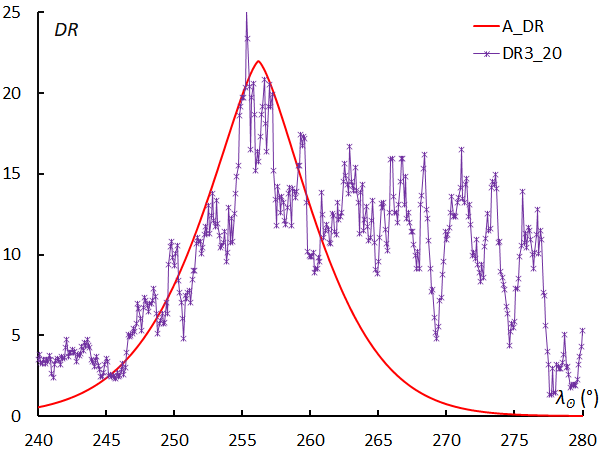
Figure 184 – Activity profile for the eta-Hydrids.
0255PUV: Puppid-Velid I Complex
λʘ = 256.5°, λ–λʘ = 268.3°, β = –61.6°, α = 134.7°, δ = –49.2°, vg = 41.6 km/s.
During this period, the following activities are expected in this area: 0255PUV, 0300ZPU, 0301PUP00, 0302PVE00, and 0746EVE00. As seen in the radiant distribution in Figure 185, the radiants are diffuse and the location is difficult to observe from the Northern Hemisphere, so future observations from the Southern Hemisphere are expected. When they will develop successfully, there may be a debate as to whether the name PUV is appropriate. PUV was set by Jenniskens from visual observations in the Southern Hemisphere (Jenniskens, 2006), but IAUMDCSD has made it a candidate for deletion due to insufficient data. Although it was not mentioned in the previous article (Koseki, 2021), it is listed as EVE in the SonotaCo net J14 list and in GMN.
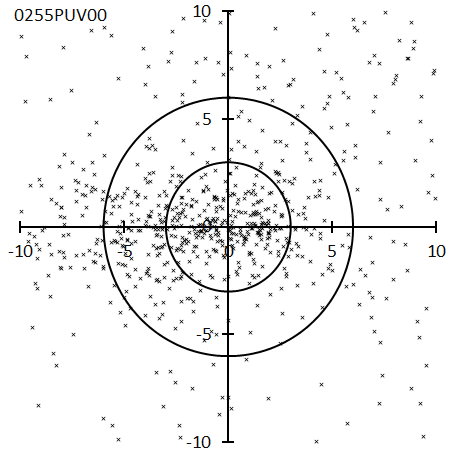
Figure 185 – Radiant point distribution map for the Puppid-Velid I Complex.
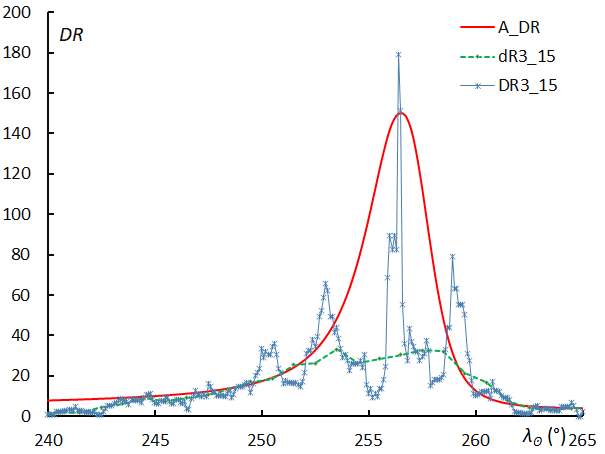
Figure 186 – Activity profile for the Puppid-Velid I Complex.
0019MON: December Monocerotids
λʘ = 258.1°, λ–λʘ = 202.5°, β = –14.8°, α = 100.4°, δ = 8.3°, vg = 41.4 km/s.
Though the first report of MON came from small cameras at Harvard (Whipple, 1954), it is relatively new that this MON has come to be clearly distinguished from the NOO located above the MON in Figure 187. Although the activity is stable from year to year, the difference in maximum is Δλʘ = 12°, and the positions are close to each other as shown in the radiant distribution, so it is difficult to distinguish them by visual observation.
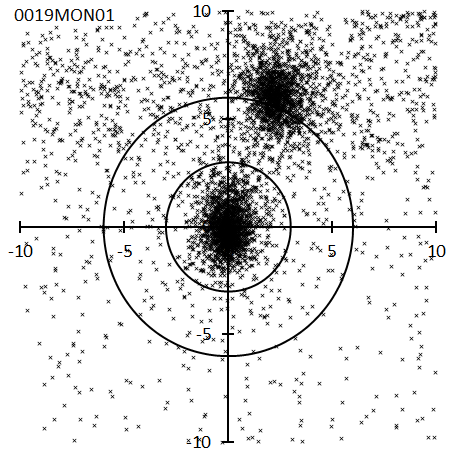
Figure 187 – Radiant point distribution map for the December Monocerotids.
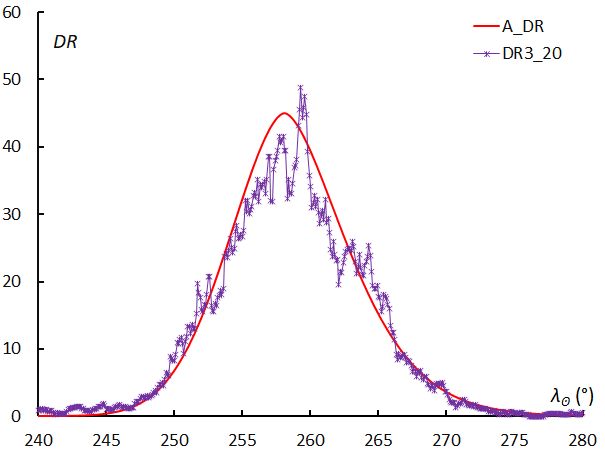
Figure 188 – Activity profile for the December Monocerotids.
0004GEM: Geminids
λʘ = 261.85°, λ–λʘ = 208.0°, β = 10.5°, α = 113.3°, δ = 32.4°, vg = 33.8 km/s.
As shown in Figure 190, the activity profile is asymmetric, and after the maximum, the activity quickly stops. The first report of CAMS (Jenniskens et al., 2016a) claims that there is an activity called 0641DRG00 whose radiant point almost coincides with GEM, and whose geocentric velocity is about 5 km/s faster than GEM, but there is no confirmed report. 0390THA is a confirmed group of IAUMDCSD and is also described in GMN, but it is difficult to distinguish it from the earliest activity of GEM. In the previous SonotaCo net settings (J5; used in SonotaCo data before 2019), the late activity was long enough to include 0644JLL and 0747JKL, but in the J14 list, it was up to λʘ = 265.38°. GMN lists JLL’s activity period as λʘ = 246.8°~280.2°, which is different from λʘ = 288° (or λʘ = 288.1°) published in IAUMDCSD. The radiant points from THA to JLL and JKL follow the radiant drift of GEM, and it remains to be seen whether they are related to the activities of GEM.
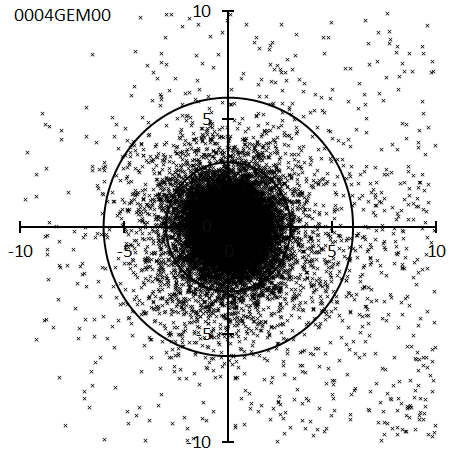
Figure 189 – Radiant point distribution map for the Geminids.
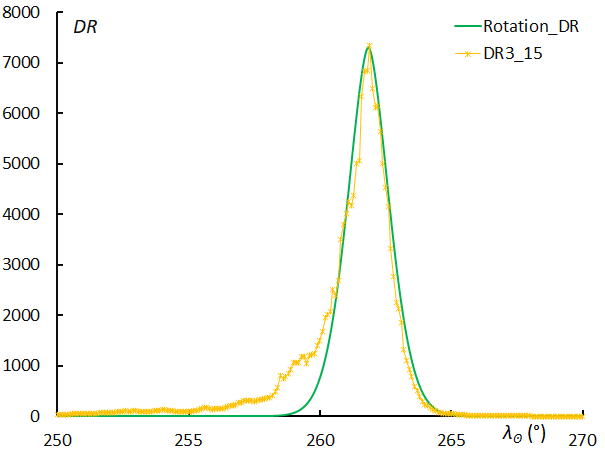
Figure 190 – Activity profile for the Geminids.
0335XVI: December chi-Virginids
λʘ = 262.8°, λ–λʘ = 291.6°, β = –5.2°, α = 191.3°, δ = –10.5°, vg = 68.1 km/s.
XVI was first detected through observations by the SonotaCo net (SonotaCo, 2009). However, there is a report from SonotaCo net of 1117NEV00, which can be the initial activity of XVI. Although the radiant points are well concentrated, the activity profile is not clear, and the maximum is not clear. The unevenness of the activity curve in Figure 192 is due to changes in activity from year to year.
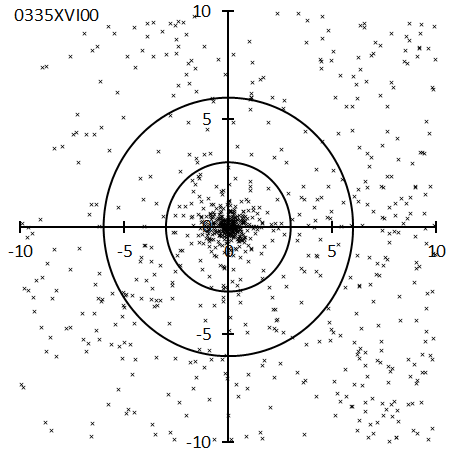
Figure 191 – Radiant point distribution map for the December chi-Virginids.
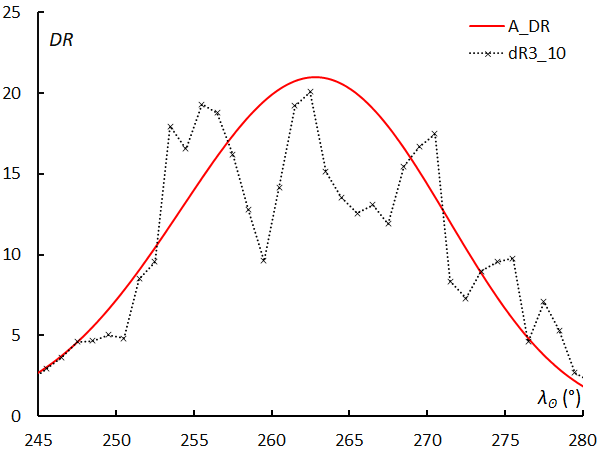
Figure 192 – Activity profile for the December chi-Virginids.
0497DAB: December alpha-Bootids
λʘ = 263.1°, λ–λʘ = 298.1°, β = 32.6°, α = 212.1°, δ = 21.9°, vg = 59.4 km/s.
This meteor shower was detected by combining SonotaCo net and CAMS data (Rudawska and Jenniskens, 2014). The two protrusions in the activity profile are due to the difference of the maximum in the solar longitudes in 2021 and 2022.
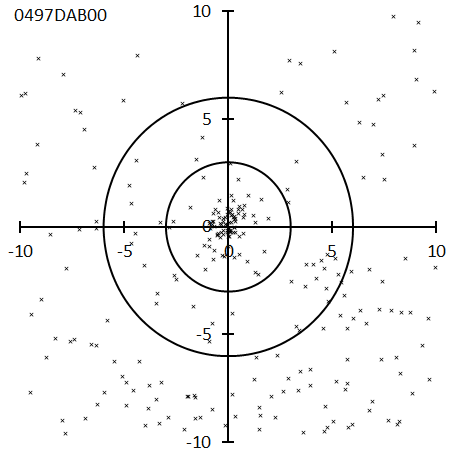
Figure 193 – Radiant point distribution map for the December alpha-Bootids.
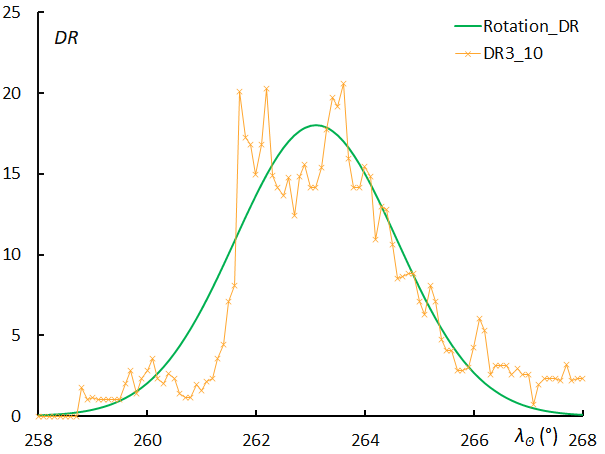
Figure 194 – Activity profile for the December alpha-Bootids.
0340TPY_1: theta-Pyxidids
λʘ = 264.3°, λ–λʘ = 259.6°, β = –32.9°, α = 152.0°, δ = –23.9°, vg = 63.0 km/s.
This activity was detected in CAMS’s first report (Jenniskens et al., 2016b). As mentioned in Part II, “Meteor showers that need careful attention” (Koseki, 2024b), for more details, confusion arose because it was classified as TPY. It should have been given a different name instead of the already existing TPY. GMN calls this TPY, but it would be appropriate to call it DMH, just like the SonotaCo net J14 list. However, if CAMS suggests another name for TPY01, it is better to use that name.
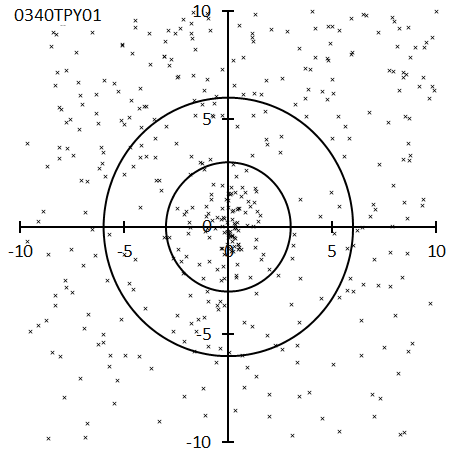
Figure 195 – Radiant point distribution map for the theta-Pyxidids.
Figure 196 – Activity profile for the theta-Pyxidids.
0020COM: Comae Berenicids
λʘ = 267.5°, λ–λʘ = 242.9°, β = 21.1°, α = 161.0°, δ = 30.9°, vg = 62.8 km/s.
“Comae Berenicids” here includes 0020COM, 0032DLM, 0090JCO, and 0506FEV. FEV is classified as a definite group, but it is an extension of the radiant drift of the “Comae Berenicids” and cannot be distinguished even on the activity profile. FEV is not treated as an independent activity in the SonotaCo net J14 list but is a separate group in GMN. Considering the location of the radiant point and the maximum solar longitude, December Leonis Minorids (DLM) is a more appropriate name.
Figure 197 – Radiant point distribution map for the Comae Berenicids.
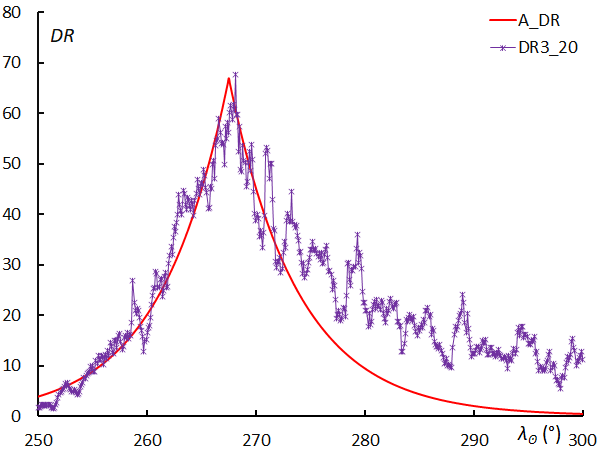
Figure 198 – Activity profile for the Comae Berenicids.
0015URS: Ursids
λʘ = 270.65°, λ–λʘ = 218.8°, β = 72.1°, α = 219.4°, δ = 75.4°, vg = 33.1 km/s.
After a sudden burst of activity in 1945 (Ceplecha, 1951), high activity in 1986 and 2000 is well known (Kronk, 2013). Irregular activity has been observed since then. Currently, annual activities are captured by video observations, and subtle changes in the solar longitude of the maximum and radiant point are also observed from year to year.
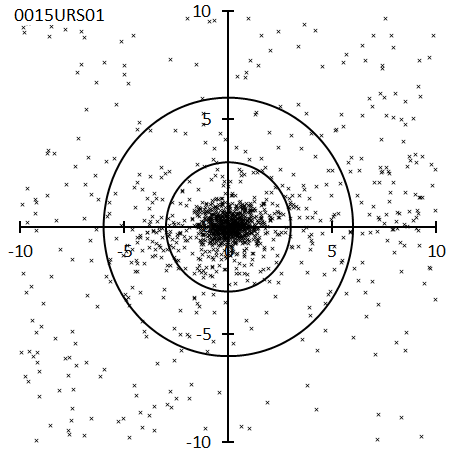
Figure 199 – Radiant point distribution map for the Ursids.
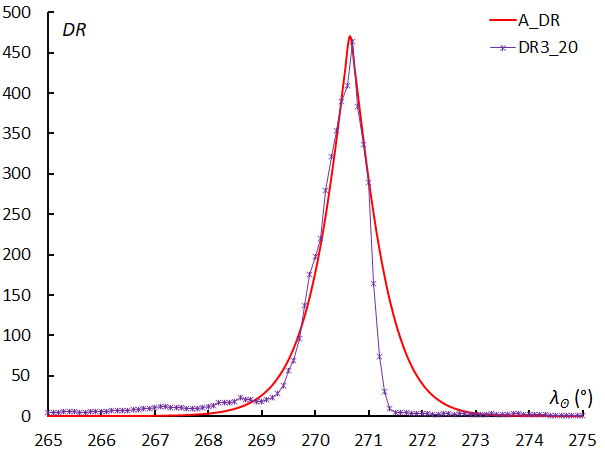
Figure 200 – Activity profile for the Ursids.
0428DSV: December sigma-Virginids
λʘ = 271.5°, λ–λʘ = 293.4°, β = 15.0°, α = 208.5°, δ = 4.4°, vg = 66.1 km/s.
0513EPV00, 0500JPV00~02, and 1124HTV00 are included in this activity. DSV was discovered by British researcher Greaves (2012) using data from the SonotaCo net, and EPV was reported the following year in a study using observations from Croatia and data from the SonotaCo net (Šegon et al., 2013). Although it is not clear because the number of meteors per night is not large, the solar ecliptic longitude at the maximum seems to differ depending on the year. In the SonotaCo net J14 list, DSV and JPV are included in EPV, and in GMN these are unified as DSV.
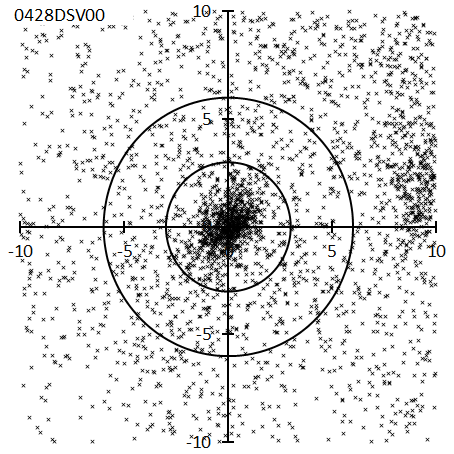
Figure 201 – Radiant point distribution map for the December sigma-Virginids.
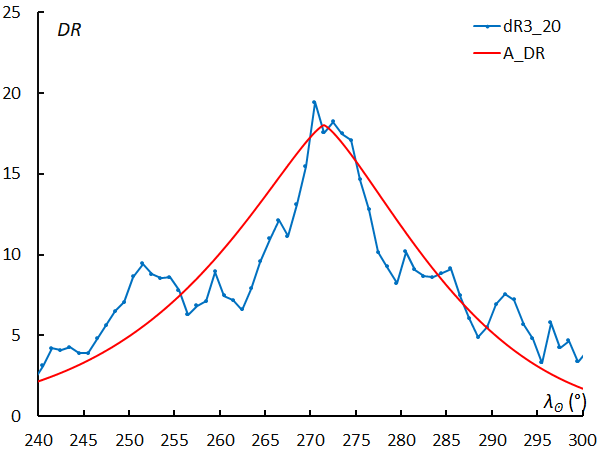
Figure 202 – Activity profile for the December sigma-Virginids.
0784KVE: kappa-Velids
λʘ = 274.9°, λ–λʘ = 259.4°, β = –59.6°, α = 142.3°, δ = –50.5°, vg = 43.3 km/s.
It was detected by SAAMER (Pokorný et al., 2017), an Argentine meteor radar, and no subsequent observations have been reported. Including 0255PUV, there is an active area of radiant points in the region around λ–λʘ = 250°–280° and β = –60° during the period of λʘ = 240°–280°. Future observations in the Southern Hemisphere are expected to show how they can be classified and organized. It was not mentioned in the previous article (Koseki, 2021) and is not in the SonotaCo net J14 list.
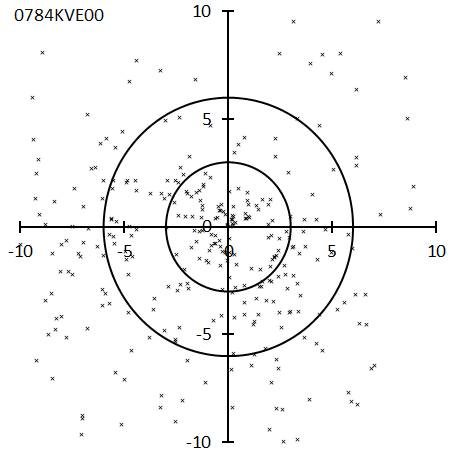
Figure 203 – Radiant point distribution map for the kappa-Velids.
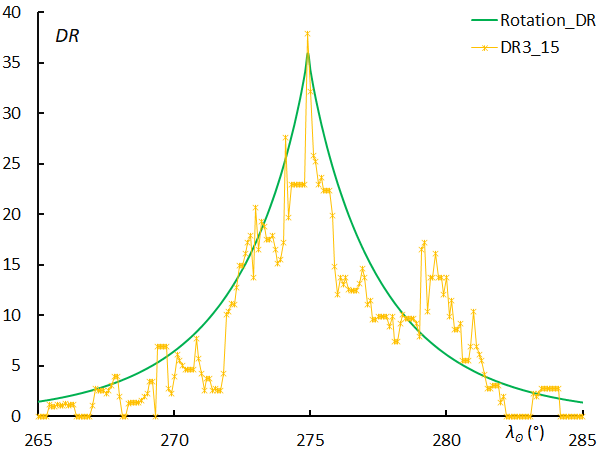
Figure 204 – Activity profile for the kappa-Velids.
0319JLE: January Leonids
λʘ = 281.6°, λ–λʘ = 219.5°, β = 10.2°, α = 147.0°, δ = 24.1°, vg = 51.9 km/s.
This meteor shower was detected by radar observation by CMOR1 (Brown et al., 2008). Even in CMOR images, the radiant points are clustered small, similarly in the radiant point distribution map in Figure 205, only the small cluster near the center is KVE, and the surrounding radiant points are probably sporadic meteors. The actual activity profile may be much sharper than the estimated curve shown in Figure 206.
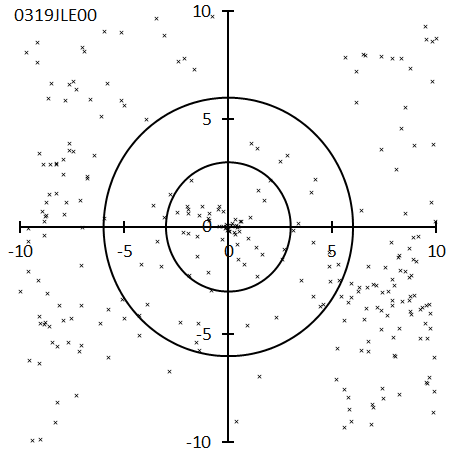
Figure 205 – Radiant point distribution map for the January Leonids.
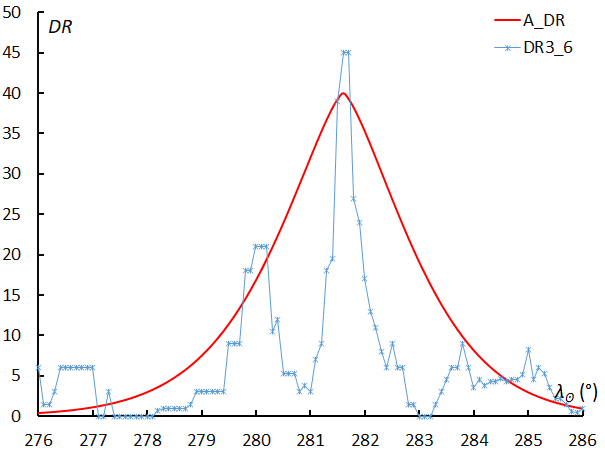
Figure 206 – Activity profile for the January Leonids.
0010QUA: Quadrantids
λʘ = 283.25°, λ–λʘ = 276.7°, β = 63.8°, α = 230.0°, δ = 49.7°, vg = 40.4 km/s.
The radiant point distribution is unique, extending in a heart shape to the upper right and lower upper left. The same result was obtained from SonotaCo net observations, so this seems to be a feature of QUA (Koseki, 2021). The activity curve is asymmetric, and weak activity with a gradual peak can be seen around λʘ = 287°, which is the same result as the SonotaCo net data. However, GMN defines the activity of QUA as λʘ < 285°.
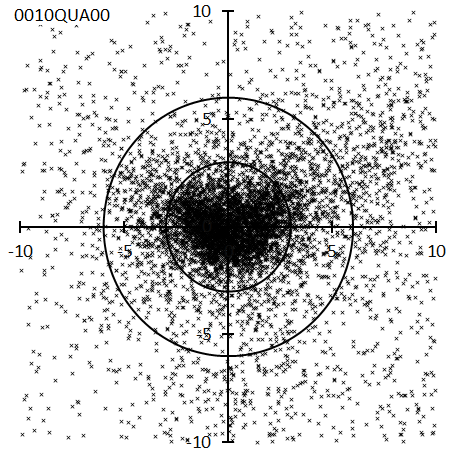
Figure 207 – Radiant point distribution map for the Quadrantids.
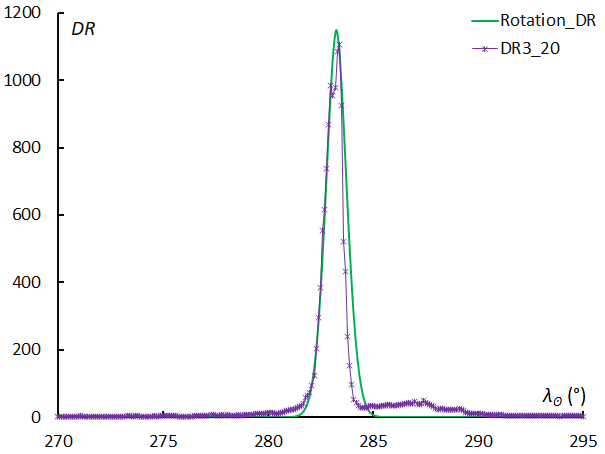
Figure 208 – Activity profile for the Quadrantids.
0331AHY: alpha-Hydrids
λʘ = 283.8°, λ–λʘ = 207.9°, β = –26.2°, α = 127.1°, δ = –8.0°, vg = 43.6 km/s.
This meteor shower was discovered by radar observation by CMOR1 (Brown et al., 2008), but it is also well captured by video observations. Compared to 0319JLE, which was also discovered in CMOR1, AHY seems to be a meteor shower suitable for video observation. There is no clear maximum seen in the CMOR image, and even in the activity profile in Figure 210, the activity during the period λʘ = 280° to 286° is at almost the same level.
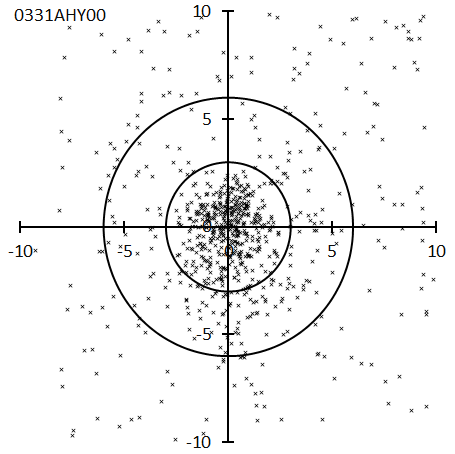
Figure 209 – Radiant point distribution map for the alpha-Hydrids.
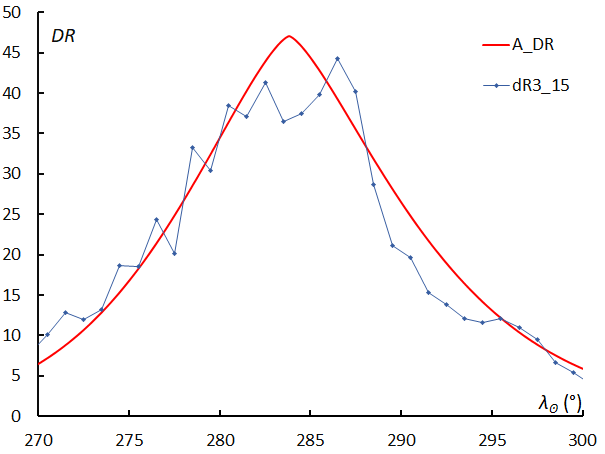
Figure 210 – Activity profile for the alpha-Hydrids.
0515OLE: omicron-Leonids
λʘ = 288.3°, λ–λʘ = 209.2°, β = –7.3°, α = 137.7°, δ = 8.6°, = 46.5 km/s.
Table 2 – Three similar meteor showers.
| Code | λʘ | λ–λʘ | b | vg |
| 0643OLS00 | 287 | 209.3 | –7.4 | 44.9 |
| 0793KCA00 | 289 | 208.5 | –7 | 47.3 |
| 0515OLE00 | 296 | 208 | –6.9 | 41.5 |
In the previous article (Koseki, 2021), we covered this activity as 0515OLE, so this time we will continue to use that name. However, as shown in Table 2, there are three similar activities in the same area. The distribution of the geocentric velocity for meteors within 3 degrees from the OLE radiant with λʘ = 285°~295° is shown in Figure 213. When we investigated the activity above and below vg = 44.5 (km/s), we found that the results were more consistent for vg > 44.5 (km/s). The radiant distribution and activity profile shown in Figures 211 and 212 are the results of regression analysis for meteors vg > 44.5 (km/s). In the radiant distribution, those within 3 degrees from the center and with vg > 44.5 (km/s) are marked with a circle. Although the results for vg < 44.5 (km/s) were similar, they were not as clear-cut. The three activities in Table 2 seem to represent the same meteor shower, but OLS and KCA seem to represent the activity a little better. The SonotaCo net J14 list uses KCA, and GMN lists OLE and KCA.
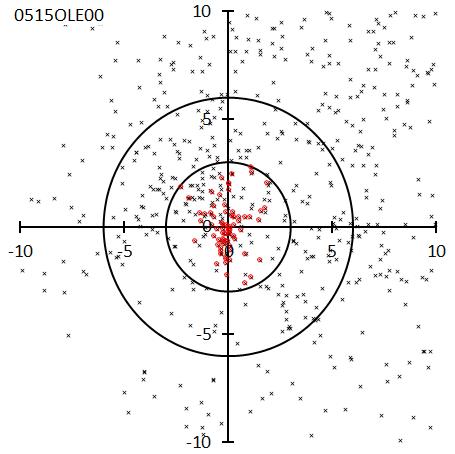
Figure 211 – Radiant point distribution map for the omicron-Leonids. Radiants with vg > 44.5 km/s are marked in red.
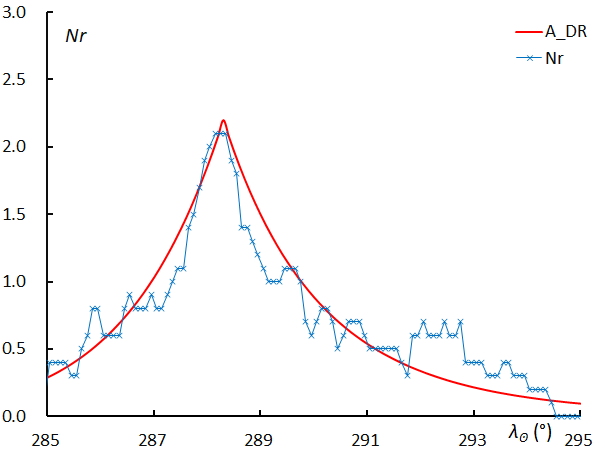
Figure 212 – Activity profile for the omicron-Leonids.
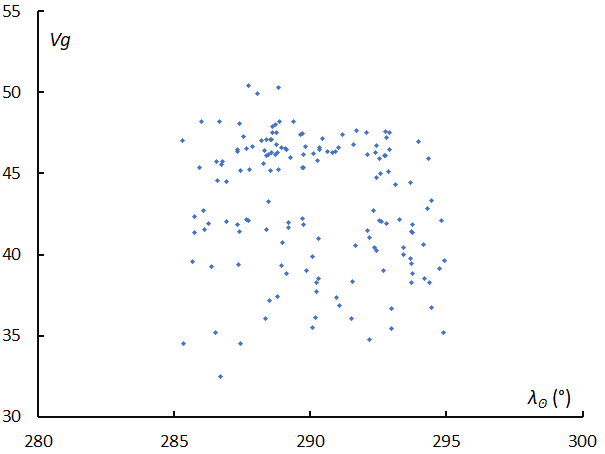
Figure 213 – Distribution of the geocentric velocity for meteors within 3 degrees from the OLE radiant with λʘ = 285°~295°.
0323XCB: xi-Coronae Borealids
λʘ = 294.8°, λ–λʘ = 307.3°, β = 50.8°, α = 250.2°, δ = 29.3°, vg = 45.4 km/s.
0321TCB, 0322LBO, and 0323XCB are all meteor showers detected by CMOR1 radio observations (Brown et al., 2008). Although TCB and LBO are more active in radar observations, video observations show that TCB and LBO are buried in sporadic meteor activity. XCB is probably better suited for video observations. In the previous article (Koseki, 2021), only XCB was mentioned, but none of them are listed in the SonotaCo net J14 list. LBO and XCB are listed on GMN. Activity seems to change from year to year, and the unevenness of the activity profile is thought to be due to this.
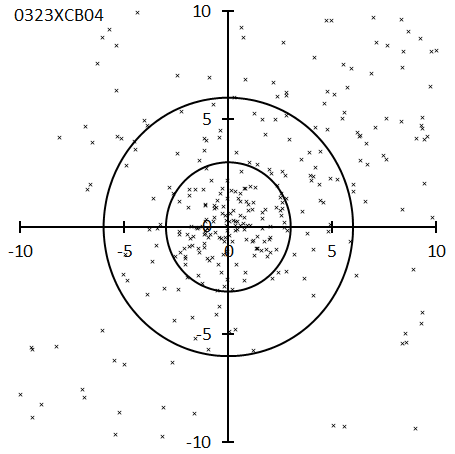
Figure 214 – Radiant point distribution map for the xi-Coronae Borealids.
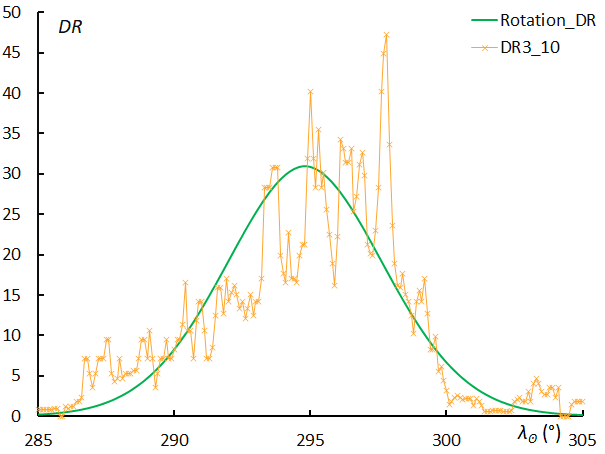
Figure 215 – Activity profile for the xi-Coronae Borealids.
0341XUM: January xi-Ursae Majorids
λʘ = 298.6°, λ–λʘ = 218.1°, β = 25.8°, α = 169.5°, δ = 32.8°, vg = 41.0 km/s.
This activity was first detected through observations by the SonotaCo net (SonotaCo, 2009). More than half of the data used was observed in 2023, so the activity profile can be said to represent the activity in 2023. The radiant point distribution by the SonotaCo net in the previous paper (Koseki, 2021), is also downward sloping. The direction of the radiant drift is also downward to the right, but the distribution in Figure 216 takes the radiant shift into consideration, and this shape is probably a characteristic of XUM.
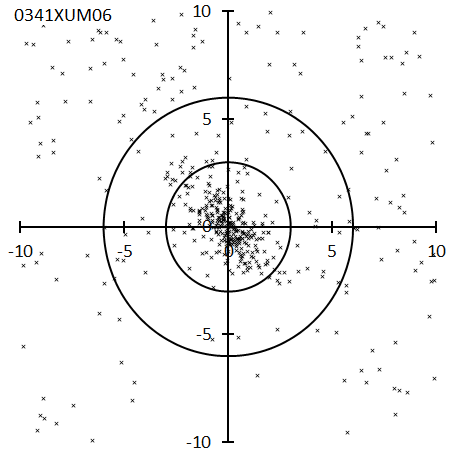
Figure 216 – Radiant point distribution map for the January xi-Ursae Majorids.
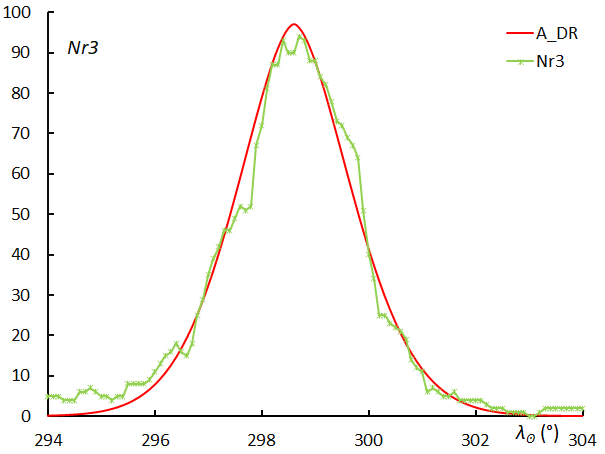
Figure 217 – Activity profile for the January xi-Ursae Majorids.
0404GUM: gamma-Ursae Minorids
λʘ = 299.8°, λ–λʘ = 218.8°, β = 74.5°, α = 229.7°, δ = 67.3°, vg = 29.4 km/s.
This activity was detected by CMOR2 radar observations (Brown et al., 2010) but is also well captured by video observations. Although it was active on the same scale and around the same time as XUM, it was unknown until the observations of CMOR2 were analyzed. Although GUM activity is not clear in SonotaCo net observations from 2007 to 2009, its existence is clearly recognized in observations since 2010. This is a meteor shower that was not covered in the previous article (Koseki, 2021), and changes in its activity will be of interest in the future.
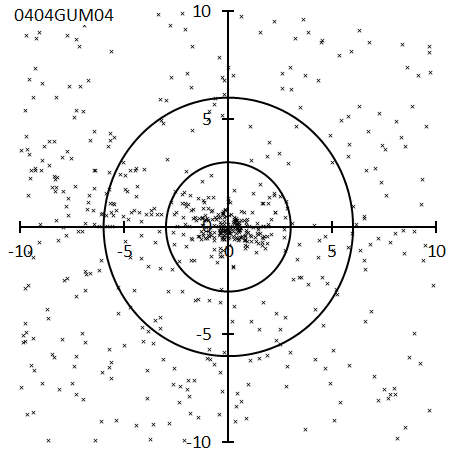
Figure 218 – Radiant point distribution map for the gamma-Ursae Minorids.
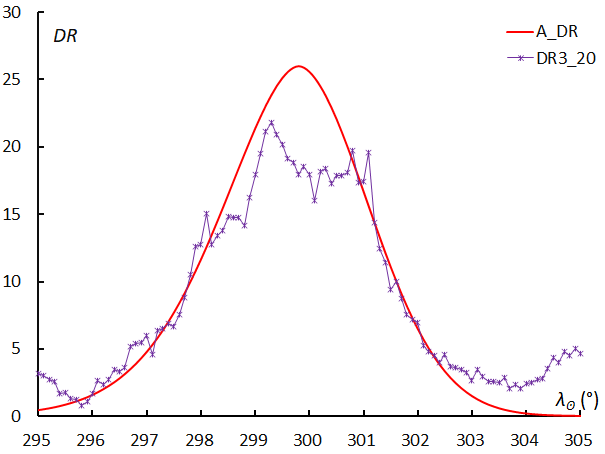
Figure 219 – Activity profile for the gamma-Ursae Minorids.
0429ACB: alpha-Coronae Borealids
λʘ = 307.5°, λ–λʘ = 271.4°, β = 44.7°, α = 231.3°, δ = 27.9°, vg = 57.2 km/s.
ACB was discovered by British researcher Greaves (2012) using data from the SonotaCo net. A characteristic of this meteor shower is the large asymmetry of the activity profile (Figure 221), which reaches its maximum soon after the start of activity, and then gradually declines in activity.
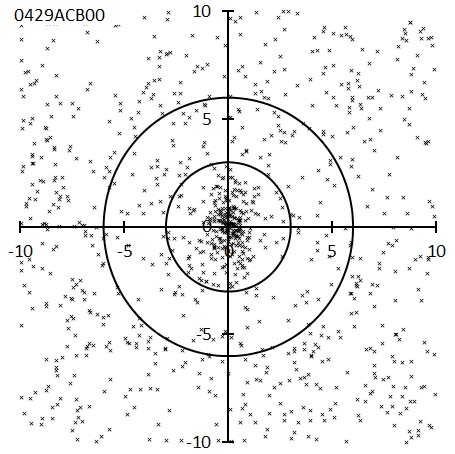
Figure 220 – Radiant point distribution map for the alpha-Coronae Borealids.
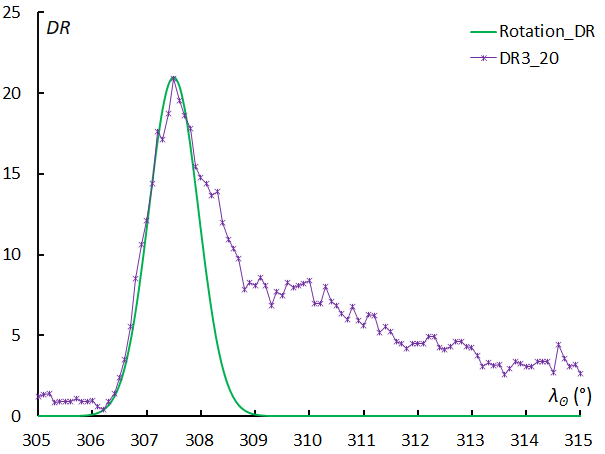
Figure 221 – Activity profile for the alpha-Coronae Borealids.
0110AAN: alpha-Antliids
λʘ = 312.5°, λ–λʘ = 211.0°, β = –17.4°, α = 158.1°, δ = –9.6°, vg = 43.9 km/s.
This meteor shower was detected by AMOR radar observations (Galligan and Baggaley, 2002). After that, it remained conspicuous in radar observations of CMOR1 and CMOR2 (Brown et al., 2008, 2010), but confirmation by video observation was delayed. This meteor shower is not listed in the SonotaCo net J14 list. Looking at the CMOR image, 0405MHY is visible on the southeast side. In the radiant distribution in Figure 222, MHY is located at the bottom left of AAN, but it is not as clear as in radar observations.
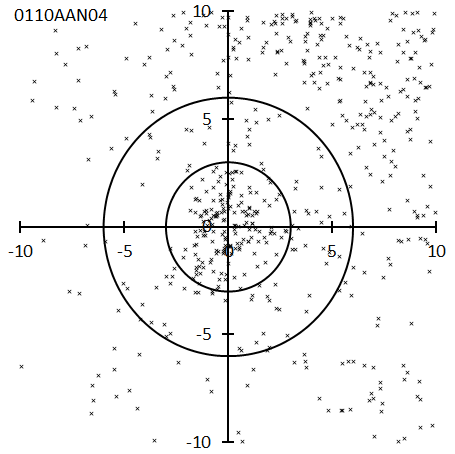
Figure 222 – Radiant point distribution map for the alpha-Antliids.
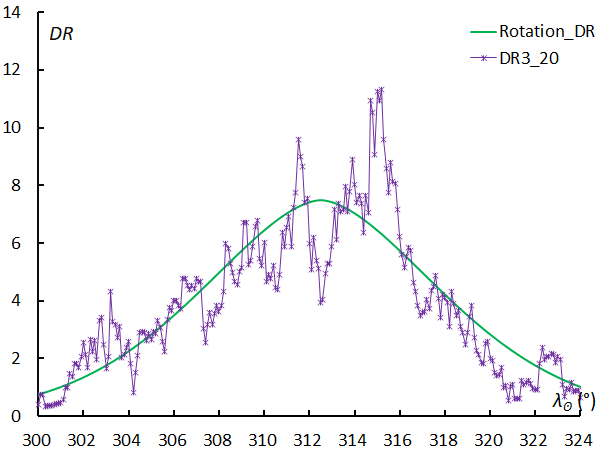
Figure 223 – Activity profile for the alpha-Antliids.
0427FED: February eta-Draconids
λʘ = 314.84°, λ–λʘ = 230.6°, β = 76.0°, α = 239.3°, δ = 61.8°, vg = 35.2 km/s.
The first report was that six meteors were captured by CAMS on February 4, 2011 (Jenniskens and Gural, 2011). Even in the activity profile in Figure 225, the half-width is approximately half a day, and it is difficult to capture unless the observation time coincides with the maximum. This activity is not in the SonotaCo net J14 list and was not mentioned in the previous article (Koseki, 2021).
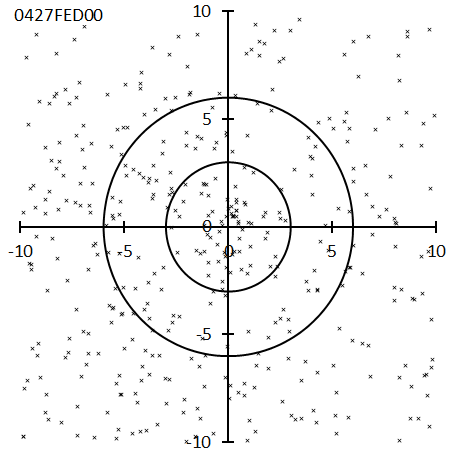
Figure 224 – Radiant point distribution map for the February eta-Draconids.
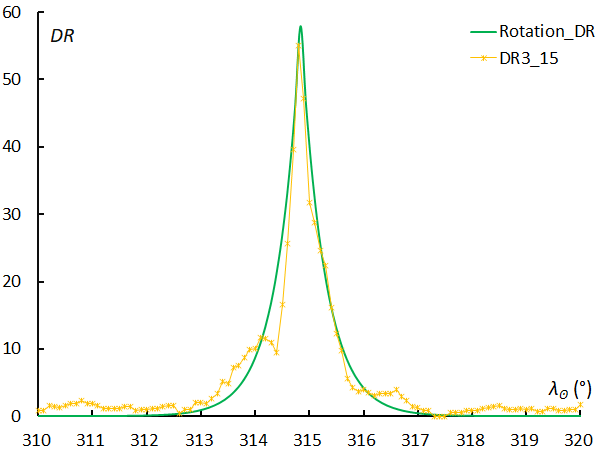
Figure 225 – Activity profile for the February eta-Draconids.
1032FHY: February Hydrids
λʘ = 325.4°, λ–λʘ = 160.7°, β = –18.9°, α = 123.9°, δ = 0.4°, vg = 16.1 km/s.
The first record was a preliminary report that 17 meteors were captured by CAMS between February 9 and 17, 2018 (Jenniskens et al., 2018a). It was not mentioned in the previous article (Koseki, 2021), and it is not in the SonotaCo net J14 list or GMN. The radiant points are well concentrated and the maximum is clear. Considering the location of the radiant and the geocentric velocity, the spatial density of meteoroids seems to be quite high.
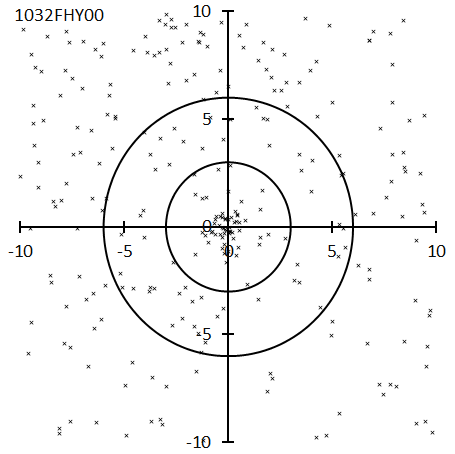
Figure 226 – Radiant point distribution map for the February Hydrids.
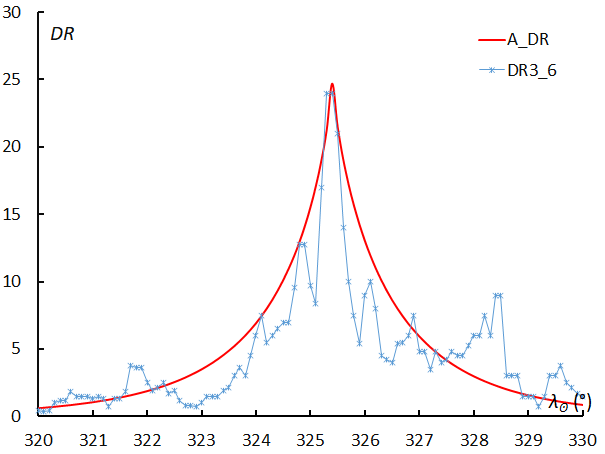
Figure 227 – Activity profile for the February Hydrids.
1166TTR: theta-Trianguli Australids
λʘ = 332.1°, λ–λʘ = 285.4°, β = –43.9°, α = 247.0°, δ = –66.4°, vg = 56.3 km/s.
This is a new meteor shower that appeared in the third CAMS report (mentioned ‘2022 submitted’ in the IAUMDCSD). It was not mentioned in the previous article (Koseki, 2021), and it is not in the SonotaCo net J14 list or GMN. The total number of meteors observed by GMN is only 34, of which 28 were in 2023. Future progress in observation in the Southern Hemisphere is expected. From the trends in the raw number of meteors in 2023, it appears that the activity profile might be asymmetrical, with a rapid decline after the peak.
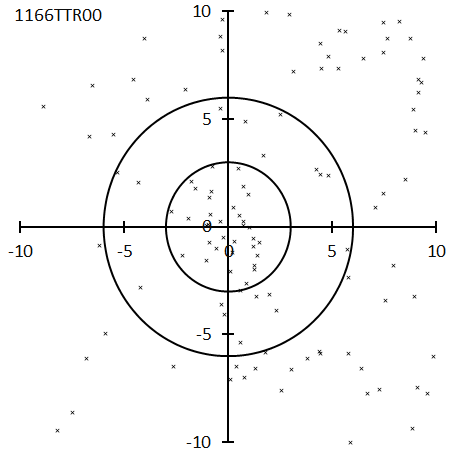
Figure 228 – Radiant point distribution map for the theta-Trianguli Australids.
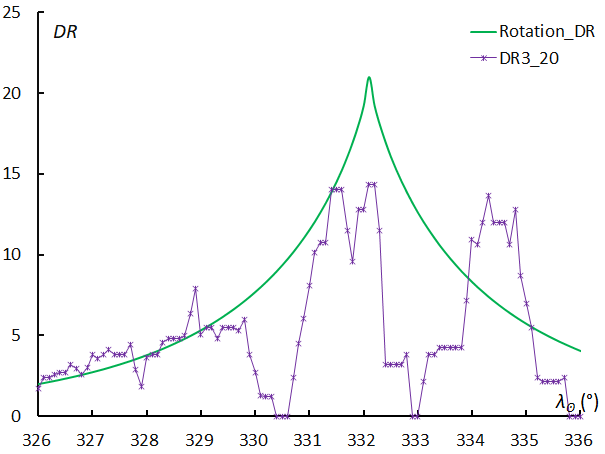
Figure 229 – Activity profile for the theta-Trianguli Australids.
0915DNO: delta-Normids
λʘ = 334.2°, λ–λʘ = 271.5°, β = –24.9°, α = 237.8°, δ = –45.7°, vg = 66.7 km/s.
This meteor shower appeared in the second CAMS report (Jenniskens et al., 2018b). It was not mentioned in the previous article (Koseki, 2021) and is not in the SonotaCo net J14 list, but GMN has it listed. This is also a southern meteor shower, with 33 out of 46 observed in 2023, indicating progress in observation in the Southern Hemisphere.
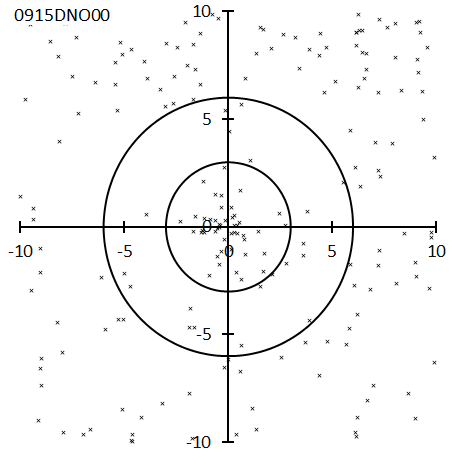
Figure 230 – Radiant point distribution map for the delta-Normids.
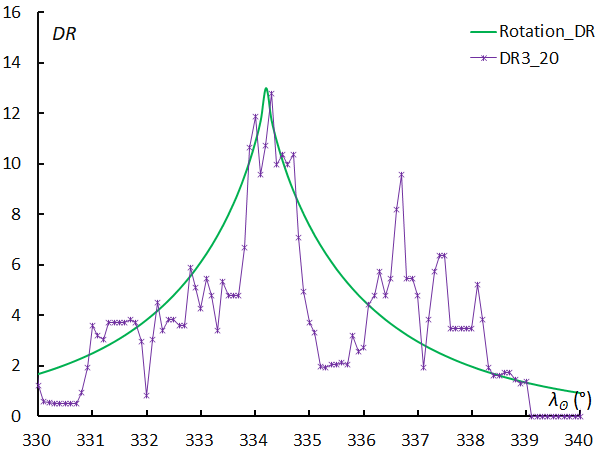
Figure 231 – Activity profile for the delta-Normids.
0571TSB: 26-Bootids
λʘ = 343.7°, λ–λʘ = 220.8°, β = 36.7°, α = 216.7°, δ = 24.6°, vg = 49.4 km/s.
This activity was detected by combining observations from Croatia and the SonotaCo net (Andreić et al., 2014). This activity was not covered in the previous article (Koseki, 2021). Although the number of meteors obtained was small (55), the activity profile is clear. It is also listed in the SonotaCo net J14 list and GMN. Setting the active period as λʘ = 342.73°~ 343.46° in J14 is probably too short.
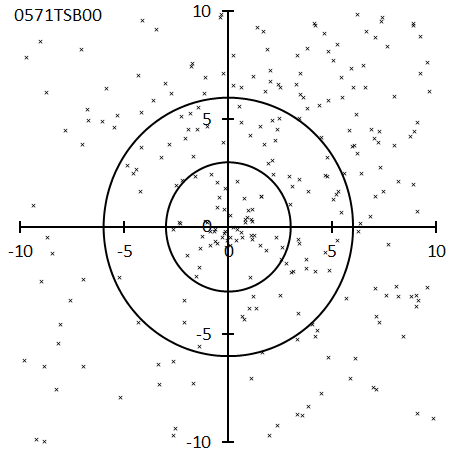
Figure 232 – Radiant point distribution map for the 26-Bootids.
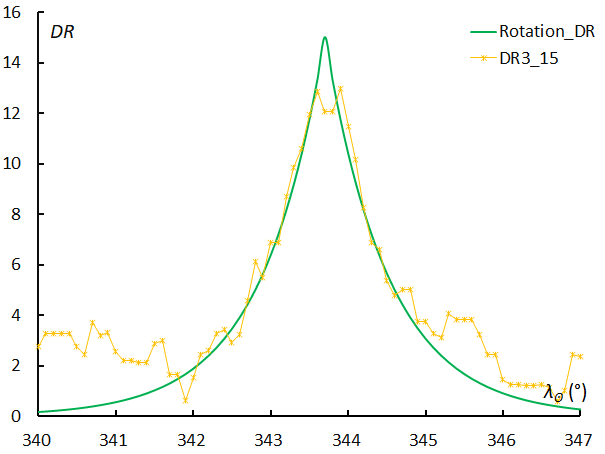
Figure 233 – Activity profile for the 26-Bootids.
0346XHE: x-Herculids
λʘ = 351.9°, λ–λʘ = 249.0°, β = 70.8°, α = 255.9°, δ = 48.8°, vg = 34.5 km/s.
IMO’s Video network observations in March 2009 were the first detection report (Molau and Kac, 2009). Only traces can be seen in the CMOR image, and it appears to be a meteor shower suitable for video observation.
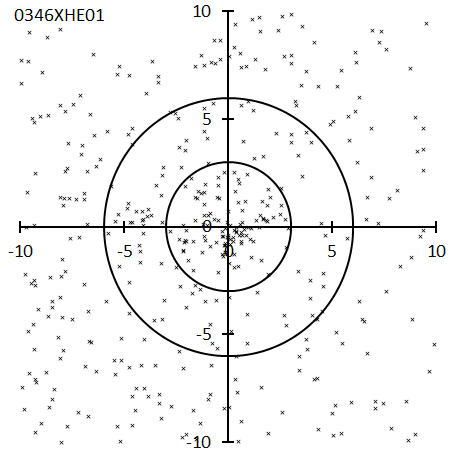
Figure 234 – Radiant point distribution map for the x-Herculids.
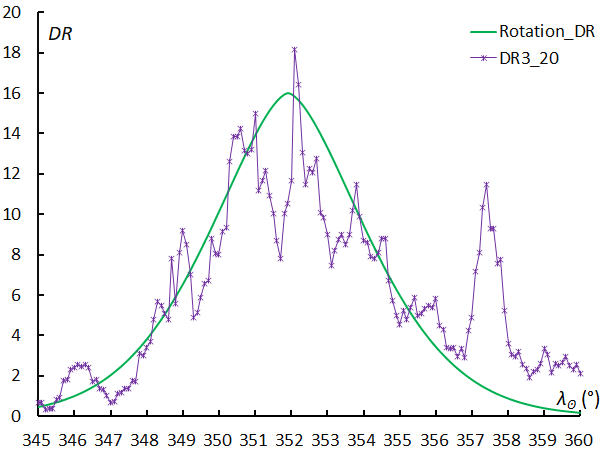
Figure 235 – Activity profile for the x-Herculids.
0011EVI: eta-Virginids
λʘ = 358°, λ–λʘ = 187.0°, β = 5.3°, α = 186.7°, δ = 2.8°, vg = 27.2 km/s.
Jenniskens pointed out that five EVIs were recorded on Super Schmidt on March 12–13, 1953 (Jenniskens, 2006). There are years when EVI appears intensively, and it has been pointed out that there is a four-year cycle (Shiba, 2018). Even though the total number of observed meteors in GMN is higher in 2022, the number of EVIs is higher in 2021. The radiant distribution has extremely elongated shape even when radiant drift is considered. This is because, as the author pointed out, EVI’s orbit has a rotating spread along the ecliptic plane (Koseki, 2020).
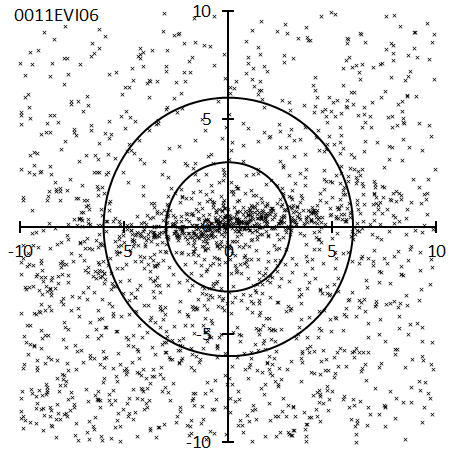
Figure 236 – Radiant point distribution map for the eta-Virginids.
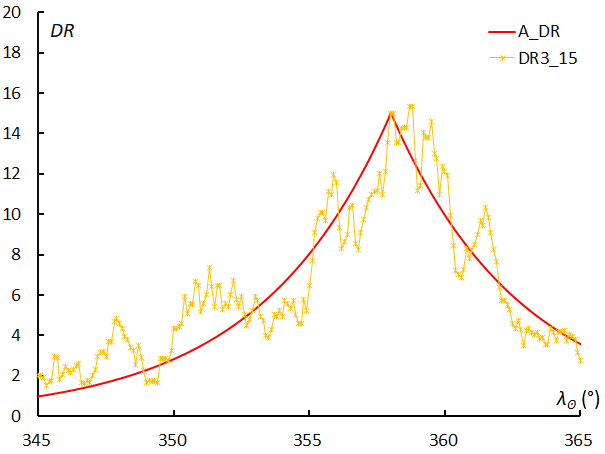
Figure 237 – Activity profile for the eta-Virginids.
0893EOP: eta-Ophiuchids
λʘ = 358.2°, λ–λʘ = 262.8°, β = 6.7°, α = 260.7°, δ = –16.5°, vg = 70.8 km/s.
This meteor shower appeared in the second CAMS report (Jenniskens, et al., 2018b). The number of EOPs that have been obtained is still small at 58, the activity profile is asymmetric, and the activity in the latter half of maximum activity appears to be long. Although not mentioned in the previous article (Koseki, 2021), it is also listed in SonotaCo net J14 list and GMN. However, in the J14 list, the period of activity is limited to λʘ = 354.60°~356.36°, which is the first half of EOP’s activity.
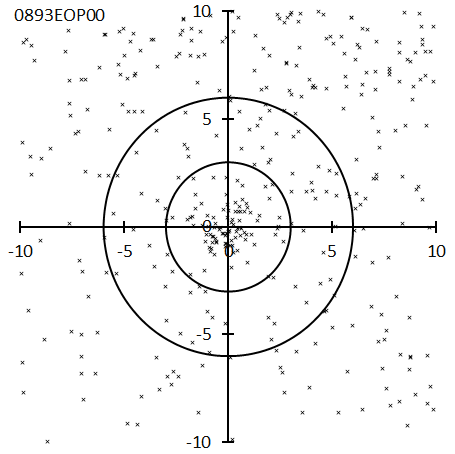
Figure 238 – Radiant point distribution map for the eta-Ophiuchids.
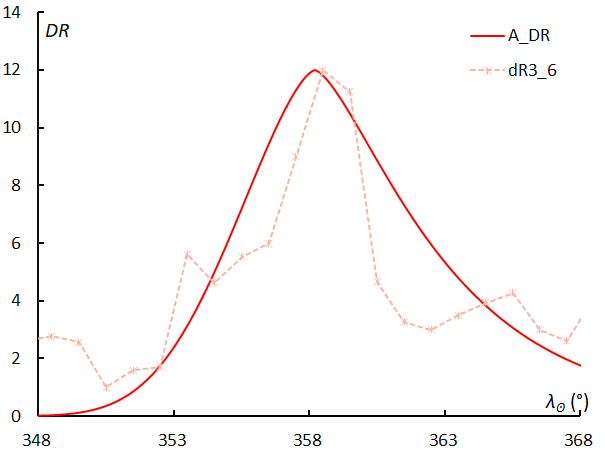
Figure 239 – Activity profile for the eta-Ophiuchids.
Acknowledgment
This paper would not have been possible without the dedicated efforts of the observers, and the author would like to express his heartfelt gratitude to the members of SonotaCo net and Global Meteor Network (Vida et al., 2019; 2020; 2021).
References
Andreić Željko, Šegon Damir, Korlević Korado, Novoselnik Filip, Vida Denis, Skokić Ivica (2013). “Ten possible new showers from the Croatian Meteor Network and SonotaCo datasets”. WGN, the Journal of the IMO, 41, 103–108.
Andreić Željko, Gural Peter, Šegon Damir, Skokić Ivica, Korlević Korado, Vida Denis, Novoselnik Filip, Gostinski David (2014). “Results of CMN 2013 search for new showers across CMN and SonotaCo databases I”. WGN, the Journal of the IMO, 42,
90–97.
Babadzhanov P. B., Kramer E. N. (1967). “Orbits of bright photographic meteors”. Smithsonian Contributions to Astrophysics, 11, 67–79.
Brown P., Weryk R. J., Wong D. K., and Jones J. (2008). “A meteoroid stream survey using the Canadian Meteor Orbit Radar. I. Methodology and radiant catalogue”. Icarus, 195, 317–339.
Brown P., Wong D. K., Weryk R. J., and Wiegert P. (2010). “A meteoroid stream survey using the Canadian Meteor Orbit Radar. II. Identification of minor showers using a 3D wavelet transform”. Icarus, 207, 66–81.
Denning W. F. (1899). “General catalogue of the radiant points of meteoric showers and of fireballs and shooting stars observed at more than one station”. Memoirs of the Royal Astronomical Society, 53, 201–293.
Galligan D. P., Baggaley W. J. (2002). “Wavelet enhancement for detecting shower structure in radar meteoroid data II. Application to the AMOR data”. COSPAR Colloquia Series, 15, 48–60.
Greaves John (2012). “Four Meteor Showers from the SonotaCo Network Japan”. WGN, the Journal of the IMO, 40, 16–23.
Hoffmeister C. (1948). Meteorstöme. Johann Ambrosius Bath, Verlag, Leipzig.
Jenniskens Peter, Moilanen Jarmo, Lyytinen Esko, Yrjölä Ilkka, Brower Jeff (2005). “The 2005 October 5 outburst of October Camelopardalids”. WGN, the Journal of the IMO, 33, 125–128.
Jenniskens P. and Gural P. S. (2011). “Discovery of the February Eta Draconids (FED, IAU#427): the dust trail of a potentially hazardous long-period comet”. WGN, the Journal of the IMO, 39, 93–97.
Jenniskens P., Nénon Q., Albers J., Gural P. S., Haberman B., Holman D., Morales R., Grigsby B. J., Samuels D., Johannink C. (2016a). “The established meteor showers as observed by CAMS”. Icarus, 266, 331–354.
Jenniskens P., Nénon Q., Gural P. S., Albers J., Haberman B., Johnson B., Morales R., Grigsby B. J., Samuels D., Johannink C. (2016b). “CAMS newly detected meteor showers and the sporadic background”. Icarus, 266, 384–409.
Jenniskens P., Nénon Q. (2016c). “CAMS verification of single-linked high-threshold D-criterion detected meteor showers”. Icarus, 266, 371–383.
Jenniskens Peter, Johannink Carl, Moskovitz Nick (2018a). “February Hydrids outburst (IAU#1032, FHY)”. WGN, the Journal of the IMO, 46, 85–86.
Jenniskens Peter, Baggaley Jack, Crumpton Ian, Aldous Peter, Pokorny Petr, Janches Diego, Gural Peter S., Samuels Dave, Albers Jim, Howell Andreas, Johannink Carl, Breukers Martin, Odeh Mohammad, Moskovitz Nicholas, Collison Jack, Ganju Siddha (2018b). “A survey of southern hemisphere meteor showers”. Planetary and Space Science, 154, 21–29.
Jenniskens P. (2022). “18-Aquariid meteor shower 2022”. CBET 5159, published 2022, August 17.
Jenniskens P. (2015). “New Chi Cygnids Meteor Shower”. CBET 4144, published September 2015.
Koseki M. (1985). “A meteor shower associated with comet IRAS-Araki-Alcock”. The 35th Japanese Meteor Conference (in Japanese).
Koseki M. (2018). “Different definitions make a meteor shower distorted. The views from SonotaCo net and CAMS”. WGN, the Journal of the IMO, 46, 119–135.
Koseki M. (2019). “Legendary meteor showers: Studies on Harvard photographic results”. WGN, the Journal of the IMO, 47, 139–150.
Koseki M. (2020). “Three Virginid showers”. eMetN Meteor Journal, 5, 245–251.
Koseki M. (2021). “The activity of meteor showers recorded by SonotaCo Net video observations 2007–2018”. eMetN Meteor Journal, 6, 91–246.
Koseki M. (2022a). “The Andromedids (#0018AND)”. eMetN Meteor Journal, 7, 313–320.
Koseki M. (2022b). “SonotaCo net vs CAMS vs EDMOND vs GMN in the case of the chi Cygnids (CCY#0757)”. eMetN Meteor Journal, 7, 381–389.
Koseki M. (2024a). “Meteor shower data from video observation, Part I, Research methods and summary of survey results”. eMetN Meteor Journal, 9, 166–183.
Koseki M. (2024b). “Meteor shower data from video observation, Part II, Meteor showers that need careful attention”. eMetN Meteor Journal, 9, 215–230.
Koukal J., Srba J., Tóth J. (2016). “Confirmation of the chi Cygnids (CCY, IAU#757)”. WGN, the Journal of the IMO, 44, 5–9.
Kronk Gary W. (2013). Meteor Showers: An Annotated Catalog, 2nd ed., Springer.
Lindblad B. A., (1971). “A Computerized Stream Search among 2401 Photographic Meteor Orbits”. Smithsonian Contributions to Astrophysics, 12, 14–24.
Lovell A.C.B. (1954). Meteor Astronomy, Oxford, Clarendon Press.
McCrosky R.E. and Posen A. (1959). “New Photographic Meteor Shower”. Astron. J., 64, 25–27.
Molau S. and Kac J. (2009). “Results of the IMO Video Meteor Network – March 2009”. WGN, the Journal of the IMO, 37, 92–93.
Molau S., Rendtel J. (2009). “A Comprehensive List of Meteor Showers Obtained from 10 Years of Observations with the IMO Video Meteor Network”. WGN, the Journal of the IMO, 37, 98–121.
Nilsson C. S. (1964). “The Sextanid meteor stream”. Australian Journal of Physics, 17, 158–160.
Lindblad B.A., (1971). “A Computerized Stream Search among 2401 Photographic Meteor Orbits”. Smithsonian Contributions to Astrophysics, 12, 14–24.
Ohtsuka K., Tanigawa T., Murayama H., Hasegawa I. (2001). “The new meteor shower η Eridanids”. ESA SP-495, 109–112.
Pokorný P., Janches D., Brown P. G., Hormaechea J. L. (2017). “An orbital meteoroid stream survey using the Southern Argentina Agile MEteor Radar (SAAMER) based on a wavelet approach”. Icarus, 290, 162–182.
Porubcan V., Gavajdova M. (1994). “A search for fireball streams among photographic meteors”. Planetary and Space Science, 42, 151–155.
Roggemans P., Šegon D., Vida D. (2023). “June Bootids (JBO#170) in 2022 recorded by Global Meteor Network”. eMetN Meteor Journal, 8, 65–73.
Rudawska R. and Jenniskens P. (2014). “New meteor showers identifed in the CAMS and SonotaCo meteoroid orbit surveys”. The Meteoroids 2013, Proceedings of the Astronomical Conference, 2014, 217–224.
Šegon Damir, Andreić Željko, Korlević Korado, Novoselnik Filip, Vida Denis, Skokić Ivica (2013). “8 new showers from Croatian Meteor Network data”. WGN, the Journal of the IMO, 41, 70–74.
Šegon Damir, Gural Peter, Andreić Željko, Skokić Ivica, Korlević Korado, Vida Denis, Novoselnik Filip (2014). “New showers from parent body search across several video meteor databases”. WGN, the Journal of the IMO, 42, 57–64.
Šegon Damir, Gural Peter, Andreić Željko, Vida Denis, Skokić Ivica, Novoselnik Filip, Gržinić Luciano (2014). “A possible new shower on Eridanus-Orion border”. WGN, the Journal of the IMO, 42, 218–221.
Sekanina Z. (1976), “Statistical model of meteor streams. IV – A study of radio streams from the synoptic year”. Icarus, 27, 265–321.
Sekiguchi T. (2022). “New radiant on Aquarius/Capricorn border by the SonotaCo Network”. eMetN Meteor Journal, 7, 302–303.
Shiba Y. (2015). “Chi Cygnids observation in Japan”. WGN, the Journal of the IMO, 43, 179–180.
Shiba Y. (2018). “Eta Virginids (EVI) four-year cycle”. WGN, the Journal of the IMO, 46, 184–190.
SonotaCo (2009). “A meteor shower catalog based on video observations in 2007-2008”. WGN, the Journal of the IMO, 37, 55–62.
Spurný P. (1999). “EN270698 fireball: the first photographic data on a member of the June Bootid meteor stream”. Meteoroids 1998, 235–238.
Uehara S., Fujiwara Y., Furukawa Takashi, Inoue H., Kageyama K., Maeda K., Muroishi H., Okamoto S., Masuzawa T., Sekiguchi T., Shimizu M., Yamakawa H. (2006). “Detection of October Ursa Majorids in 2006”. WGN, the Journal of the IMO, 34, 157–162.
Vida D., Gural P., Brown P., Campbell–Brown M., Wiegert P. (2019). “Estimating trajectories of meteors: an observational Monte Carlo approach – I. Theory”. Monthly Notices of the Royal Astronomical Society, 491, 2688–2705.
Vida D., Gural P., Brown P., Campbell–Brown M., Wiegert P. (2020). “Estimating trajectories of meteors: an observational Monte Carlo approach – II. Results”. Monthly Notices of the Royal Astronomical Society, 491, 3996–4011.
Vida D., Šegon D., Gural P. S., Brown P. G., McIntyre M. J. M., Dijkema T. J., Pavletić L., Kukić P., Mazur M. J., Eschman P., Roggemans P., Merlak A., Zubrović D. (2021). “The Global Meteor Network – Methodology and first results”. Monthly Notices of the Royal Astronomical Society, 506, 5046–5074.
Whipple Fred L. (1954). “Photographic meteor orbits and their distribution in space”. Astronomical Journal, 59, 201–217.
Wright F. W., Jacchia L. G., and Whipple F. L. (1957). “Photographic ι-Aquariid meteors and evidence for the northern δ Aquariids”. Astron. J., 62, 225–233.