Abstract: An overview of the radio observations during May 2024 is given.
The graphs show both the daily totals (Figure 1) and the hourly numbers (Figure 2) of “all” reflections counted automatically, and of manually counted “overdense” reflections, overdense reflections longer than 10 seconds and longer than 1 minute, as observed here at Kampenhout (BE) on the frequency of our VVS-beacon (49.99 MHz) during the month of May 2024.
The hourly numbers, for echoes shorter than 1 minute, are weighted averages derived from:

The past month has been anything but boring. Local interference and unidentified noise remained quite low for most of the month, but lightning activity was detected on 12 different days. Sometimes it was intense and lasting for hours, as on May 1, 12, 18, 19, and 26, significantly hindering meteor counting.
Also, the Sun was very active, with powerful outbursts almost daily, usually of type III, which sometimes hampered meteor recordings for several minutes (Figures 3 to 5).
On May 10 and 11 exceptionally powerful auroras were also visible from Belgium, the most intense being recorded on the frequency of our beacon (Figures 6 to 8).
During the second half of the month there were temporary problems with the transmission power of our beacon, but these apparently only had a minor impact on the observations.
The meteor activity was also particularly interesting. As expected, the eye-catchers were the eta-Aquariids that reached their maximum on May 4–6. Apparently, the long-lasting reflections (and therefore more massive meteoroids) came earlier than the shorter ones.
The last days of the month were notable for the suddenly increasing number of underdenses and short overdenses. During the entire month 16 reflections longer than 1 minute were recorded. A selection of these, along with some other interesting reflections is included (Figures 9 to 28). More of these are available on request.
In addition to the usual graphs, you will also find the raw counts (subject to strict reservations as previously said) in cvs-format from which the graphs are derived. The table contains the following columns: day of the month, hour of the day, day + decimals, solar longitude (epoch J2000), counts of “all” reflections, overdense reflections, reflections longer than 10 seconds and reflections longer than 1 minute, the numbers being the observed reflections of the past hour.
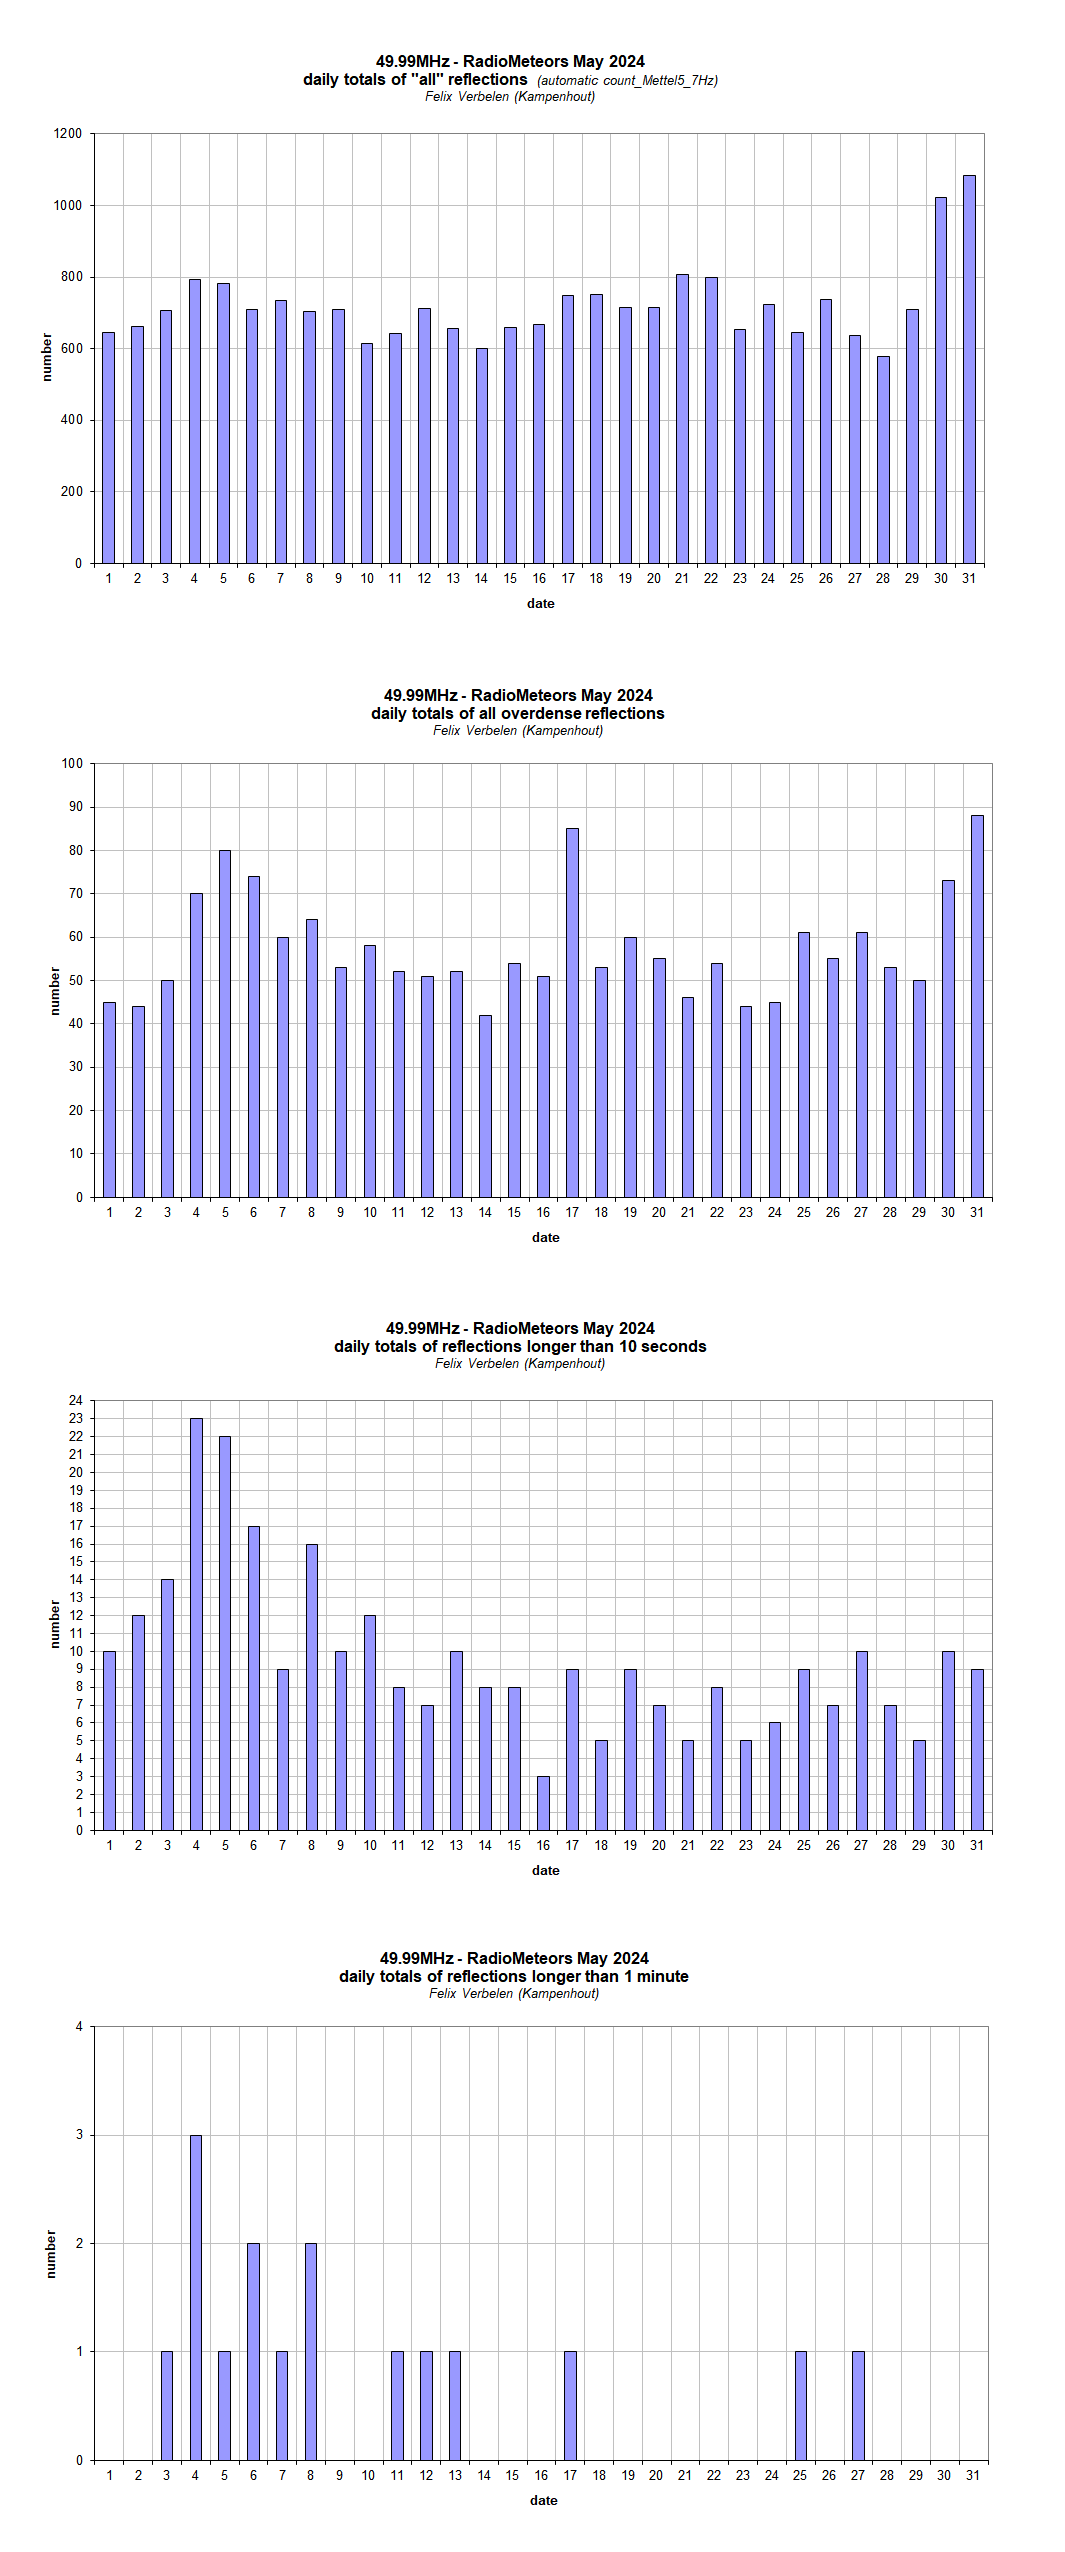
Figure 1 – The daily totals of “all” reflections counted automatically, and of manually counted “overdense” reflections, as observed here at Kampenhout (BE) on the frequency of our VVS-beacon (49.99 MHz) during May 2024.
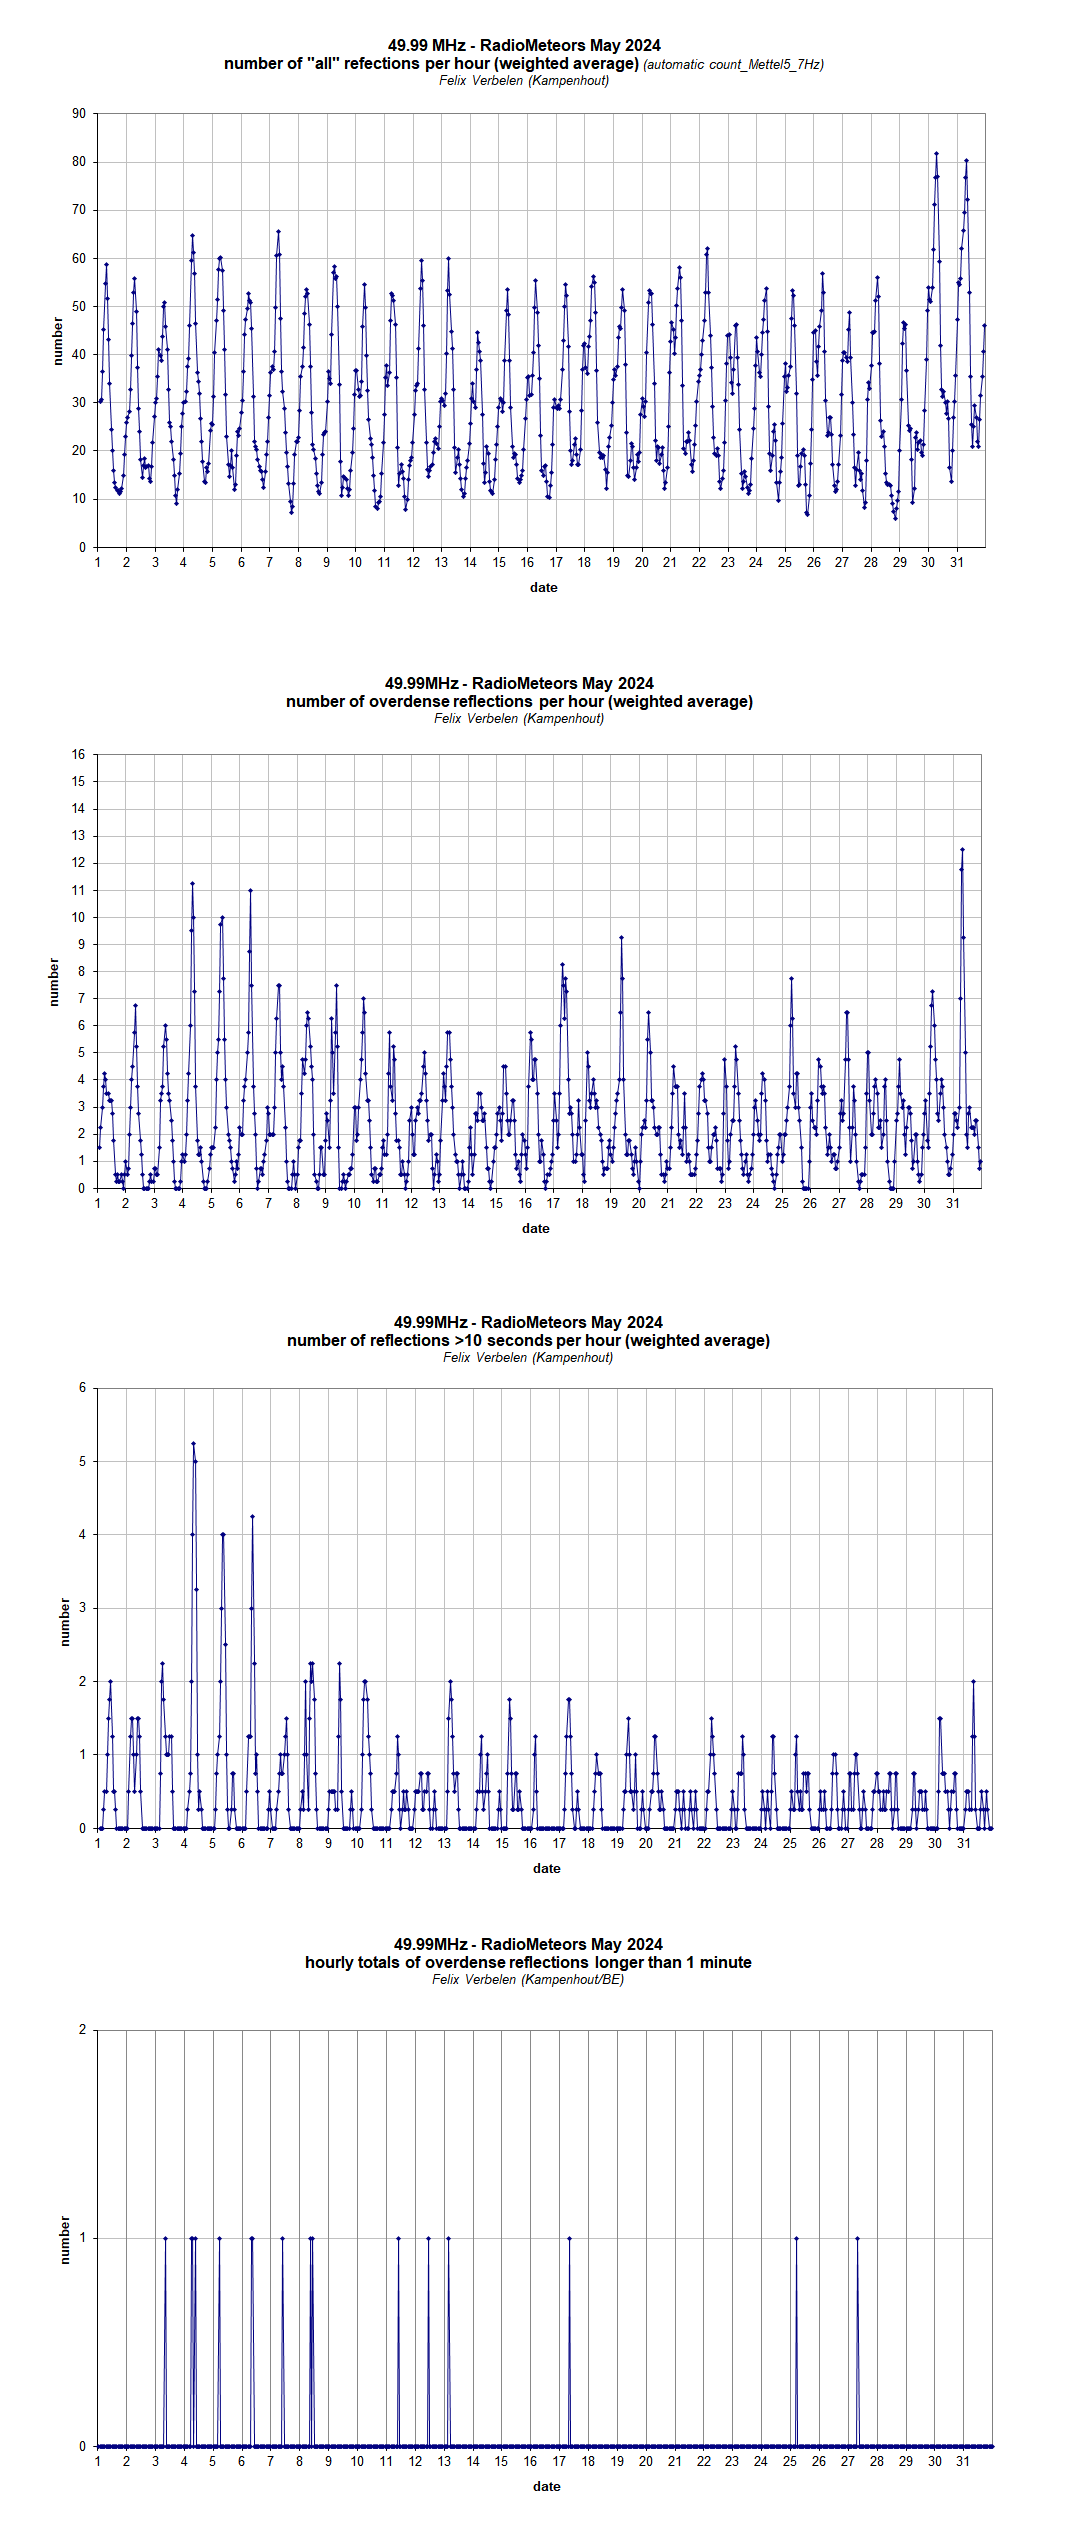
Figure 2 – The hourly numbers of “all” reflections counted automatically, and of manually counted “overdense” reflections, overdense reflections longer than 10 seconds and longer than 1 minute, as observed here at Kampenhout (BE) on the frequency of our VVS-beacon (49.99 MHz) during May 2024.
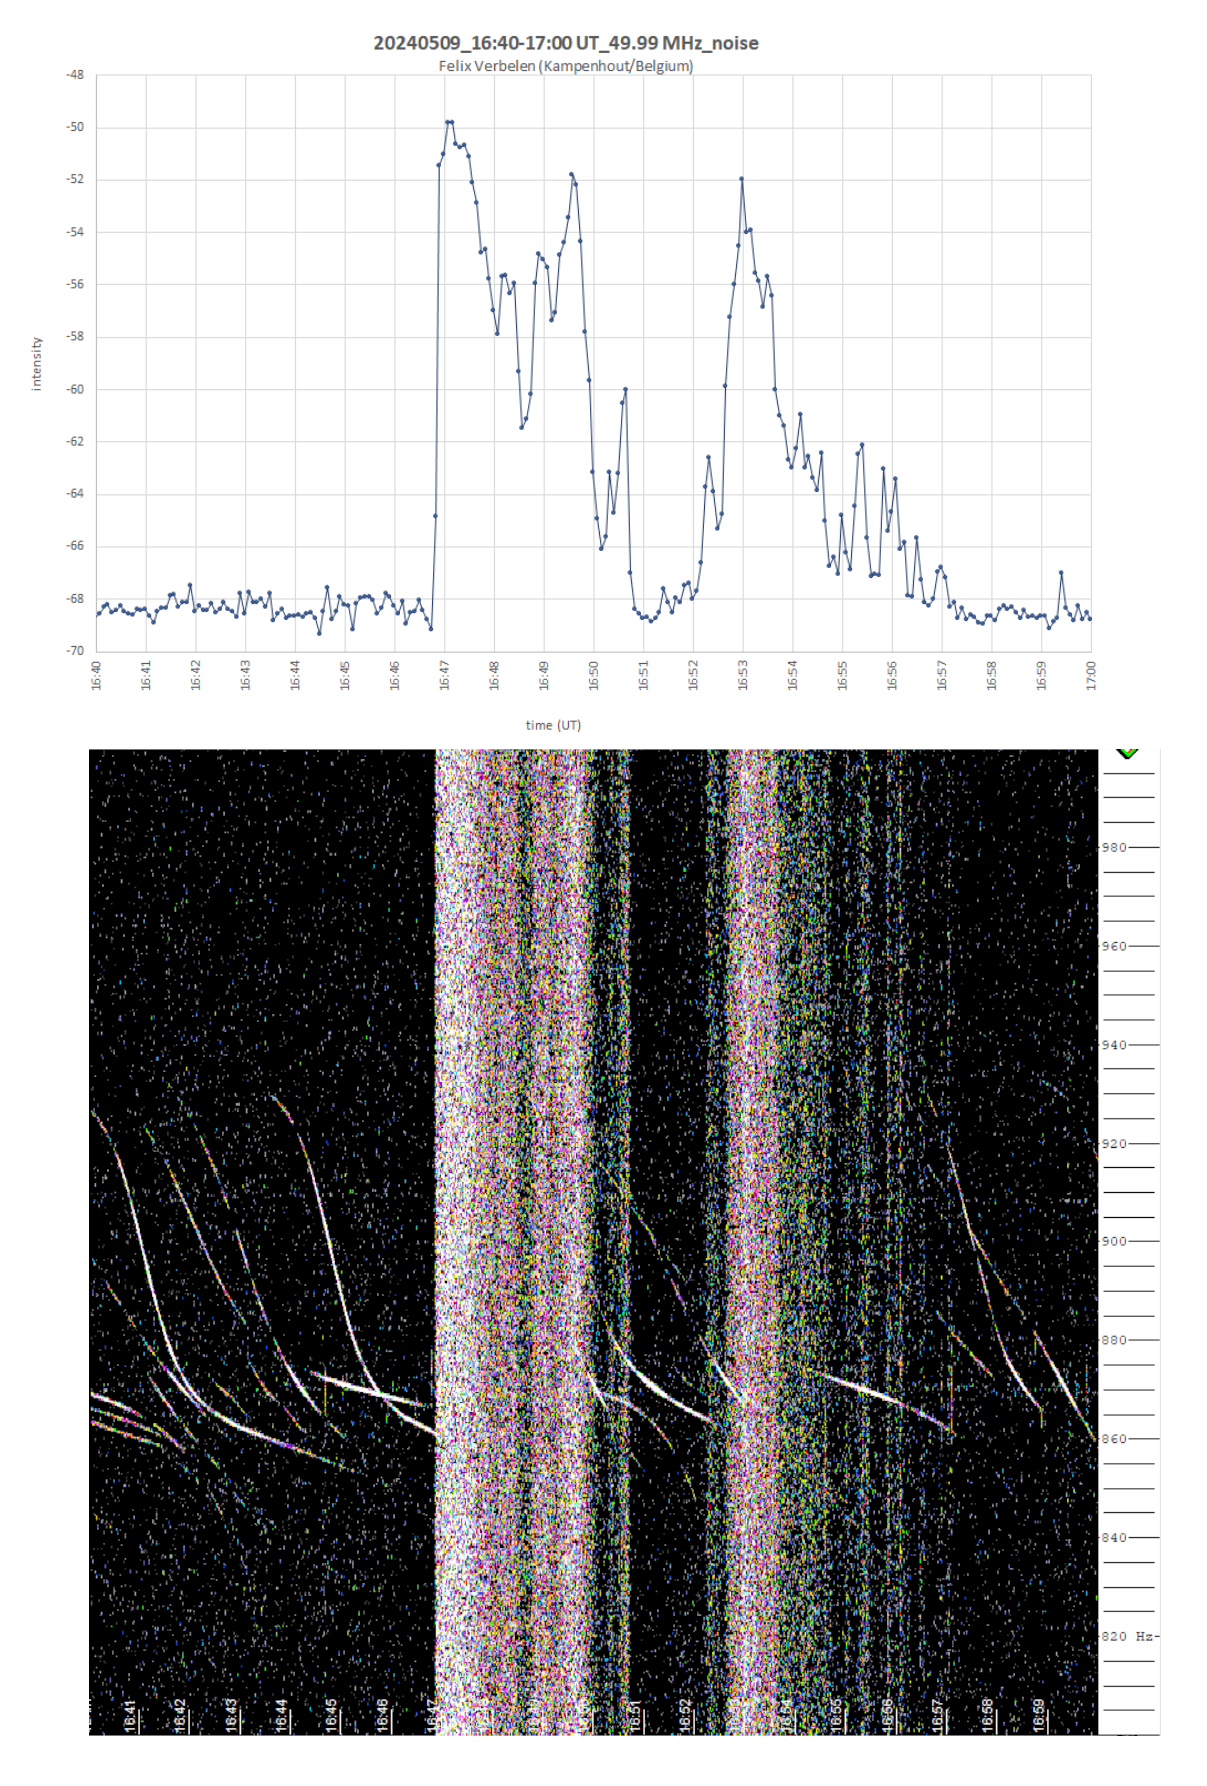
Figure 3 – Outbursts of the Sun hampered meteor observing for several minutes. 9 May 16h40m – 17h00m UT.
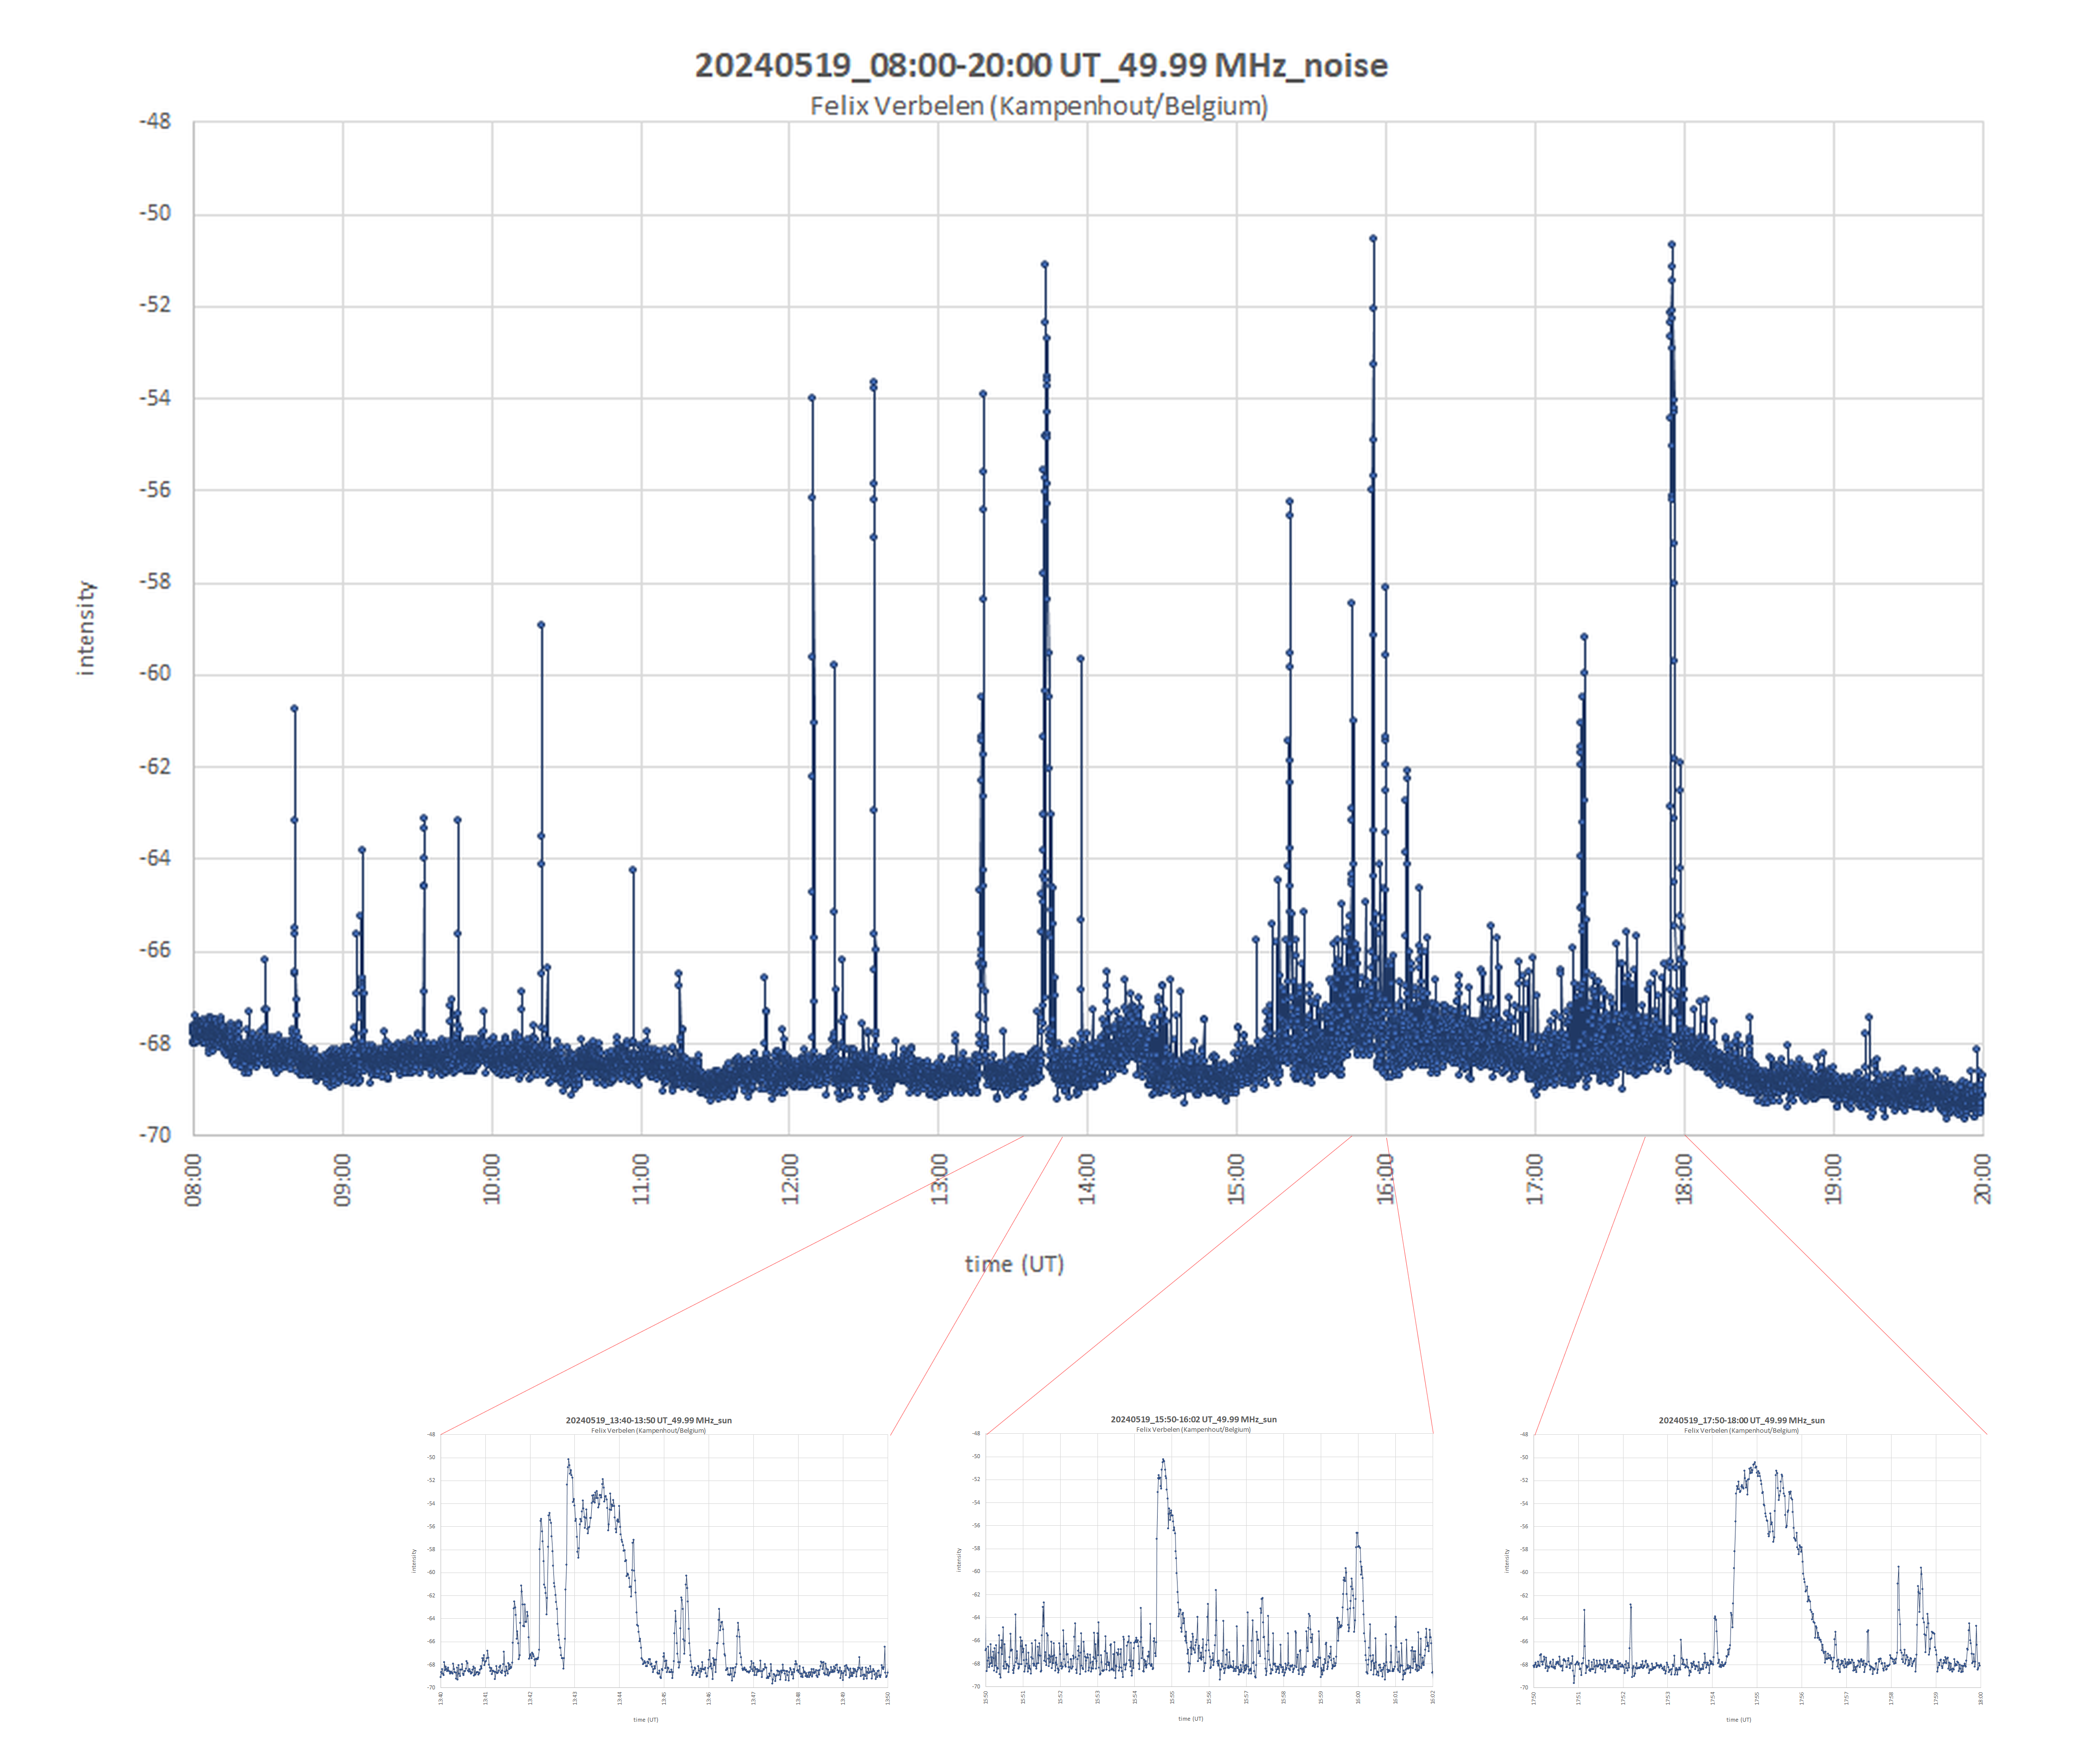
Figure 4 – Outbursts of the Sun hampered meteor observing for several minutes. 19 May 8h00m – 20h00m UT.
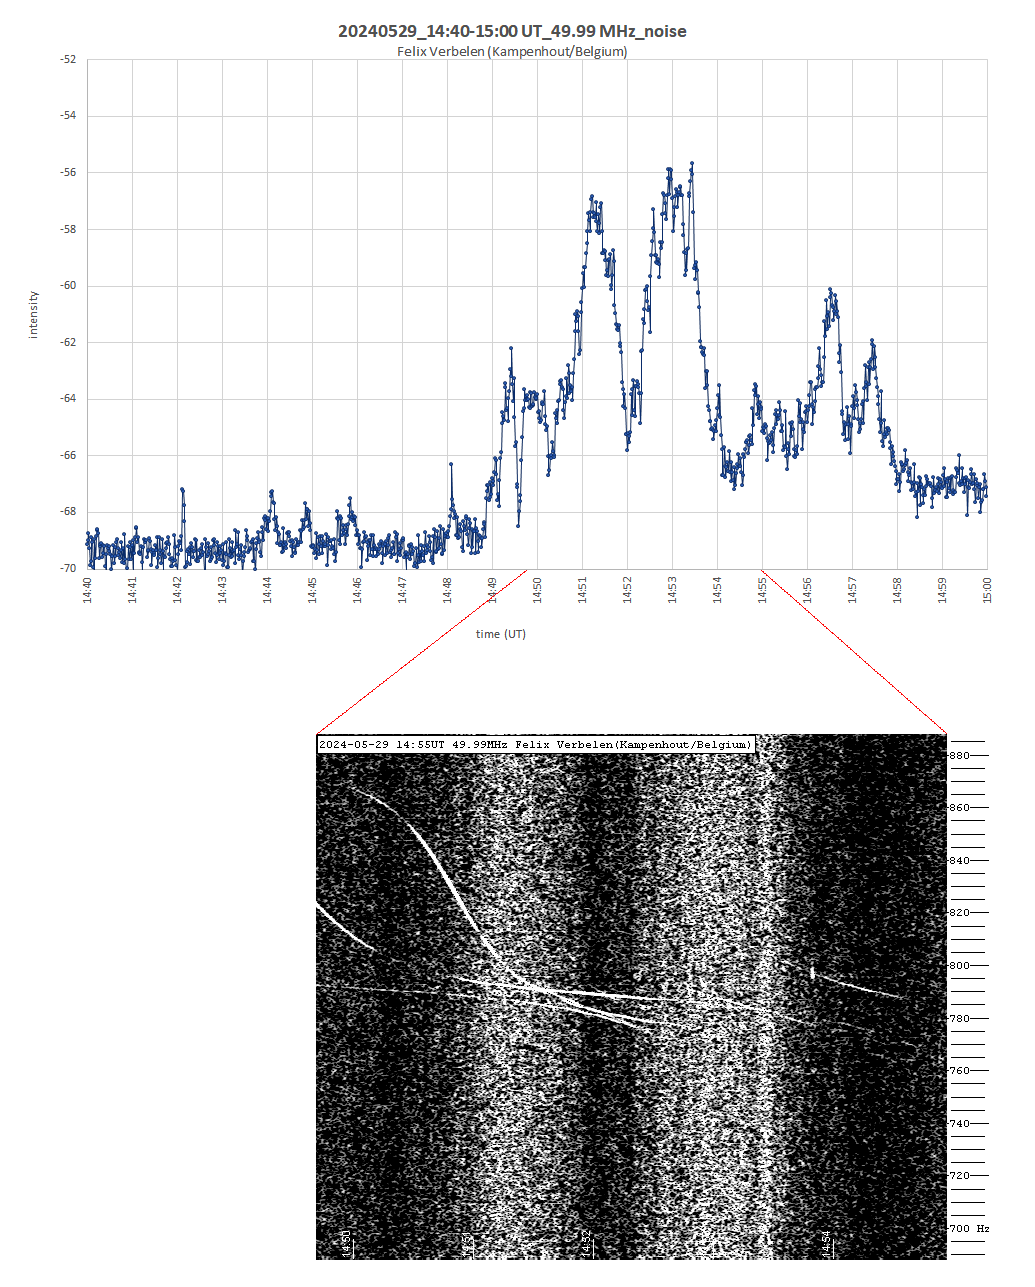
Figure 5 – Outbursts of the Sun hampered meteor observing for several minutes. 29 May 14h40m – 15h00m UT.
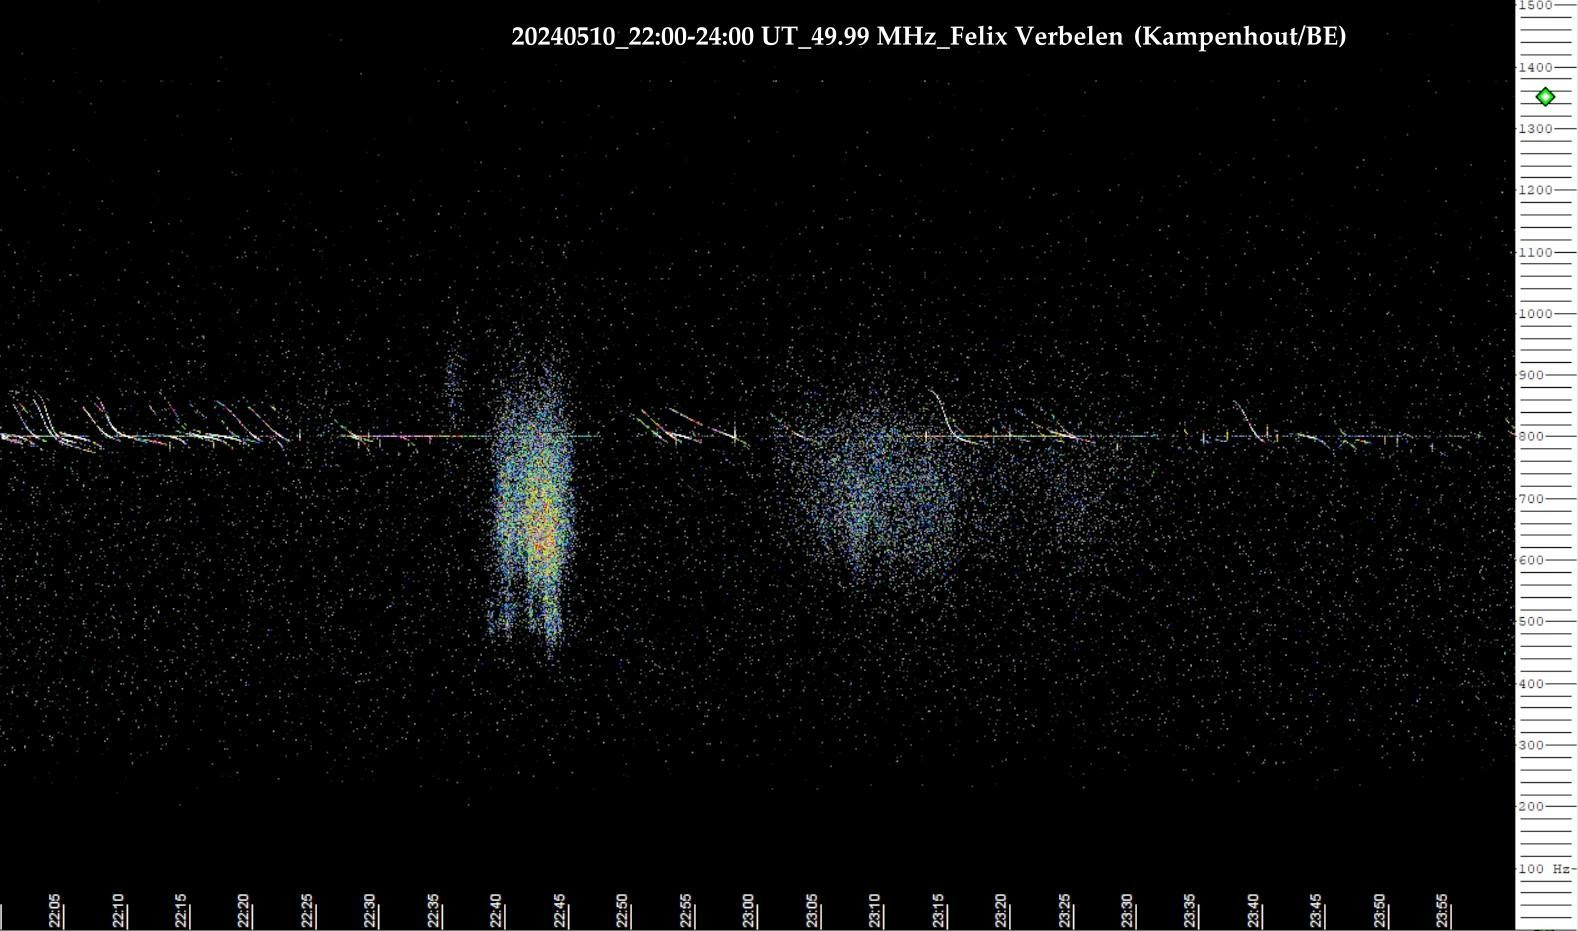
Figure 6 – On May 10 and 11 exceptionally powerful auroras were also visible from Belgium. 10 May 22h00m – 24h00m UT.
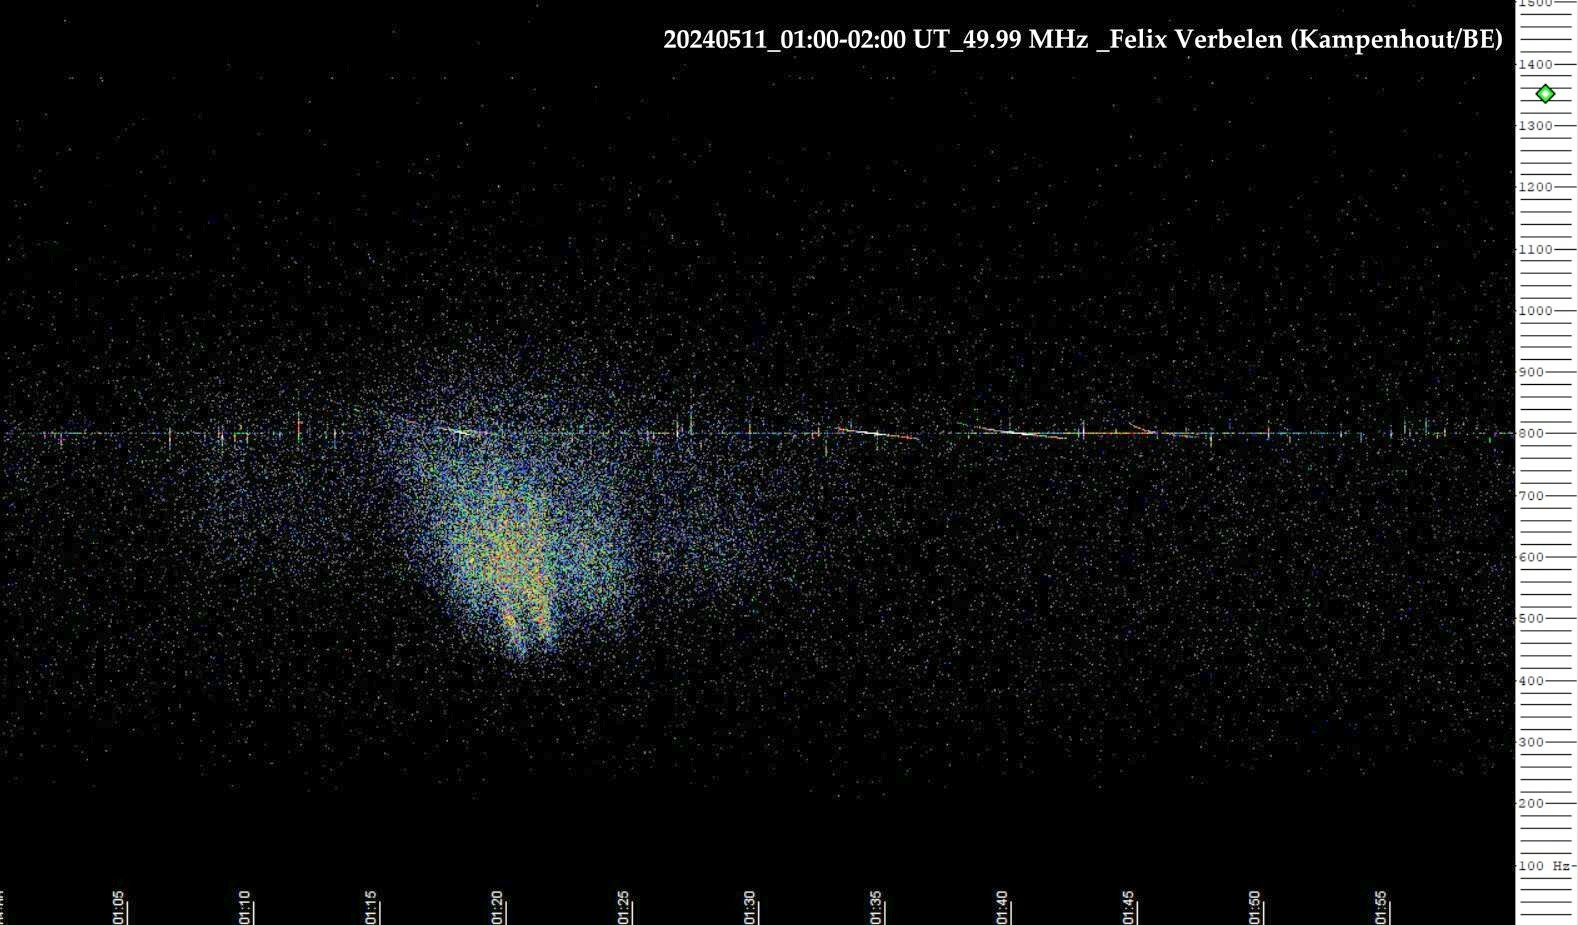
Figure 7 – On May 10 and 11 exceptionally powerful auroras were also visible from Belgium. 11 May 01h00m – 02h00m UT.
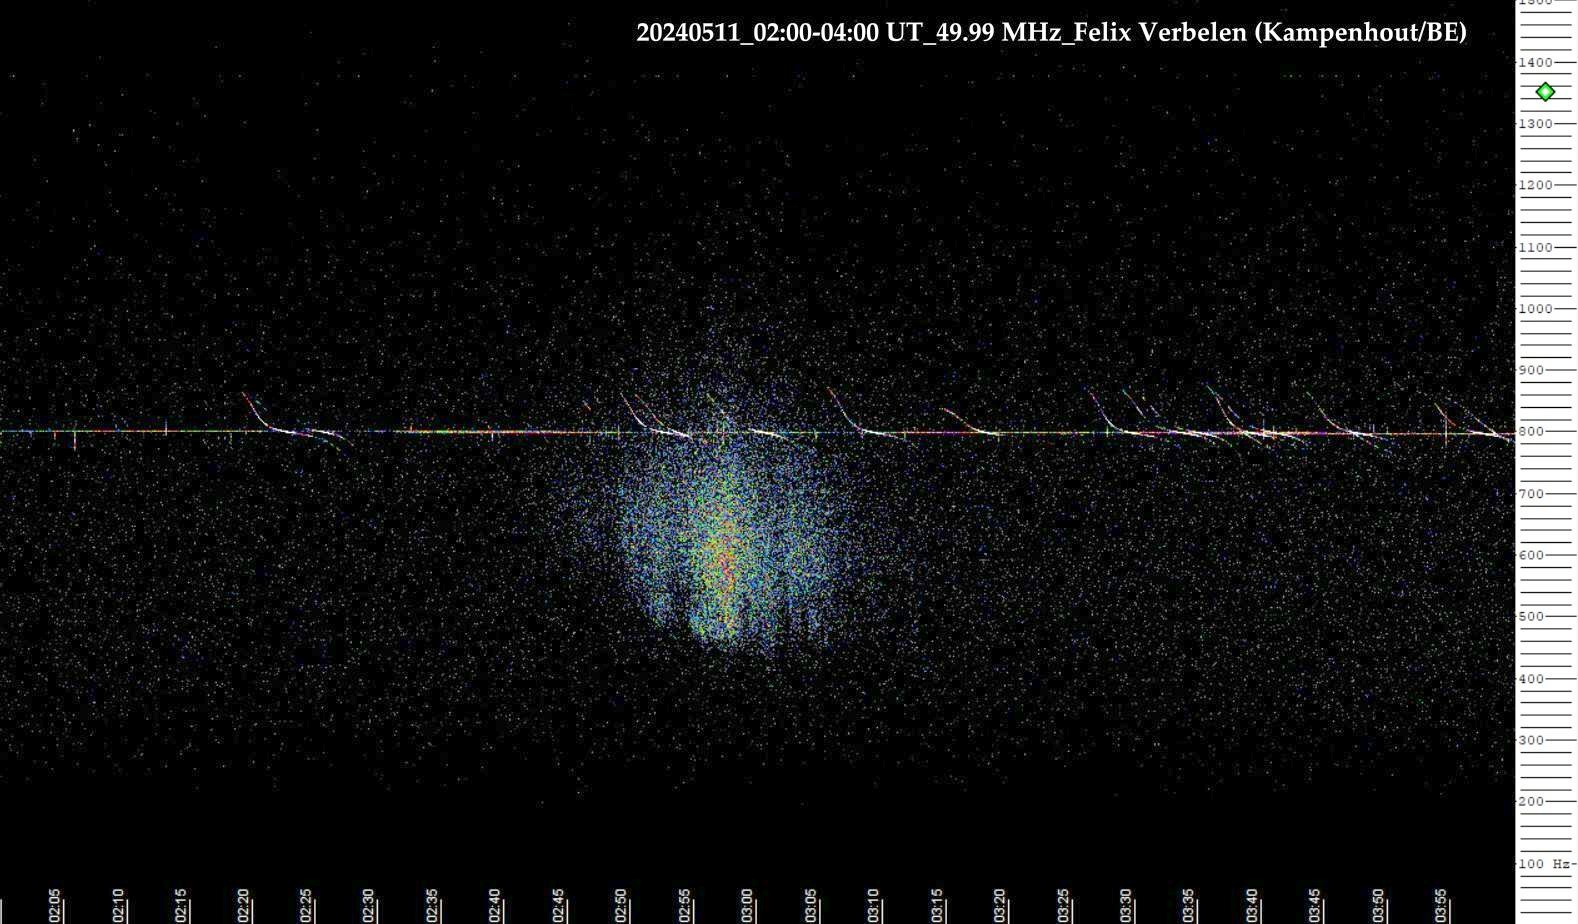
Figure 8 – On May 10 and 11 exceptionally powerful auroras were also visible from Belgium. 11 May 02h00m – 04h00m UT.
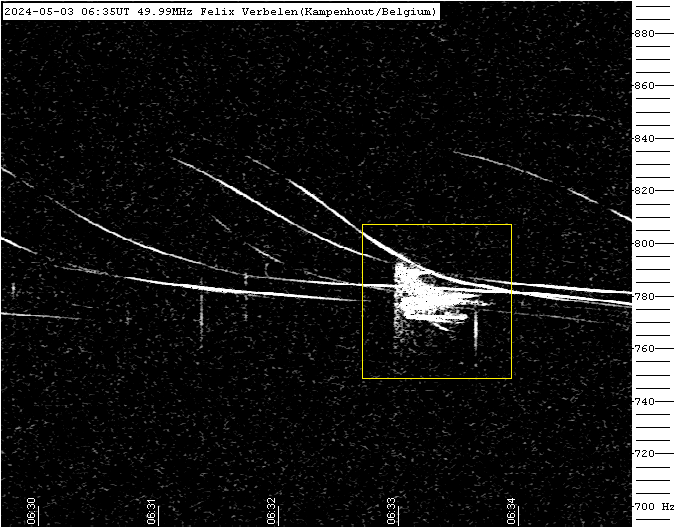
Figure 9 – Meteor echoes May 03, 06h35m UT.
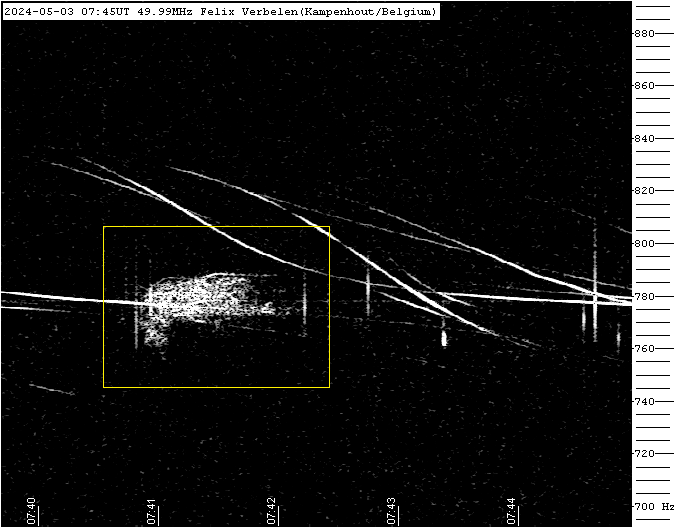
Figure 10 – Meteor echoes May 03, 07h45m UT.
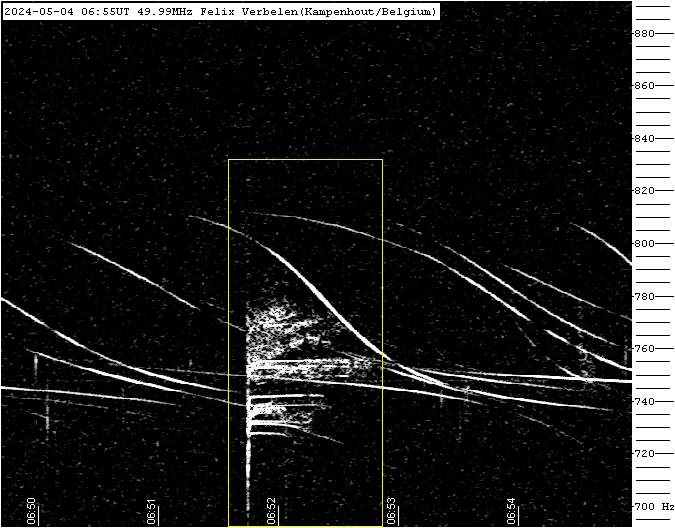
Figure 11 – Meteor echoes May 04, 06h55m UT.
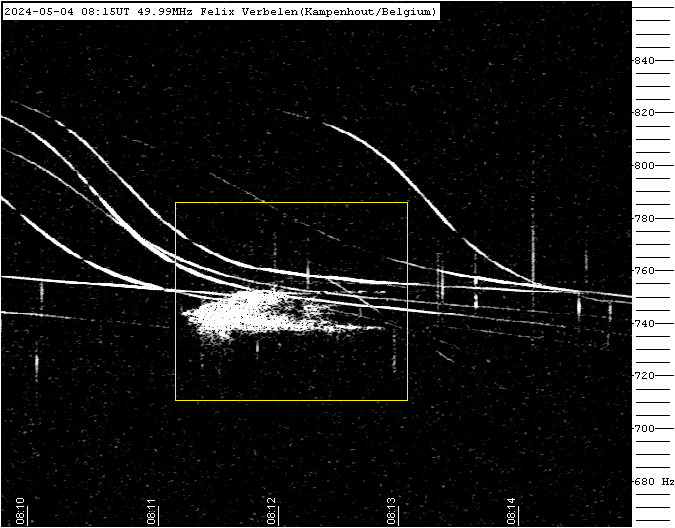
Figure 12 – Meteor echoes May 04, 08h15m UT.
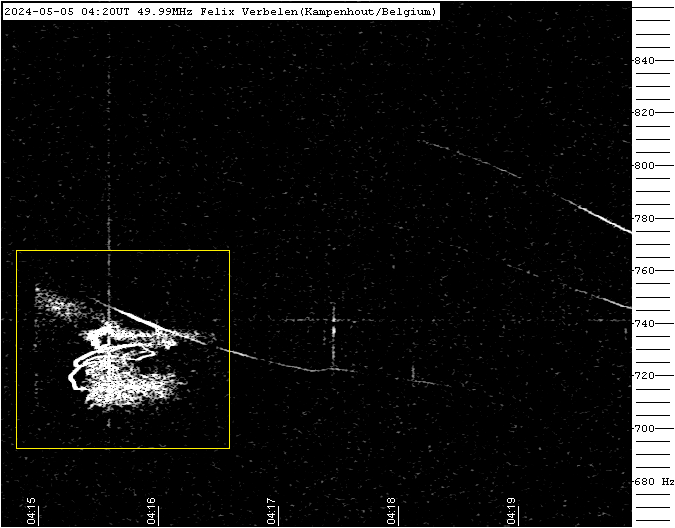
Figure 13 – Meteor echoes May 05, 04h20m UT.
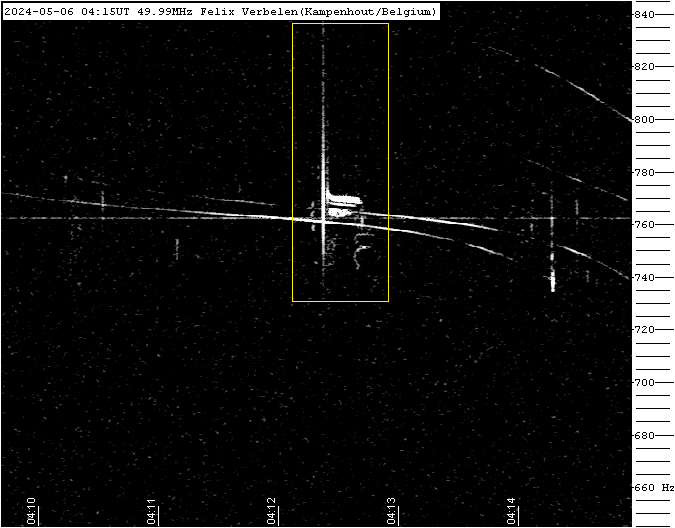
Figure 14 – Meteor echoes May 06, 04h15m UT.
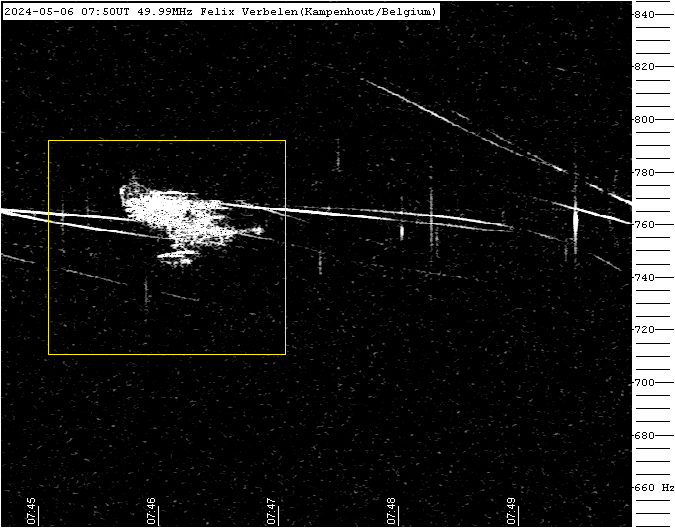
Figure 15 – Meteor echoes May 06, 07h50m UT.
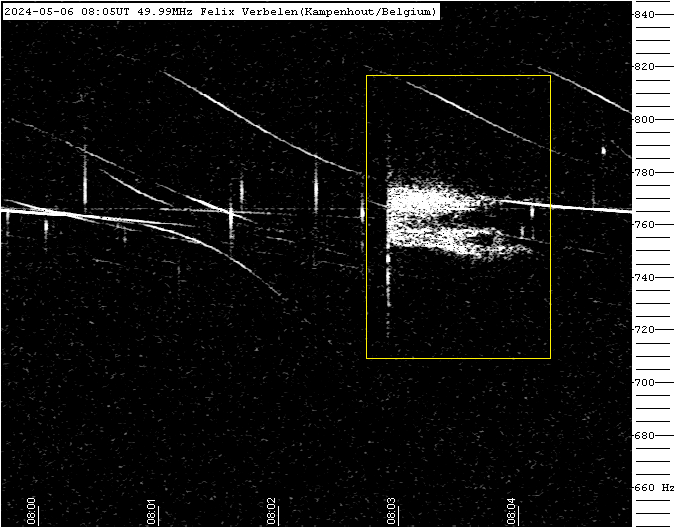
Figure 16 – Meteor echoes May 06, 08h05m UT.
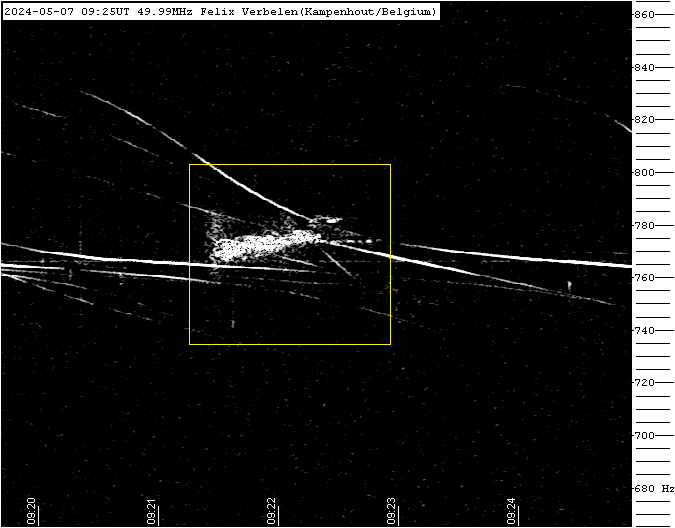
Figure 17 – Meteor echoes May 07, 09h25m UT.
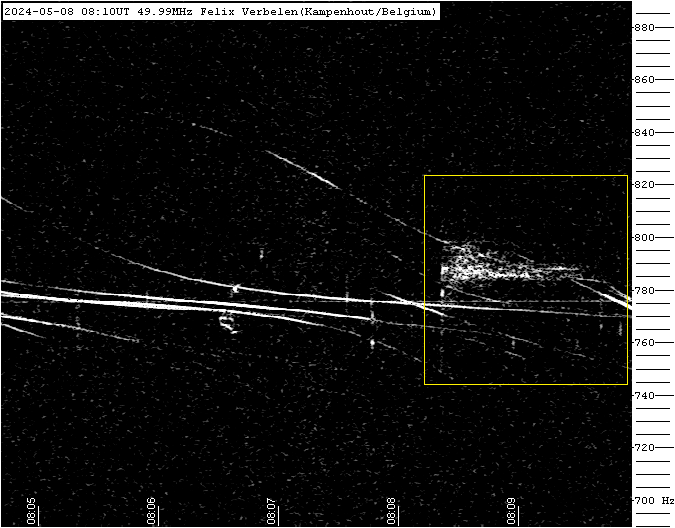
Figure 18 – Meteor echoes May 08, 08h10m UT.
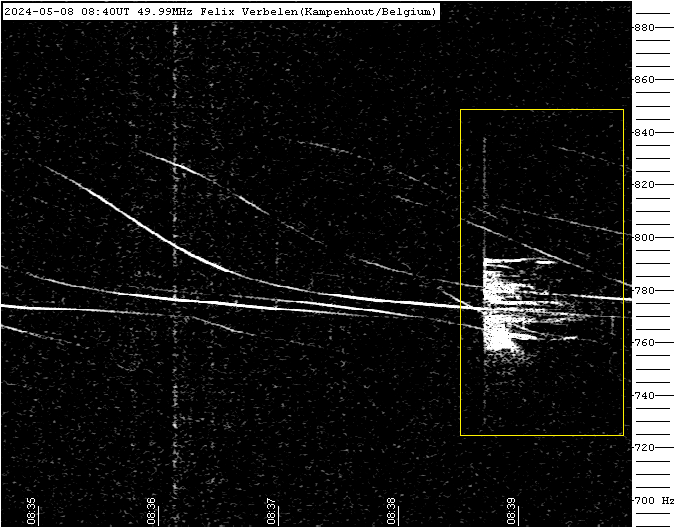
Figure 19 – Meteor echoes May 08, 08h40m UT.
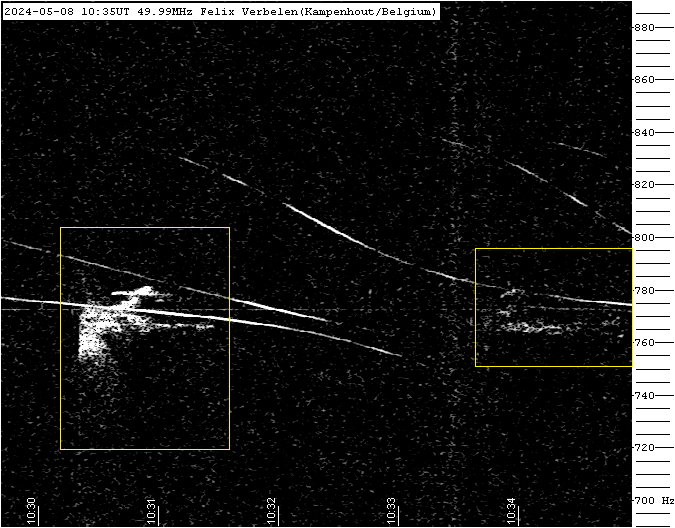
Figure 20 – Meteor echoes May 08, 10h35m UT.
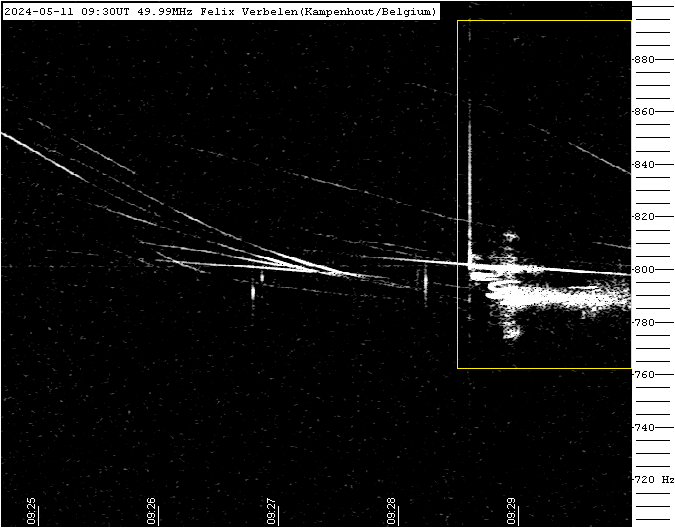
Figure 21 – Meteor echoes May 11, 09h30m UT.
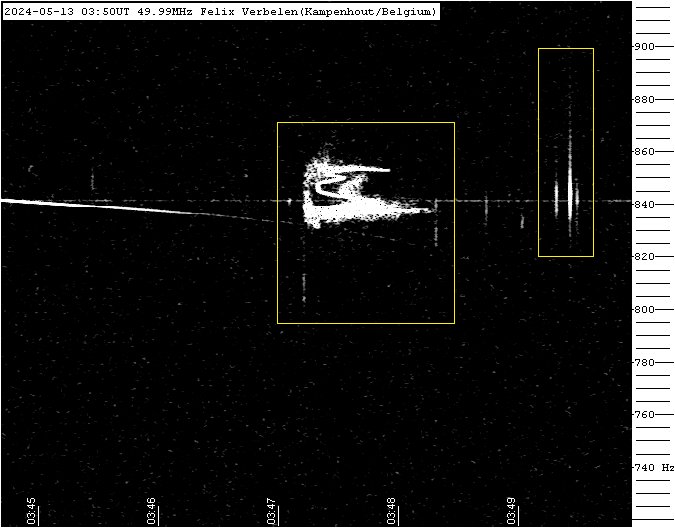
Figure 22 – Meteor echoes May 13, 03h50m UT.
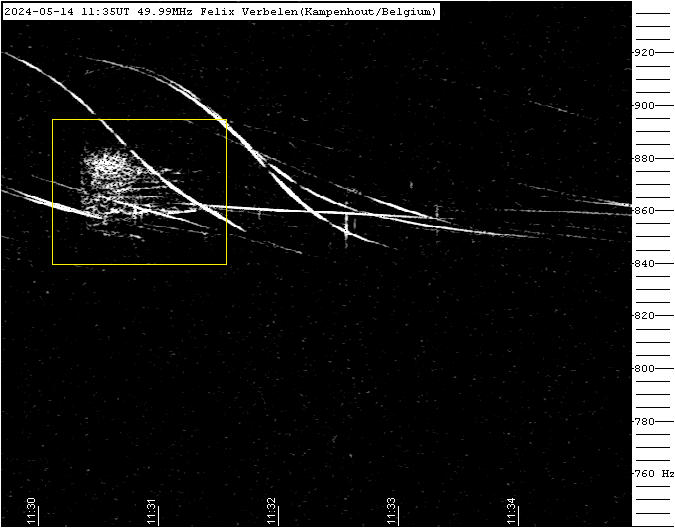
Figure 23 – Meteor echoes May 14, 11h35m UT.
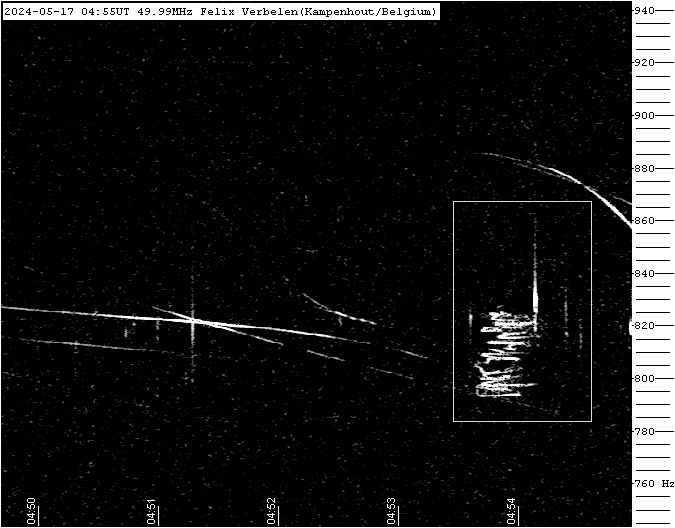
Figure 24 – Meteor echoes May 17, 04h55m UT.
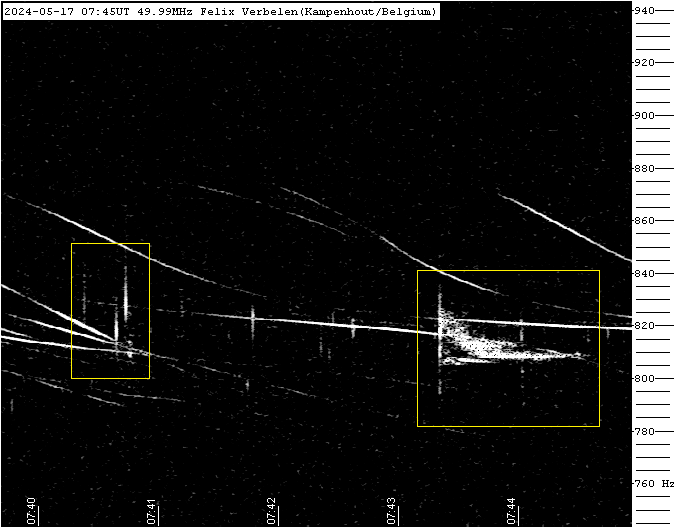
Figure 25 – Meteor echoes May 17, 07h45m UT.

Figure 26 – Meteor echoes May 25, 04h50m UT.
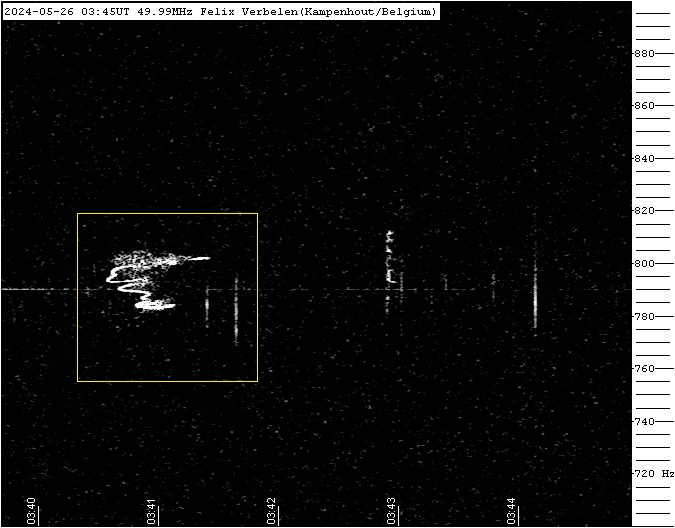
Figure 27 – Meteor echoes May 26, 03h45m UT.
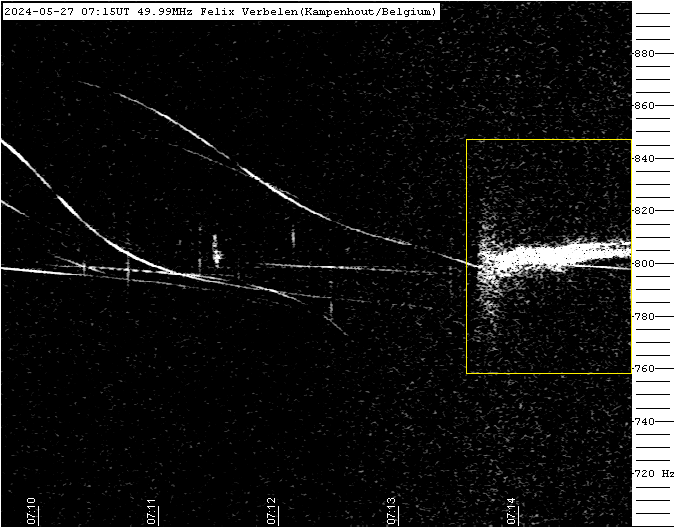
Figure 28 – Meteor echoes May 27, 07h15m UT.


