Mira Str.40-2, 222307, Molodechno, Belarus
astroseriv@yandex.by
Abstract: This article presents the results of radio observations made in January 2024.
2 INTRODUCTION
The observations were carried out at a private astronomical observatory near the town of Molodechno (Belarus) at the place of Polyani. A 5 element-antenna directed to the west was used, a car FM-receiver was connected to a laptop with as processor an Intel Atom CPU N2600 (1.6 GHz). The software to detect signals is MetAN (author – Carol from Poland). Observations are made on the operating frequency 88.6 MHz (the FM radio station near Paris broadcasts on this frequency). The “France Culture” radio broadcast transmitter (100 kW) I use is at about 1550 km from my observatory which has been renewed in 1997.
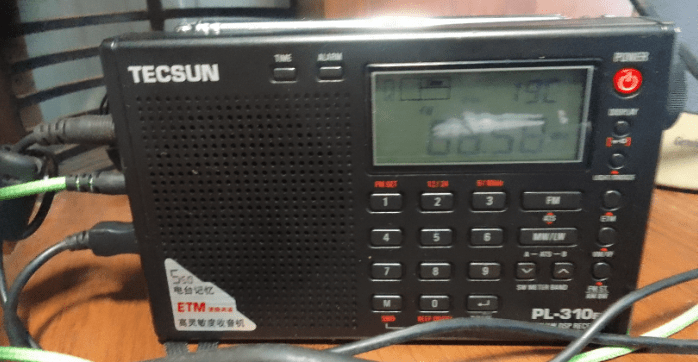
Figure 1 – New TECSUN PL-310ET meteor radio receiver.
On January 12 afternoon the new radio receiver TECSUN PL-310 ET (Figure 1) was put into operation, providing a more accurate search for the operating frequency around 88.6 MHz. The new operating frequency 88.58 MHz was selected. The peculiarity of this receiver is its good noiseimmunity, sensitivity and selectivity. The range covered by the SpectrumLab program is very good, which allows a visual search for fireballs radio signals.
3 Automatic observations
The maximum hourly count of QUA meteor numbers (#0010), occurred at 04h–06h UT on January 04, 2024, which agrees well with the IMO meteor calendar data at 03h40m UT on January 4 (λʘ = 283.15°).
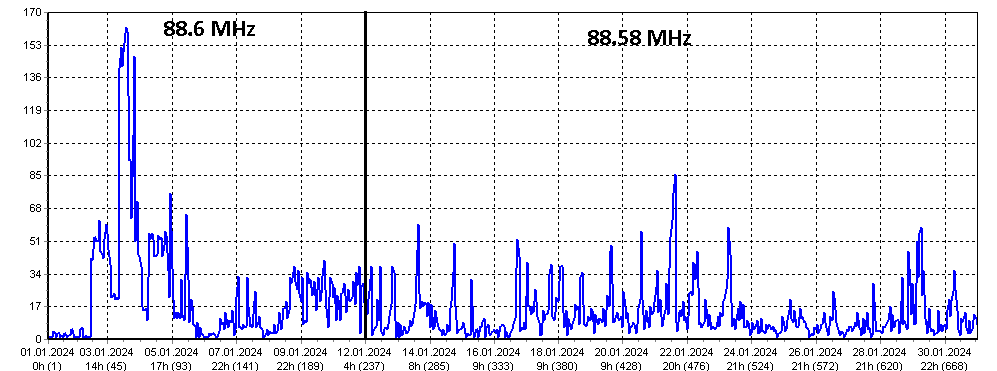
Figure 2 – Radio meteor echo counts at 88.6 MHz for January 2024.
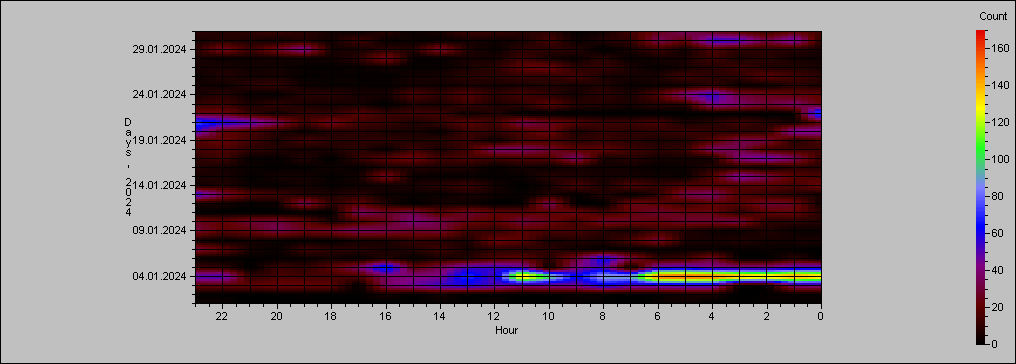
Figure 3 – Heatmap for radio meteor echo counts at 88.6 MHz for January 2024.
4 Listening to radio echoes on 88.58 MHz
In order to save observation time and to increase the efficiency of listening for the radio meteor echoes in order to obtain a more complete observation series, I made a modification to the method with the introduction of a definition of “synthetic” hourly rate numbers (Figure 4).
Listening for the radio signals during 10 minutes with extrapolation of the data to 1 hour was done about 3 to 5 times a day. At the times of the maxima of the main meteoroid streams, the counting of meteor echoes was performed on average every 2–3 hours in order to get a better coverage of the observational series. This was done in order to control the level of the hourly rates as well as to distinguish between periods of tropospheric passage, E-layer activity and other natural radio interferences. The total effective observing time was 138 synthetic hours. The calculated hourly rate data are given in order to compare with the hourly activity rate values obtained by the method of automatic hourly signal detection.
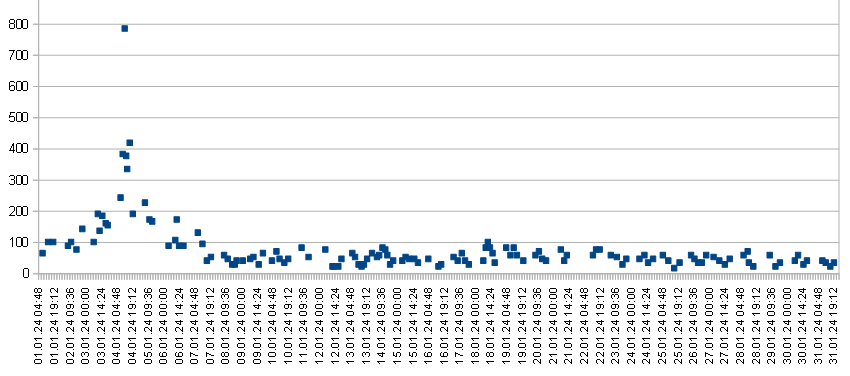
Figure 4 – The result with the calculated hourly numbers of meteor echoes by listening to the radio signals during January 2024.
While there is no confirmation of the significance of QUA’s (#0010) high activity level at around 800 synthetic signals in the following hours, I am confident that I heard brief increased shower activity.
The method of listening by ear is not suitable to detect the time of maximum activity, but it is suitable for determining the approximate level of maximum activity, because very weak signals are detected when listening by ear, which cannot be detected by automatic methods in the FM-band.
5 Method of visual counting of meteor signals in SpectrumLab
Given the very good resolution range of the SpectrumLab program with the new radio receiver, it is very easy to count meteors visually. For the selection of signals in the frequency range 300–1500 Hz I used as criterion a signal length of 5 Hz and a level greater than ~ –48 dB (with an average noise level of about –55 dB). Screenshots in λʘ were saved every 10 minutes. The time resolution is sufficient to detect signals with a duration from 0.5 sec. Figure 5 shows the daily activity of meteor signals after January 12.
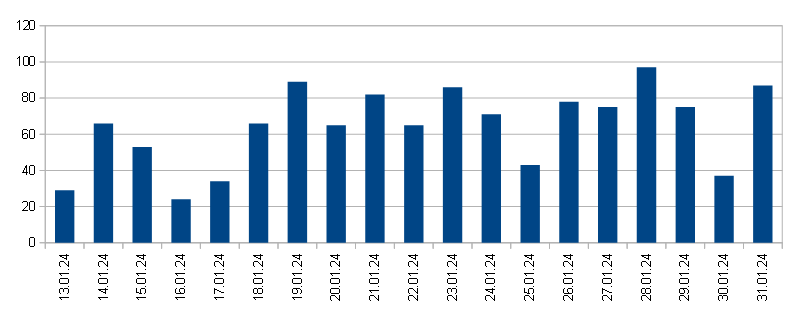
Figure 5 – Daily activity of meteor signals by counting the ehoes visually in SpectrumLab.
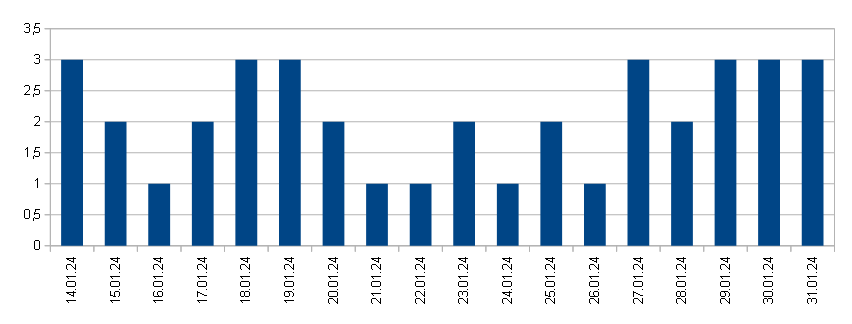
Figure 6 – Daily activity of meteor signals by counting the meteor echoes in SpectrumLab with a duration of the signals from 10 to 60 sec.
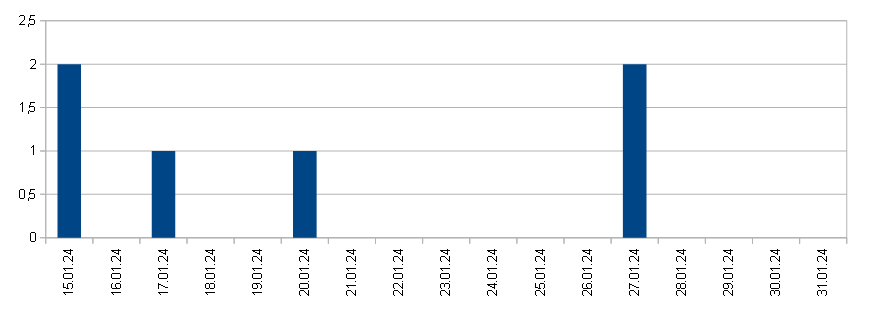
Figure 7 – Daily activity of meteor signals by counting the meteor echoes in SpectrumLab with a duration of signals from 60 seconds and longer.
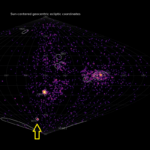
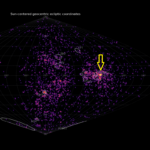
6 Fireballs in the radio band
Phenomena (Figure 10–12) with wide trails and smaller amplitude can occur at long distances, also the signal arrives outside the antenna pattern (e.g., from an easterly direction).
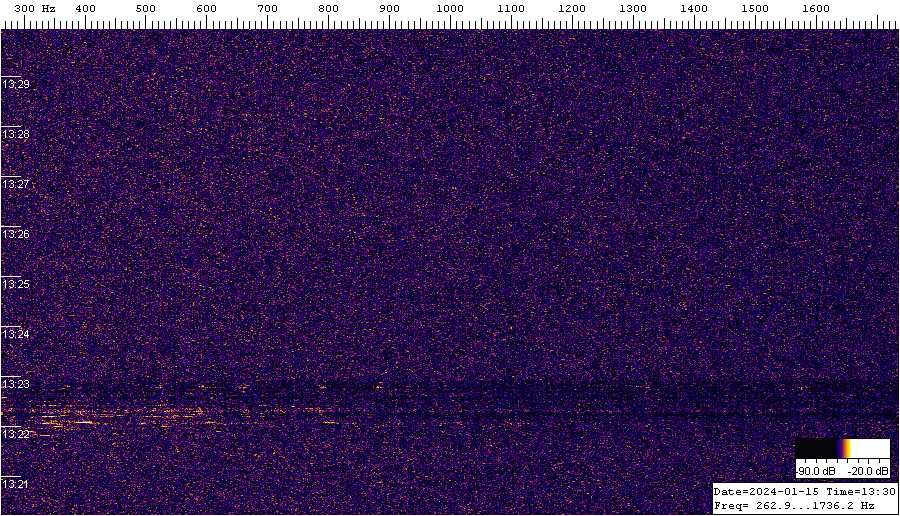
Figure 8 – Fireball 15 January 2024 at 10h22m UT.
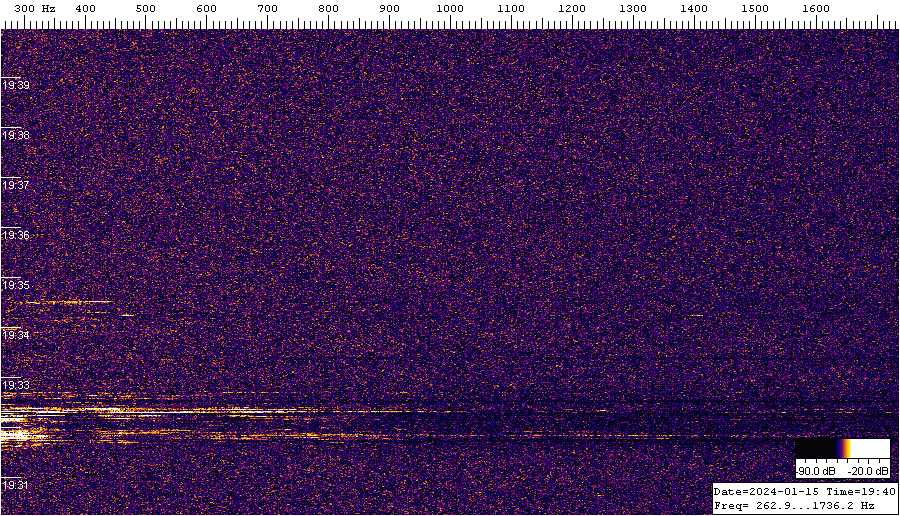
Figure 9 – Fireball 15 January 2024 at 16h31m UT.
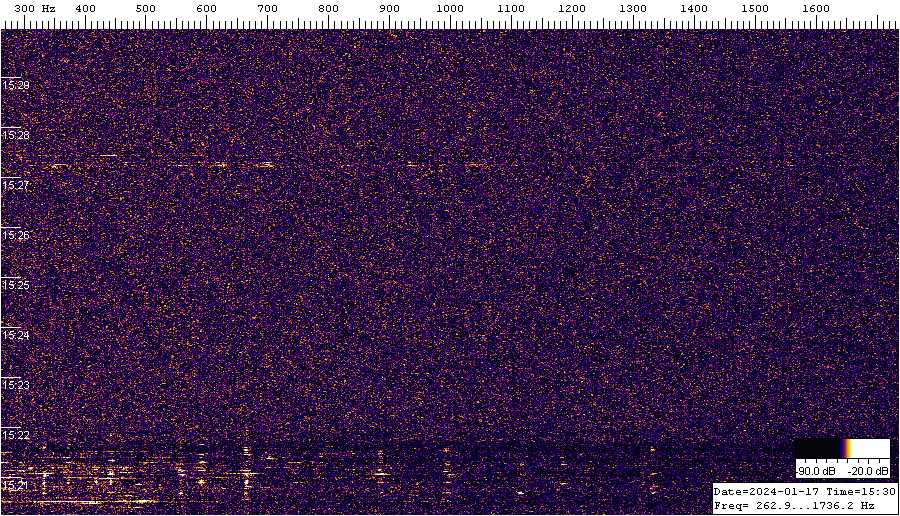
Figure 10 – Firebal 17 January 2024 at 12h21m UT.
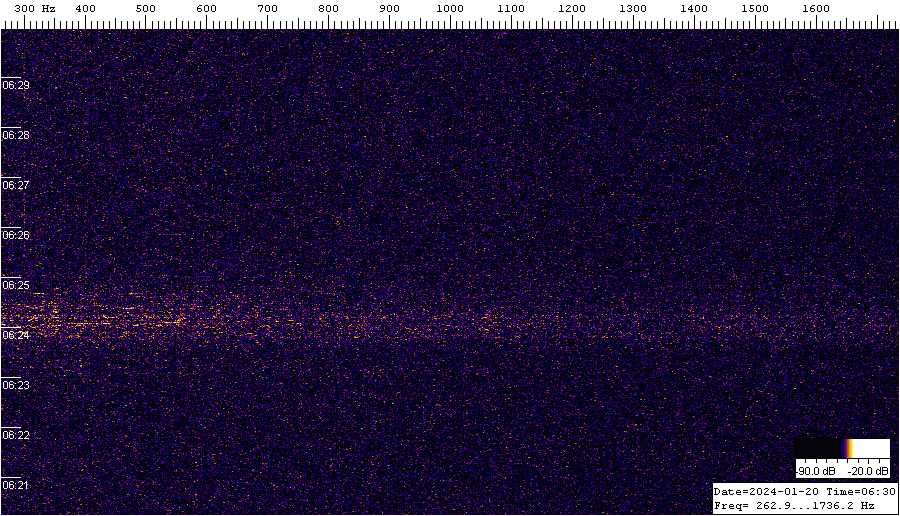
Figure 11 – Firebal 20 January 2024 at 03h24m UT.
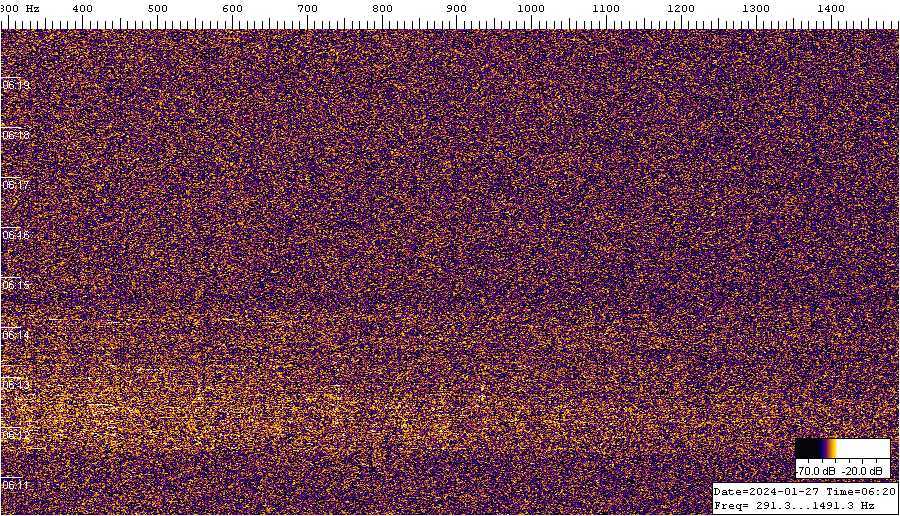
Figure 12 – Firebal 27 January 2024 at 03h14m UT.
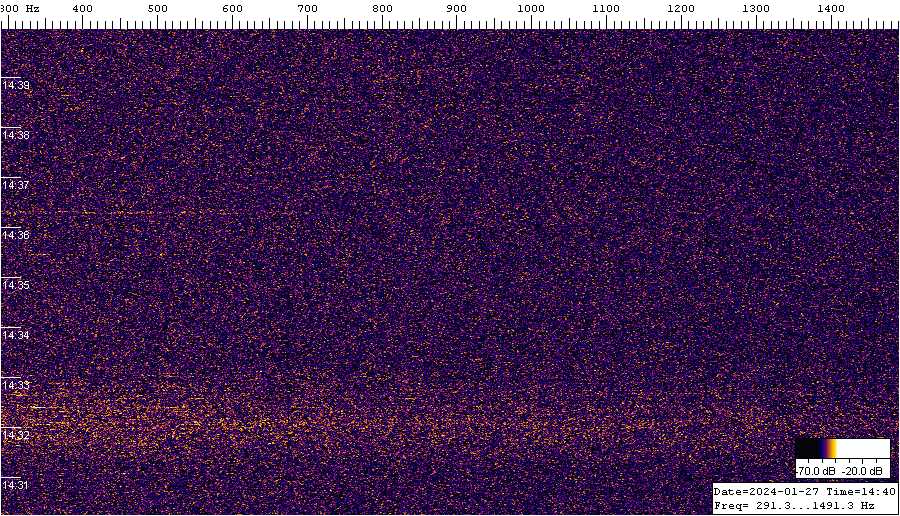
Figure 13 – Firebal 27 January 2024 at 11h32m UT.
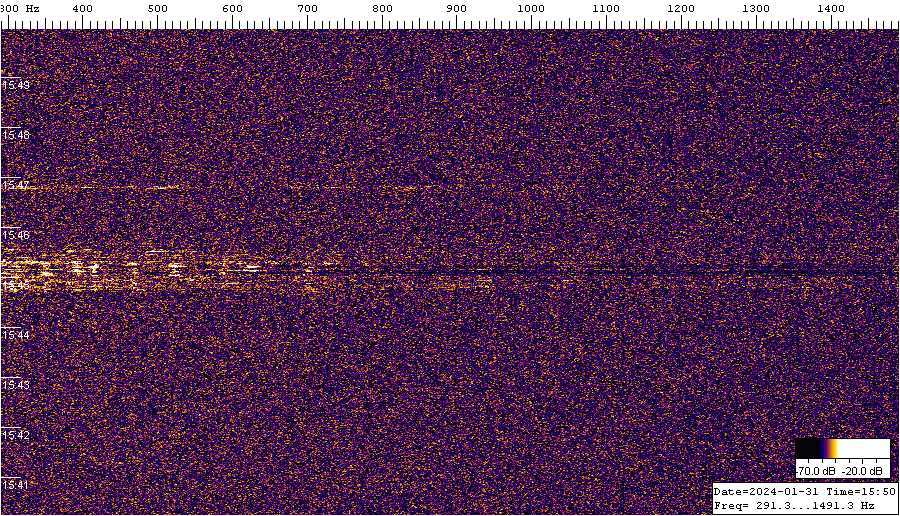
Figure 14 – Fireball 31 January 2024 at 12h45m UT.
7 Conclusion
The method of counting radio meteor echoes by listening is about 3 times more sensitive than the method using automatic detection of meteor echo signals. The method of listening to the radio echoes is very interesting, because it allows you to “scan” the dynamics of the total meteor background over a long time, to identify periods of low activity, periods of high activity, as well as outbursts and the peak activity of the most prominent meteoroid streams. Not all maxima in the meteor shower plots could be classified with known meteor showers from the IMO meteor shower working list data (meteor calendar). Probably some unidentified maxima are the result of some enhanced activity of one shower or a superposition of several minor meteor showers, which are detected by video networks.
Acknowledgment
I would like to thank Sergey Dubrovsky for the software he developed for data analysis and processing of radio observations (software Rameda). I thank Carol from Poland for the Metan software. Thanks to Paul Roggemans for his help in the lay-out and the correction of this article.
References
Rendtel J. (2024). “Meteor Shower Calendar”. IMO.