Abstract: An overview of the radio observations during July 2023 is given.
The graphs show both the daily totals (Figure 1) and the hourly numbers (Figure 2) of “all” reflections counted automatically, and of manually counted “overdense” reflections, overdense reflections longer than 10 seconds and longer than 1 minute, as observed here at Kampenhout (BE) on the frequency of our VVS-beacon (49.99 MHz) during the month of July 2023.
The hourly numbers, for echoes shorter than 1 minute, are weighted averages derived from:

While local interference and unidentified noise remained low, on 11 days lighting activity was recorded here and solar activity produced strong noise almost daily. Some examples are attached (Figure 3).
General meteor activity was quite high, with some nice showers and a marked increase towards the end of the month.
Over the entire month, 8 reflections longer than 1 minute were observed. A selection of these is included along with some other interesting “epsilons” (Figures 4 to 16). Many more of these are available on request.
In addition to the usual graphs, you will also find the raw counts in cvs-format from which the graphs are derived. The table contains the following columns: day of the month, hour of the day, day + decimals, solar longitude (epoch J2000), counts of “all” reflections, overdense reflections, reflections longer than 10 seconds and reflections longer than 1 minute, the numbers being the observed reflections of the past hour.
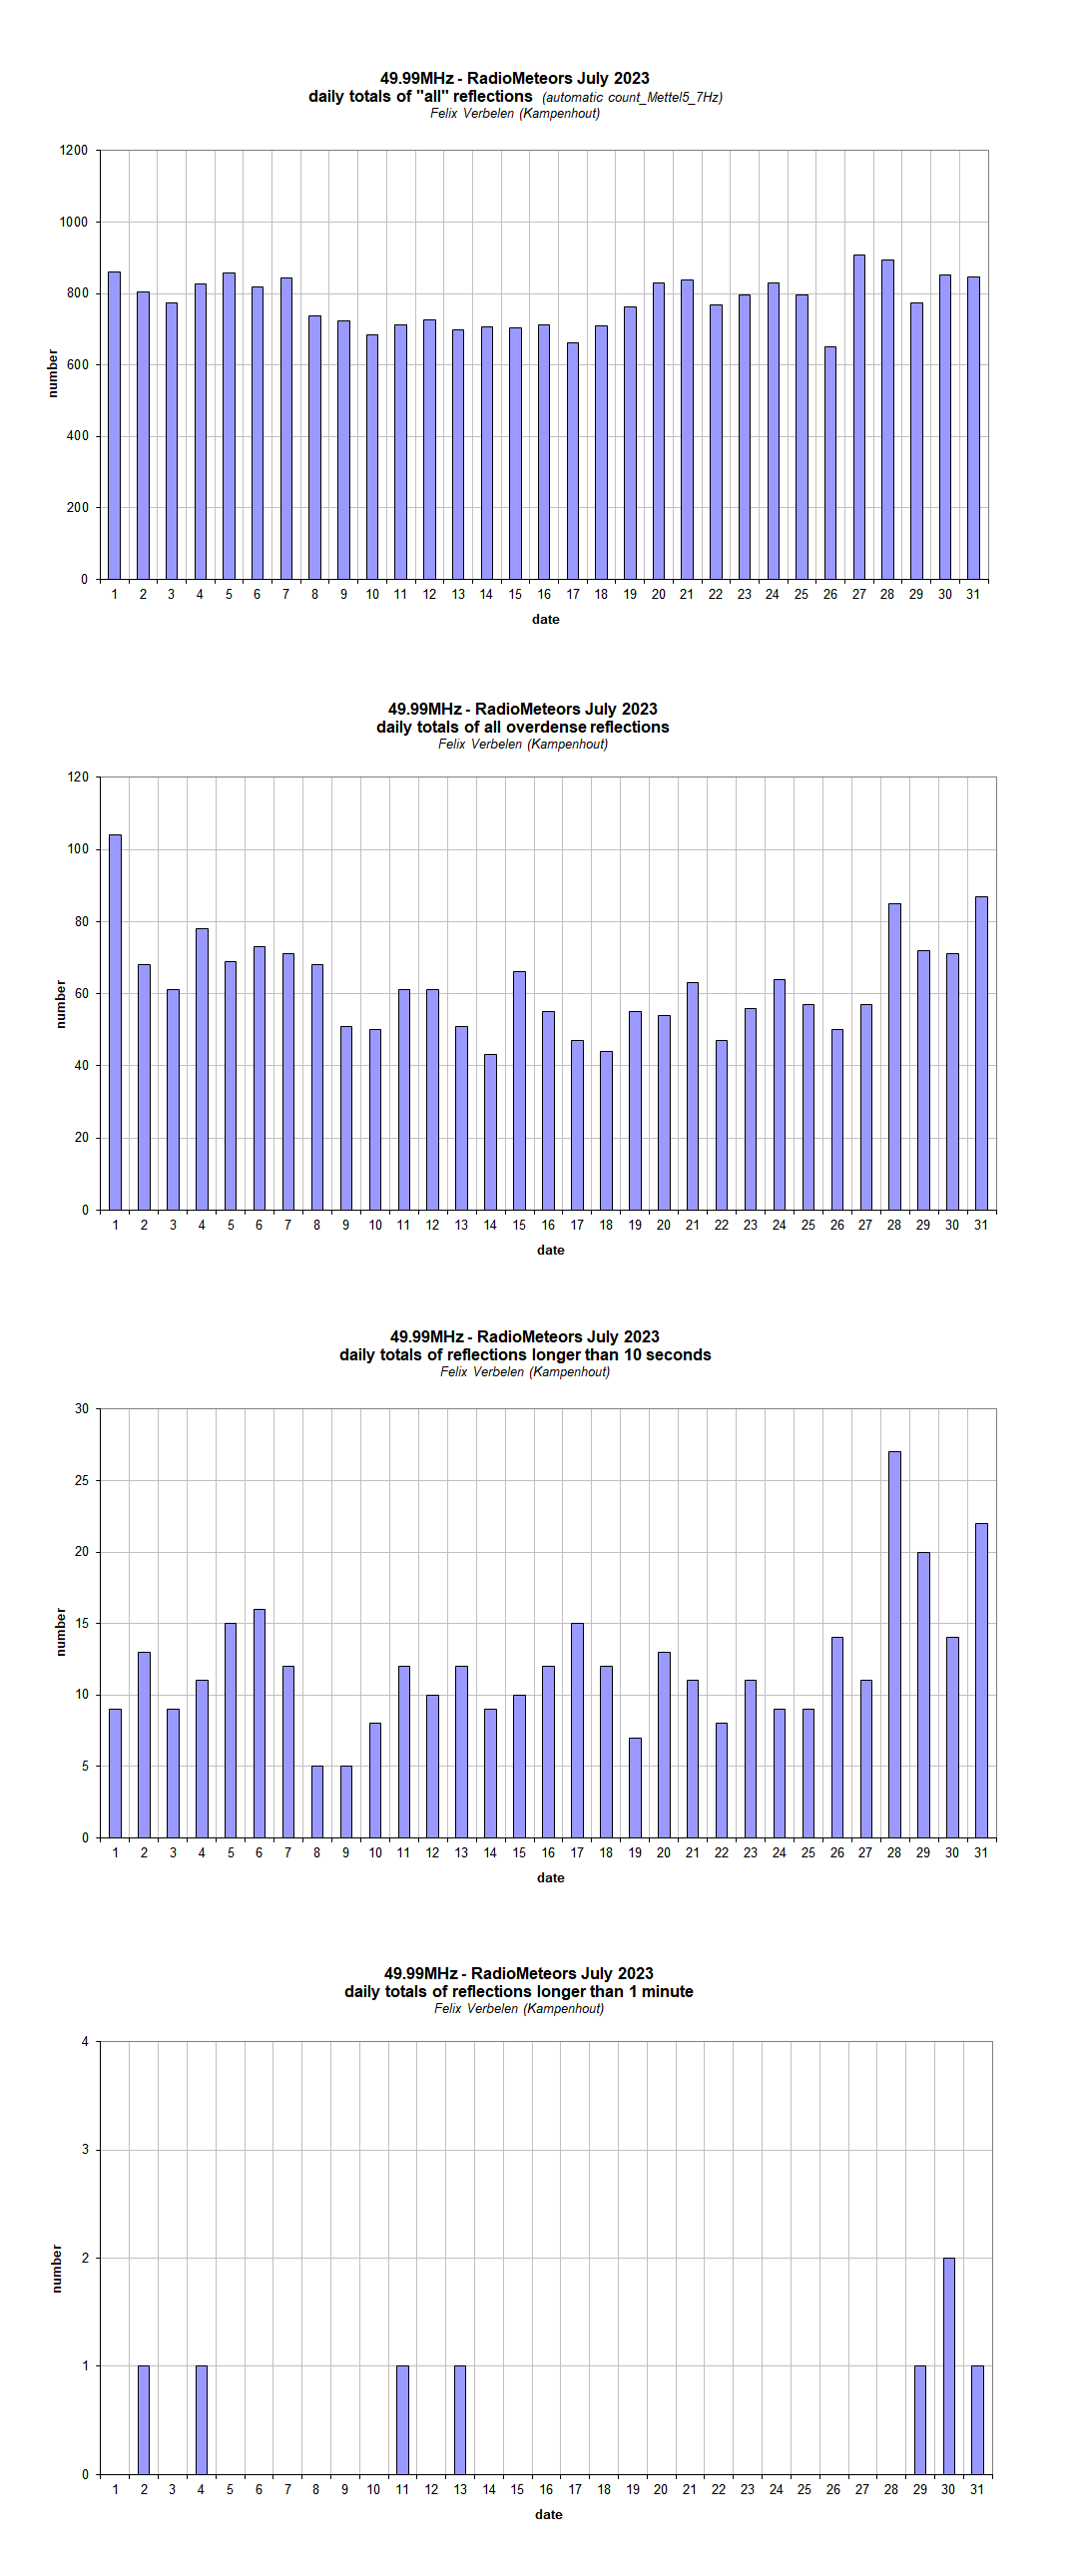
Figure 1 – The daily totals of “all” reflections counted automatically, and of manually counted “overdense” reflections, as observed here at Kampenhout (BE) on the frequency of our VVS-beacon (49.99 MHz) during July 2023.
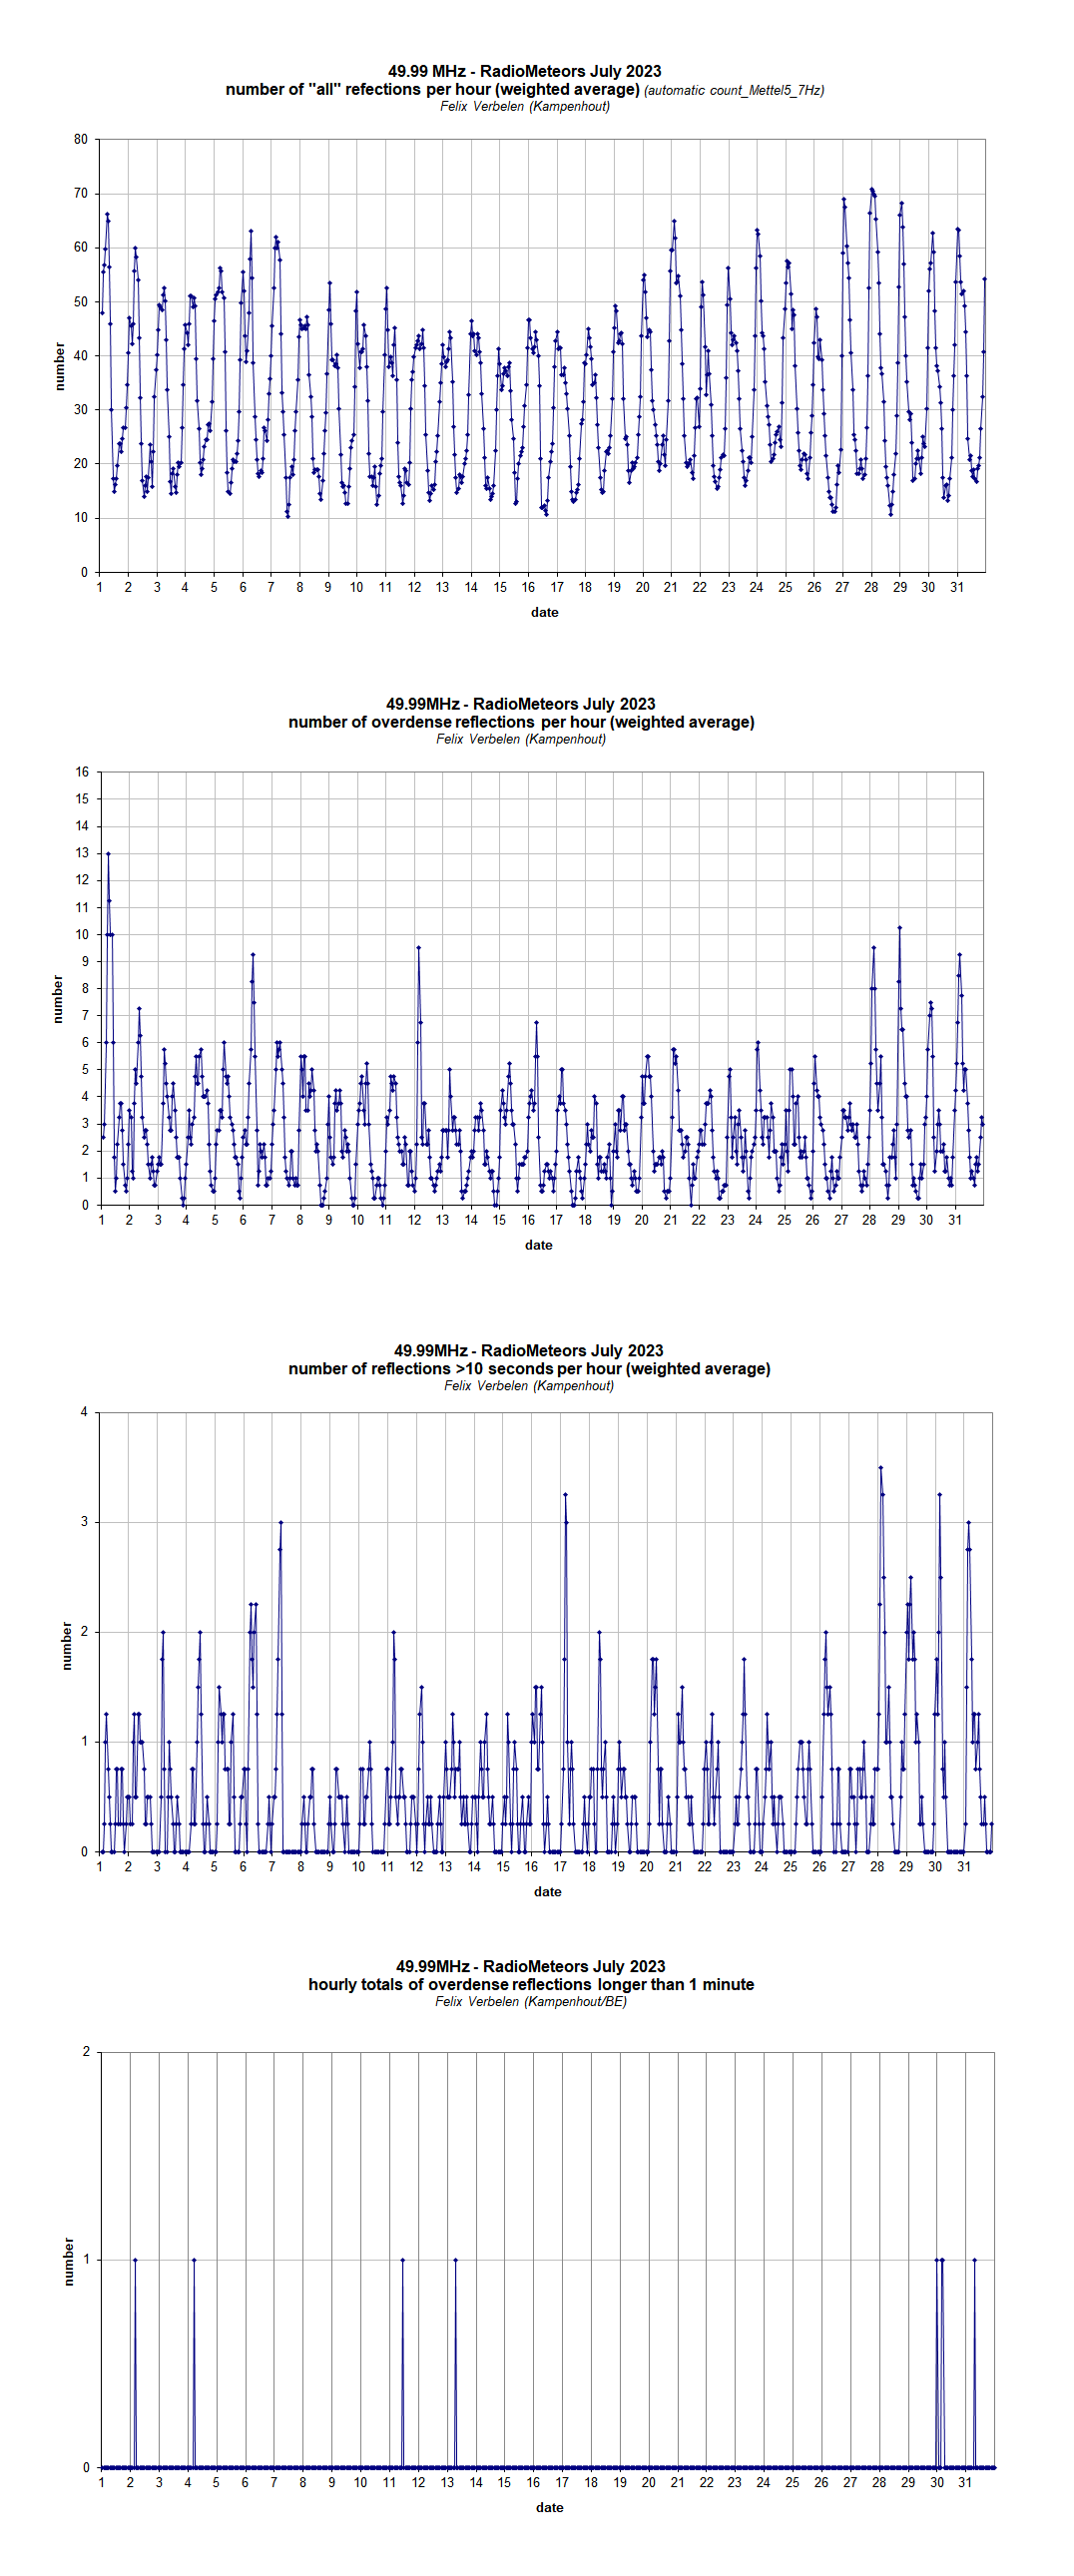
Figure 2 – The hourly numbers of “all” reflections counted automatically, and of manually counted “overdense” reflections, overdense reflections longer than 10 seconds and longer than 1 minute, as observed here at Kampenhout (BE) on the frequency of our VVS-beacon (49.99 MHz) during July 2023.
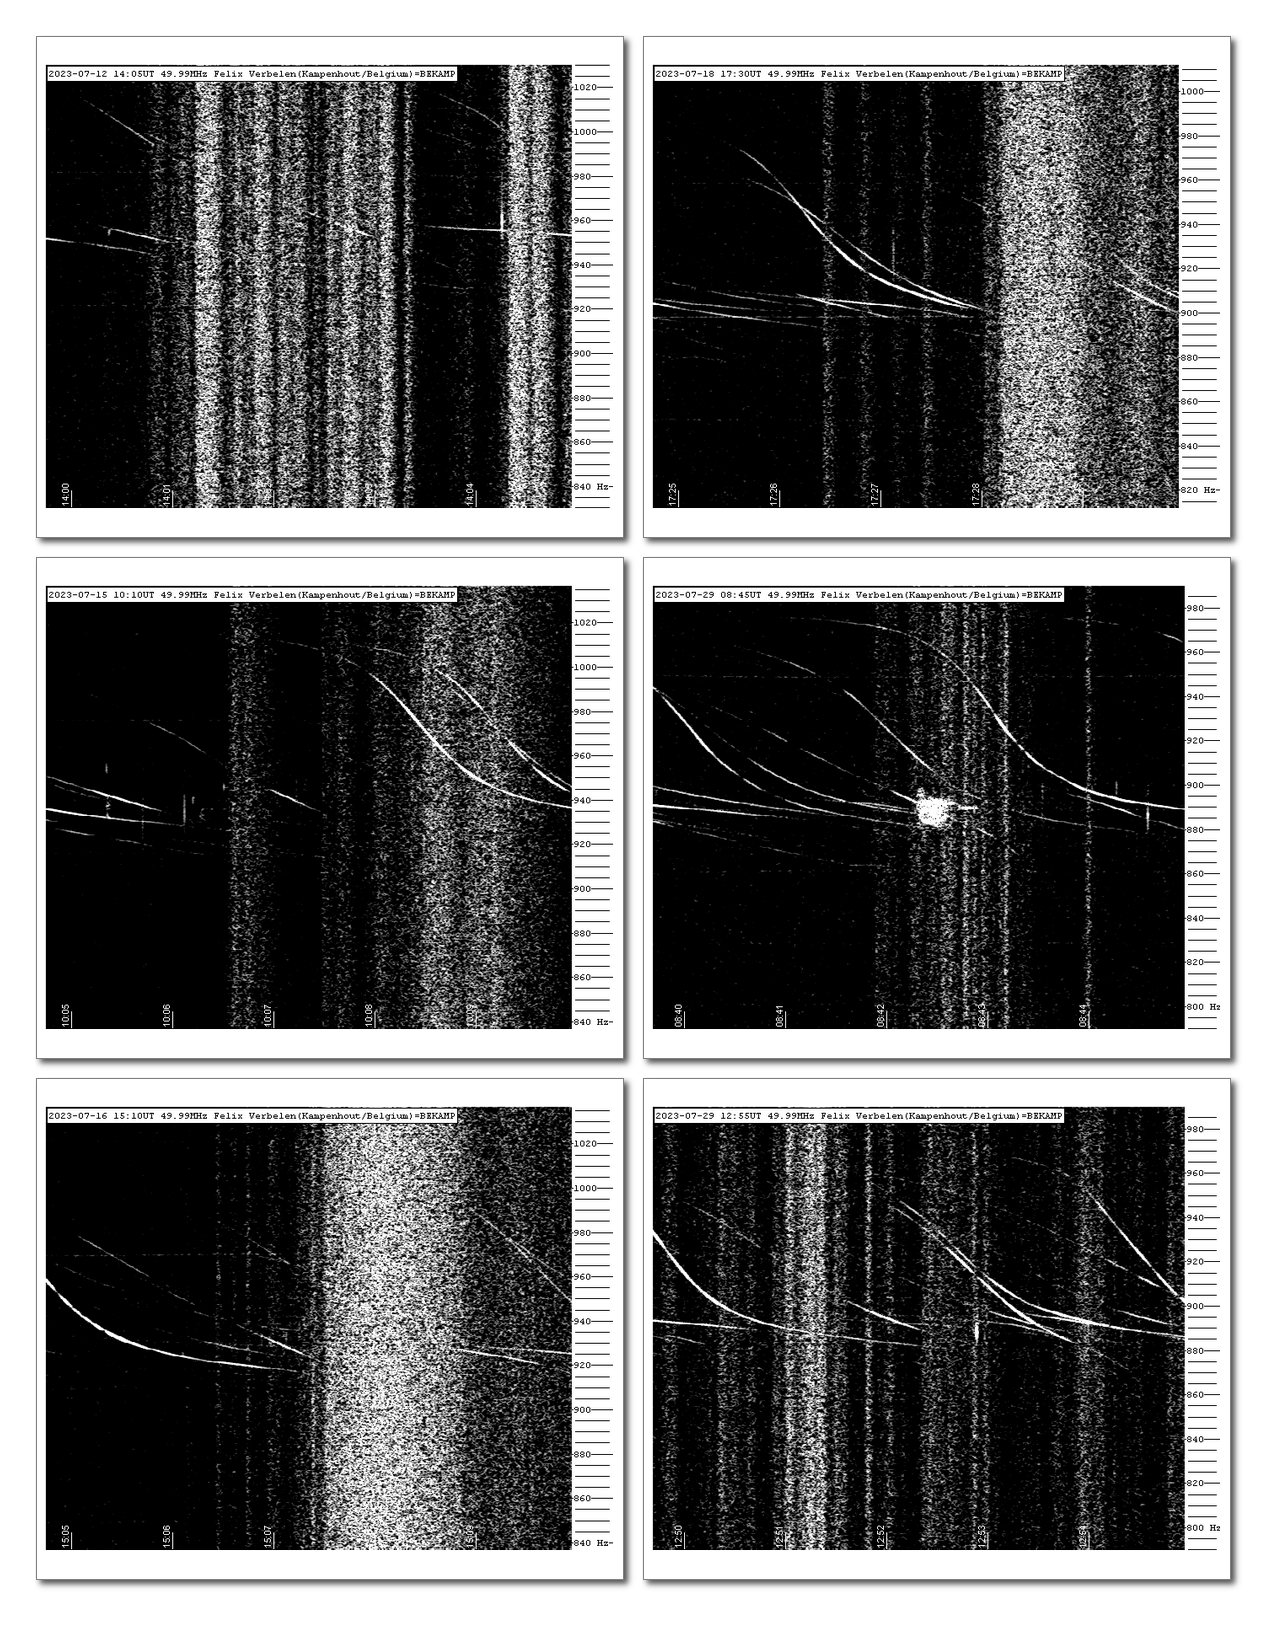
Figure 3 – Lightning on 20 July 2023.
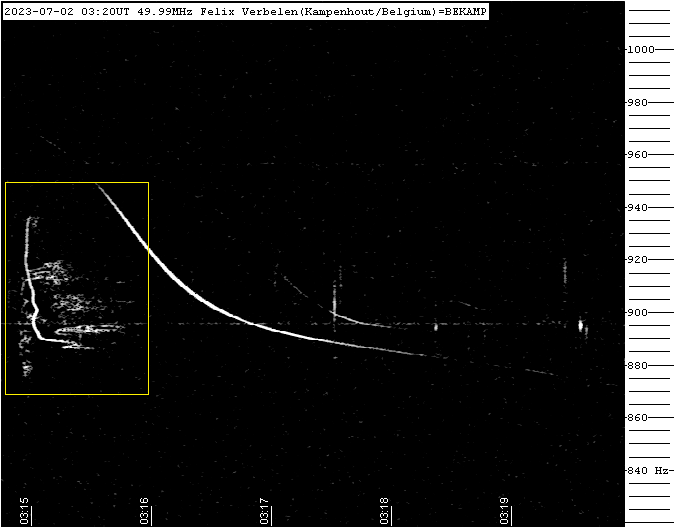
Figure 4 – Meteor echo 2 July 2023, 3h20m UT.
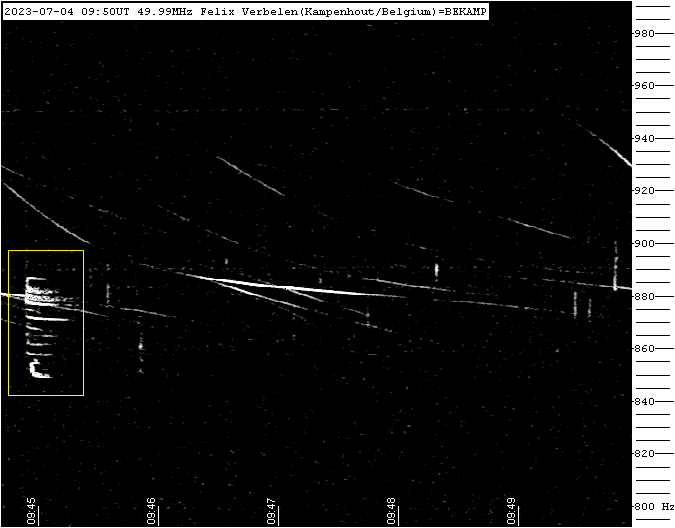
Figure 5 – Meteor echo 4 July 2023, 9h50m UT.
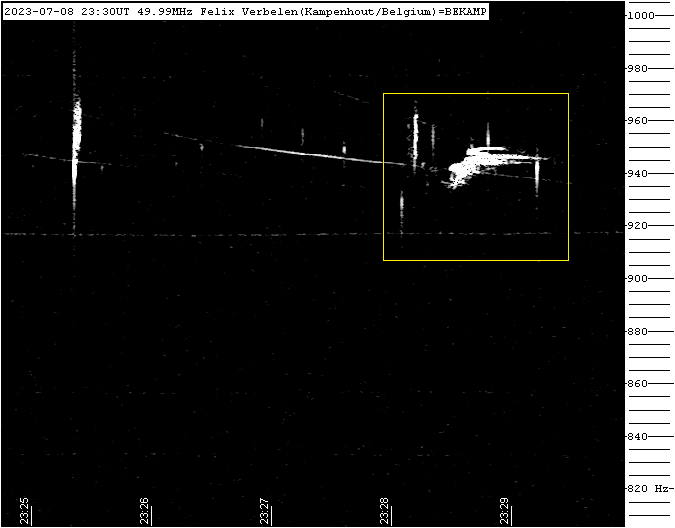
Figure 6 – Meteor echo 8 July 2023, 23h30m UT.
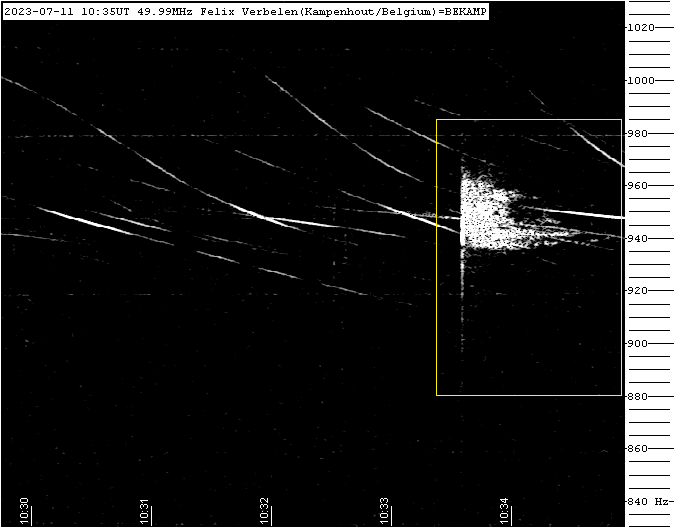
Figure 7 – Meteor echo 11 July 2023, 10h35m UT.
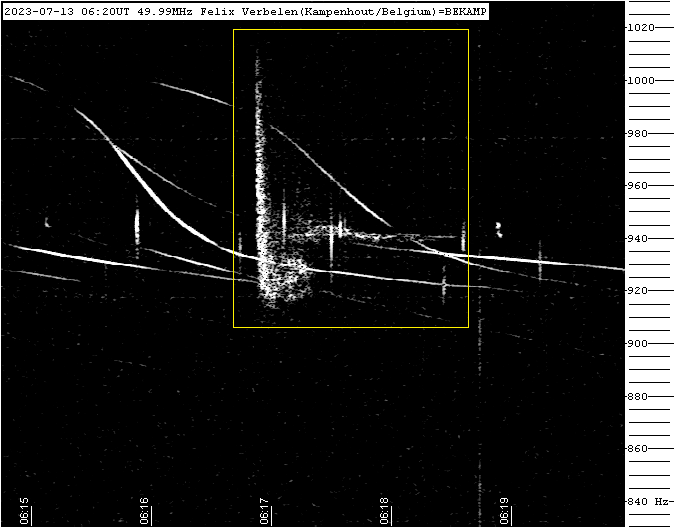
Figure 8 – Meteor echo 13 July 2023, 6h20m UT.
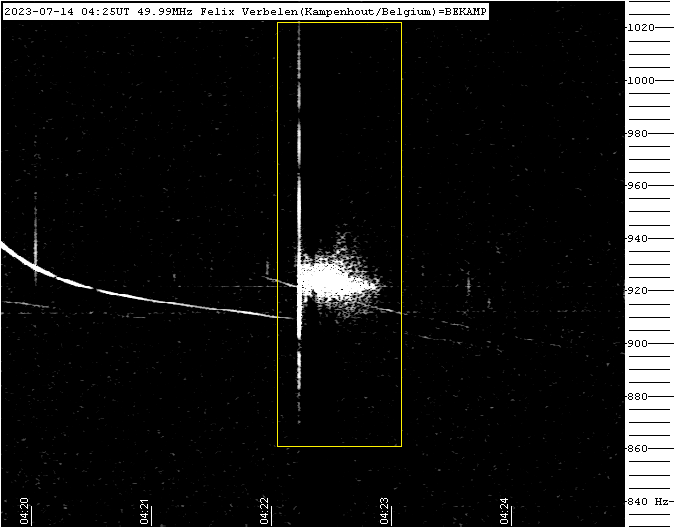
Figure 9 – Meteor echo 14 July 2023, 4h25m UT.
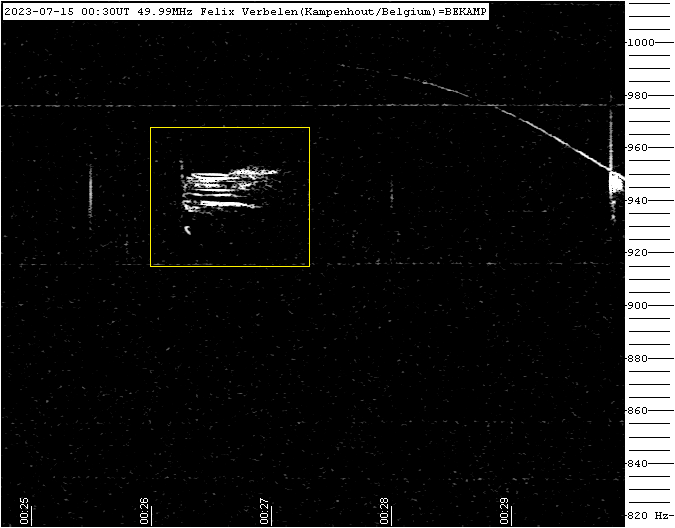
Figure 10 – Meteor echo 13 July 2023, 6h20m UT.
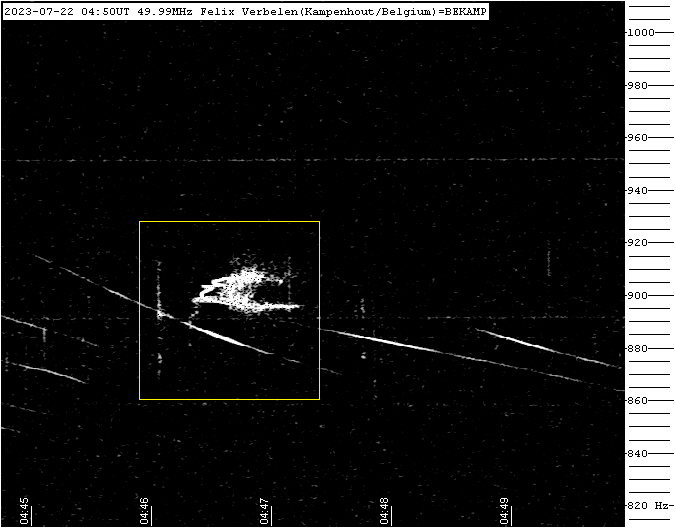
Figure 11 – Meteor echo 22 July 2023, 4h50m UT.
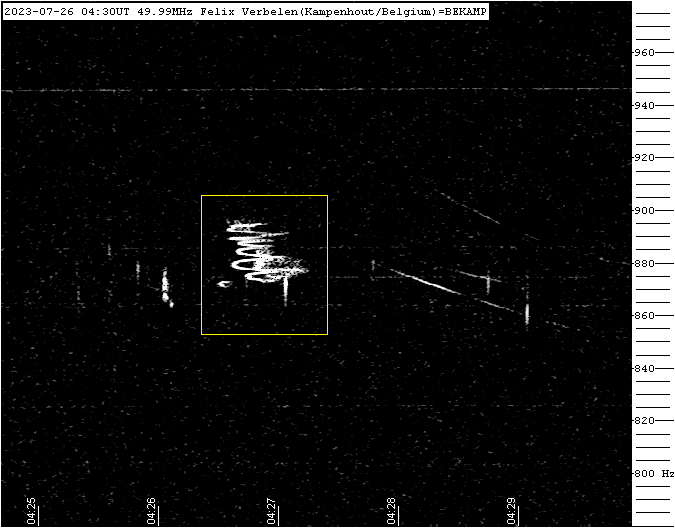
Figure 12 – Meteor echo 26 July 2023, 4h30m UT.
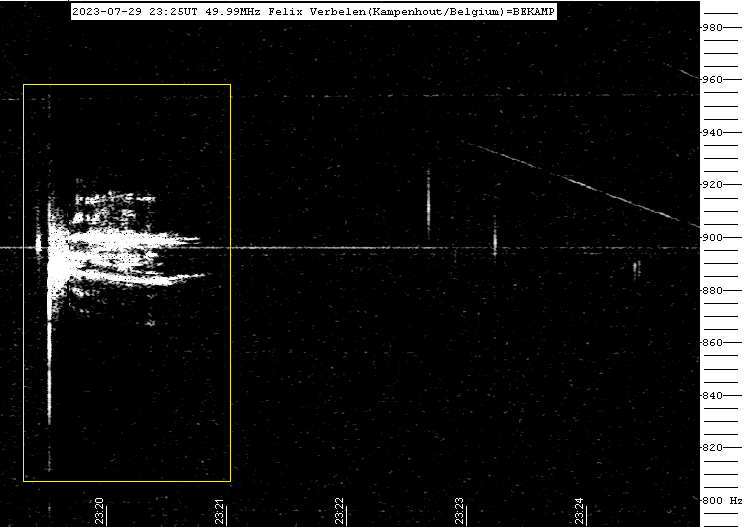
Figure 13 – Meteor echo 29 July 2023, 23h25m UT.
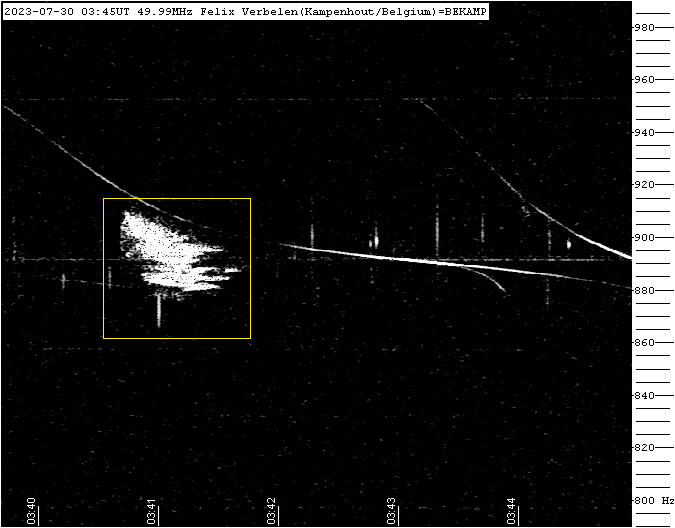
Figure 14 – Meteor echo 30 July 2023, 3h45m UT.
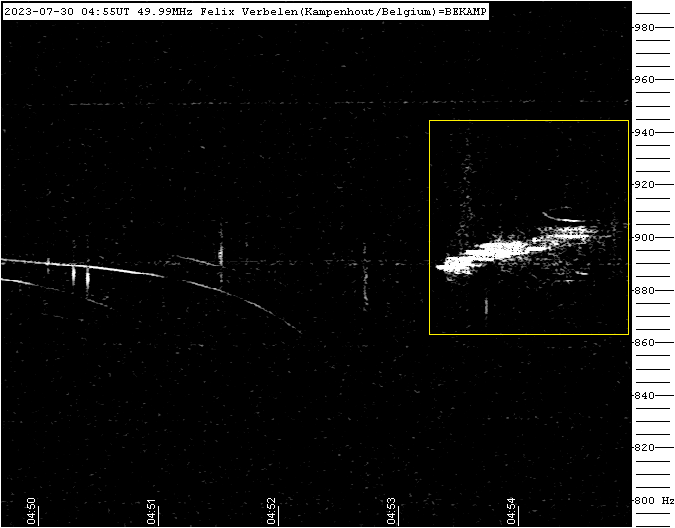
Figure 15 – Meteor echo 30 July 2023, 4h55m UT.
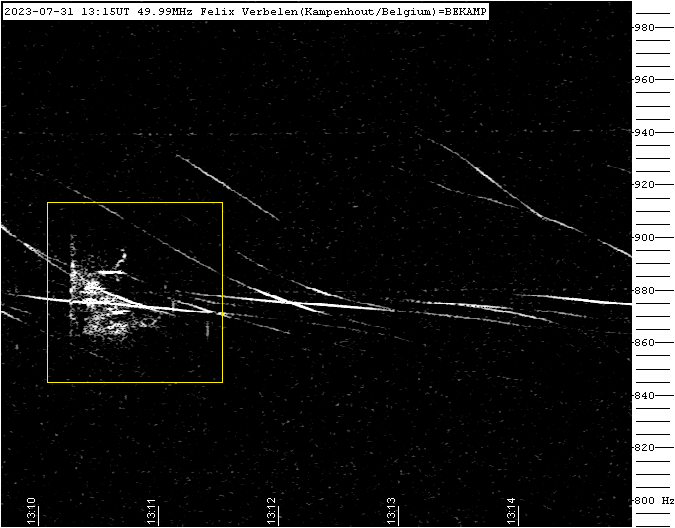
Figure 16 – Meteor echo 31 July 2023, 3h15m UT.



Hallo Felix,
I have followed your newsletter for some time and often wonder what can be made of the various counts of duration length, underdense, overdense etc. Have they been compared, for example with other years to see if they are prevalent during particular meteor showers or seasons?
Thanks
Mike
Hello Mike,
Thank you for your message!
A lot of follow-up has been done on the basis of the counts and quite some interesting results came out, but most of it has not yet been published for lack of time…
I hope to improve this, but in the meantime the counts were made available so that others could use them for further research.
Kind regards.
Felix
Hi Felix,
Thank you for the interesting articles.
I have a question about the extra curves I see next to the meteor blobs.
They seem to have a ‘z’ form and are showing a frequency trail from high to low over time.
Do you know what causes these ” whistlers”?
Michiel
parac.eu
Hi Felix and all,
I cannot find my previous question/reply anymore.
However, the answer to my question is; reflections from airplanes.
Michiel
parac.eu