Abstract: We confirm the validity of video observations to get the magnitude ratio of meteor showers by calculating the ratio of shower meteors to sporadic meteors. The magnitude ratios obtained from the Global Meteor Network are a little bit higher than those of SonotaCo net. The difference in cameras and in photometry may explain the difference, but the sequences of the magnitude ratios are well matched in each group. The research on the property of a meteor shower should be done carefully by a reclassification of meteors.
1 Introduction
We studied 14 major meteor showers (Koseki, 2023) using SonotaCo net data (SonotaCo, 2009 and SonotaCo et al, 2021). It is very interesting and important to compare them with Global Meteor Network data (Vida et al., 2019; 2020; 2021). We can get similar results of course but recognize interesting differences. It does not seem to be meaningful to repeat the common points. We will focus on the differences, limiting the similarities only to some examples.
2 General view
This study intends to compare the results obtained by the Global Meteor Network data with SonotaCo net. The method of the analysis should be the same and the readers interested in this are requested to refer to previous publication (Koseki, 2023). We showed three types of graphs: the distribution of the relative number of shower meteors to sporadic meteors, the activity graph with the change of the mean magnitude, and the beginning height comparison (Koseki, 2023). The observations of GMN cover a rather short period of 2018–2023 (used data downloaded 2023 February 25) and, therefore, this dataset does not include the enhanced activity of the Orionids. The Southern Taurids (SE component) showed enhanced activity in 2022 while GMN data has been rapidly increasing, so that STA data are biased. There are minor differences due to different conditions like this, but basically, the results are very similar.
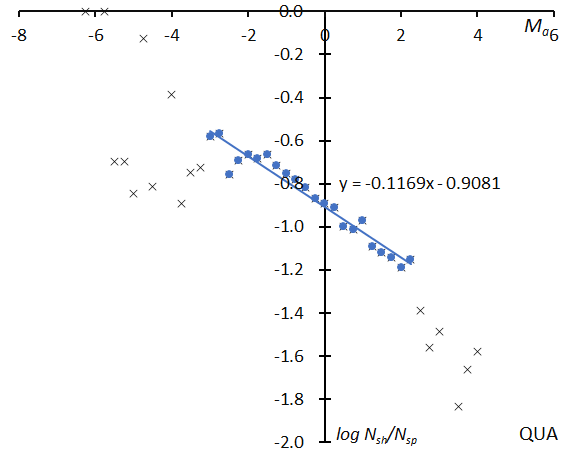
Here, we will only compare the GMN results with the previous example (Figure 1~3, Quadrantids). Figure 1 shows the distribution of the relative number of shower meteors to sporadic meteors; at top the result for GMN and at bottom for the SonotaCo net. The slopes of the graphs seem somewhat different, but we see these might change when we select a different range for determining them. Figure 2 gives the activity graph with the change in the mean magnitude. The activity and the mean magnitude differ a little bit; the causes will be discussed later. Figure 3 shows the beginning height comparisons; they are very similar, though the Quadrantids by the Global Meteor Network appear concentrated in narrower magnitude range.
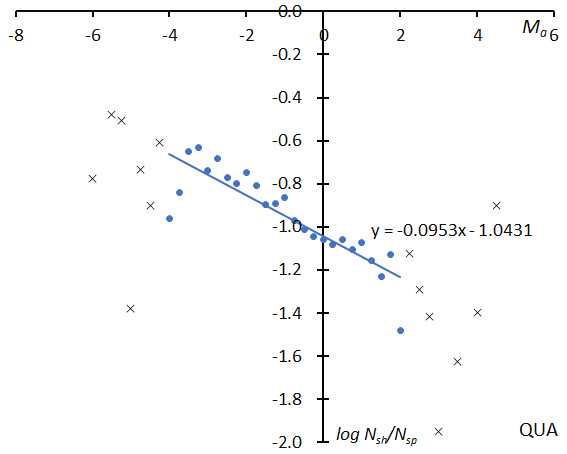
Figure 1 – The distribution of the logarithm of the relative number of Quadrantid meteors to sporadic meteors. GMN (top), SonotaCo net (bottom).
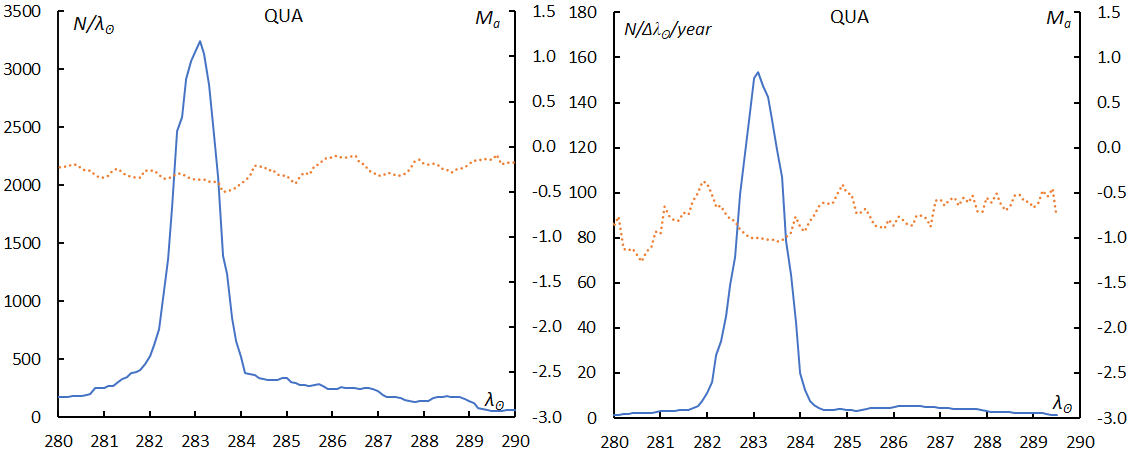
Figure 2 – The sliding mean of the number of Quadrantids (solid blue line) and of the absolute magnitude (dotted orange line) using a 1 solar longitude bin. left: GMN and right: SonotaCo net; the number is divided by the number of years of observations.
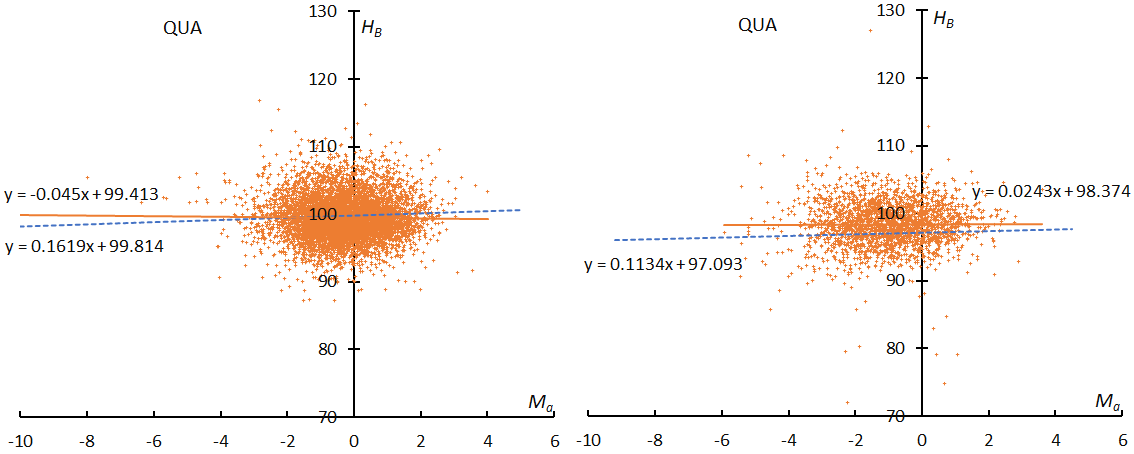
Figure 3 – The result of the linear regression for sporadic meteors is shown as a dashed line, that of the Quadrantids as a solid line. At left: GMN, right: SonotaCo net.
Table 1 – Comparison of the magnitude ratio obtained by this study with SonotaCo net results. Slope and r-values are shown each upper row for GMN and lower SonotaCo net, and the bottom is the magnitude ratio from the meteor calendar 2023 of IMO (Rendtel, 2022).
| Shower | QUA | LYR | ETA | SDA | CAP | PER | ORI | _SE | _SF | NTA | LEO | HYD | GEM | COM |
| slope | -0.117 | -0.149 | 0.084 | -0.112 | -0.159 | -0.216 | -0.03 | 0.074 | -0.245 | -0.055 | -0.151 | -0.094 | -0.226 | -0.175 |
| -0.095 | -0.161 | -0.007 | -0.076 | -0.161 | -0.196 | -0.036 | 0.076 | -0.146 | -0.063 | -0.167 | -0.06 | -0.1 | -0.083 | |
| r | 3.09 | 2.98 | 5.69 | 3.12 | 2.53 | 2.73 | 4.36 | 4.48 | 2.15 | 3.32 | 3.38 | 3.63 | 2.32 | 3.08 |
| 2.81 | 2.51 | 4 | 2.93 | 2.17 | 2.49 | 3.75 | 3.89 | 2.33 | 2.81 | 2.84 | 3.42 | 2.68 | 3.31 | |
| IMO | 2.1 | 2.1 | 2.4 | 2.5 | 2.5 | 2.2 | 2.5 | 2.3 | 2.3 | 2.5 | 3 | 2.6 | 3 |
In the following sections, we will discuss some small but interesting differences.
3 Magnitude ratio
We studied the ratio of shower meteors to sporadic meteors instead of the perception coefficient and showed we could calculate the magnitude ratio using the ratio of shower meteors relative to sporadic ones (Koseki, 2023). It is necessary to investigate how the magnitude ratio of sporadic meteors changes with the geocentric velocity. We divided sporadic meteors into 14 groups with 10 km/s bins in geocentric velocity overlapping 5 km/s each, vg < 15, 10 < vg < 20, 15 < vg < 25, and so on.
Figure 4 shows changes in the slopes of the logarithm distribution in the different magnitude ranges along with the geocentric velocity. We select the slope of the range Ma = –6~–3 as we did in the case of SonotaCo net data; there is some question as to whether the range can be fixed, which we will discuss in more detail later. Table 1 compares the results of this study with the former results of SonotaCo net data. We use the shower classification listed in the GMN database except for Taurids (STA and NTA). Southern Taurids should be divided into two components, that is, ‘Steady Expression’ (_SE) and ‘Sharply Fluctuating’ (_SF); Table 1 shows the clear difference between them. We, therefore, classified three components of Taurids by ourselves; We realized then that there was a big problem with the classification of Taurids in GMN, which we will discuss later.
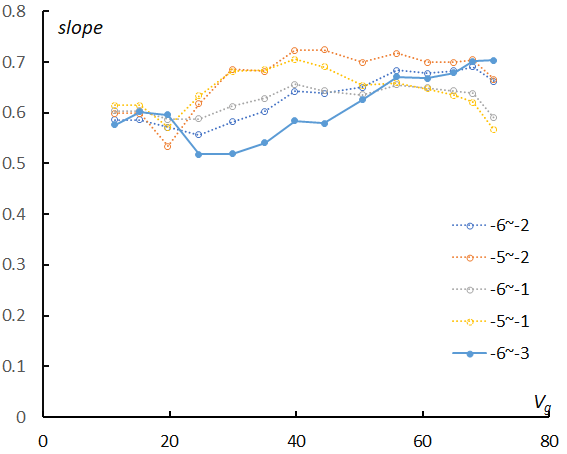
Figure 4 – Changes in the slopes in function of the geocentric velocity. The values of the slopes for the most plausible range –6 < Ma < –3 are connected with a bold line.
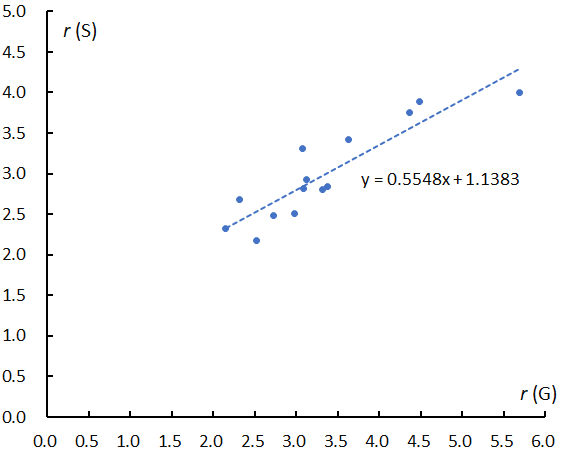
Figure 5 – The relation between the magnitude ratios obtained by GMN and by SonotaCo net (Table 1).
The slopes of the logarithm distribution as shown in Figure 1 for example are listed in Table 1 upper row for GMN and lower row for SonotaCo, and the same for the estimated magnitude ratios. Though GMN estimates are higher than SonotaCo net’s, the magnitude relation of the magnitude ratio of each group is almost the same (Figure 5).
The tendency for the GMN results to increase will be discussed in more detail later, but here we give some notes on the differences seen in Table 1.
The magnitude ratio and the mean magnitude become lower around the shower maximum. GMN observations used here are shorter periods than those of SonotaCo net and GMN data are rapidly increasing. If GMN observers missed the shower maximum in 2022 the most fruitful year or had the maximum, the magnitude ratio obtained here might be biased not only in the case of STA but also other showers.
3.1. Discrepancy of observational time zone and maximum
Figure 6 shows the numbers of shower meteors in function of the solar longitude separately per year. GMN missed the Quadrantids maximum in 2022 (Figure 6, top) and covered the Geminids in 2022 (Figure 6, bottom). The magnitude ratio of the Quadrantids (Table 1) might be biased by meteors observed in 2022 before and after the maximum. On the contrary the Geminid maximum was covered in 2022 and, therefore, the magnitude ratio of the Geminids (Table 1) might be underestimated by meteors which have a lower magnitude ratio at the maximum. This causes the magnitude ratio of Geminids obtained by GMN to be lower than that of SonotaCo net.
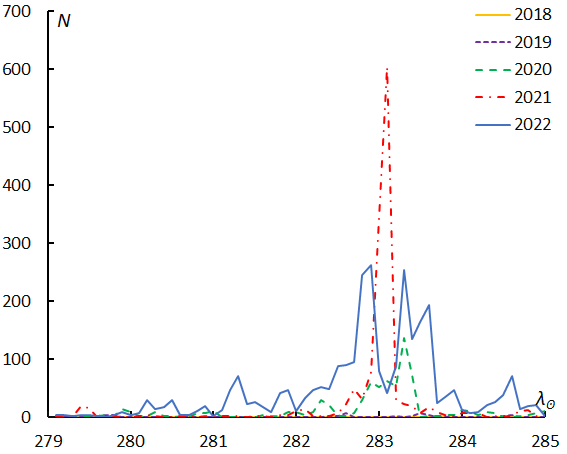
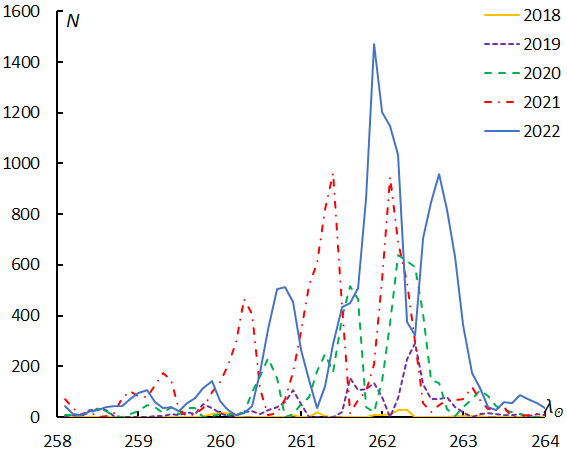
Figure 6 – Changes in the observed shower meteors by year. Quadrantids (top), Geminids (bottom) according to GMN.
The magnitude ratio of STA_SF is also lower than that of SonotaCo net. The reason is similar to the Geminids case because GMN covered the enhanced activity of STA_SF in 2022; Table 1 lists the magnitude ratio of the regular year of STA_SF for the SonotaCo net and the GMN result is lower than that for the SonotaCo net.
2.2. Shower classification
Figure 7 (top) Quadrantids and (bottom) Geminids are the radiant distribution compensated for their radiant drift: each figure includes the period of each classified shower member recognized. Quadrantids (Figure 7, top) are contaminated by DAD and BBO. DAD interferes with one-third of the Quadrantids in the case of SonotaCo net, but SonotaCo net changed their definition of the shower table recently and this overlap has been resolved.
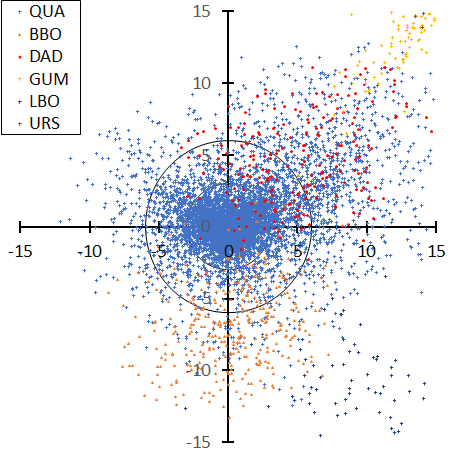
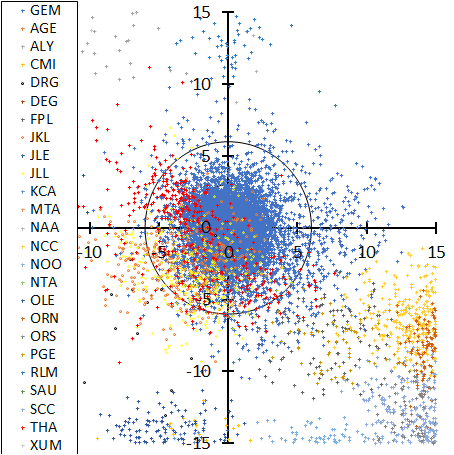
Figure 7 – Radiant distribution centered at the result of the regression analysis for the radiant drift according to GMN. Quadrantids (top), Geminids (bottom). The periods of the figures drawn here are selected between their earliest classified meteor and the last one, that is, 264.69° < λʘ < 298.41° for the Quadrantids and 239.7° < λʘ < 295.88° for the Geminids.
The radiant distribution of the Geminids (Figure 7, bottom) is complex; four minor showers overlap it (DRG, JKL, JLL, and THA). We pointed out already that DRG is at the outskirt of the velocity distribution of the Geminids and THA might be the early activity of the Geminids (Koseki, 2018). JKL and JLL seem to be sporadic activities, or the outskirt of the Geminids as seen on the opposite side of the radiant distribution.
We use unique classification for the three Taurid activities; there are confusing situations, and we will return to the shower classification problems later.
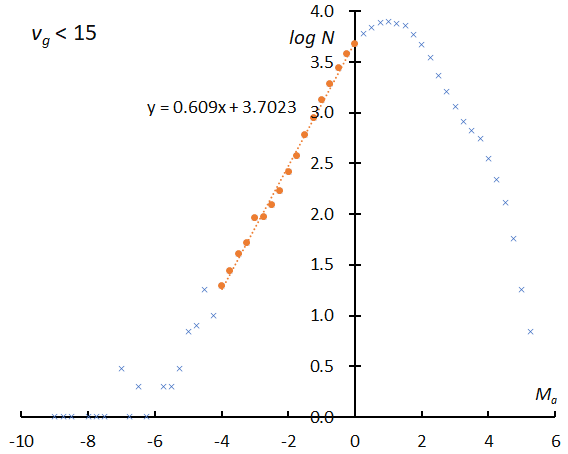
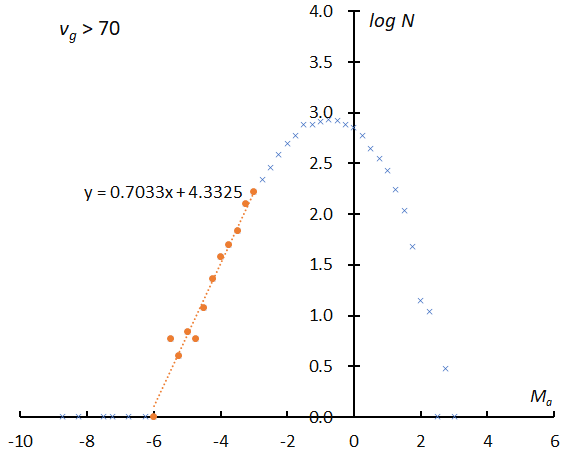
Figure 8 – The logarithm distribution of the number of sporadic meteors against absolute magnitude Ma. vg < 15 km/s (top), vg > 70 km/s (bottom) according to GMN.
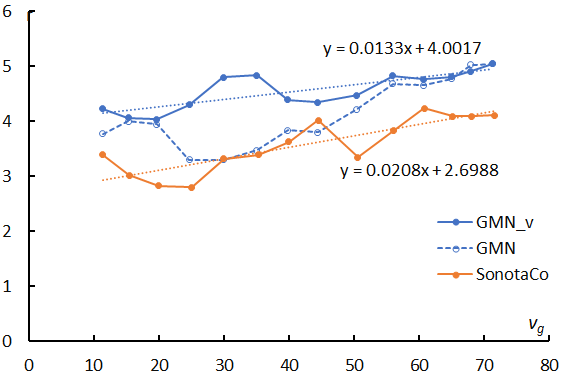
Figure 9 – Changes in the slopes in function of the geocentric velocity. The line ‘GMN_v’ (blue solid) is obtained by the varied range of magnitude according to the change of perception.
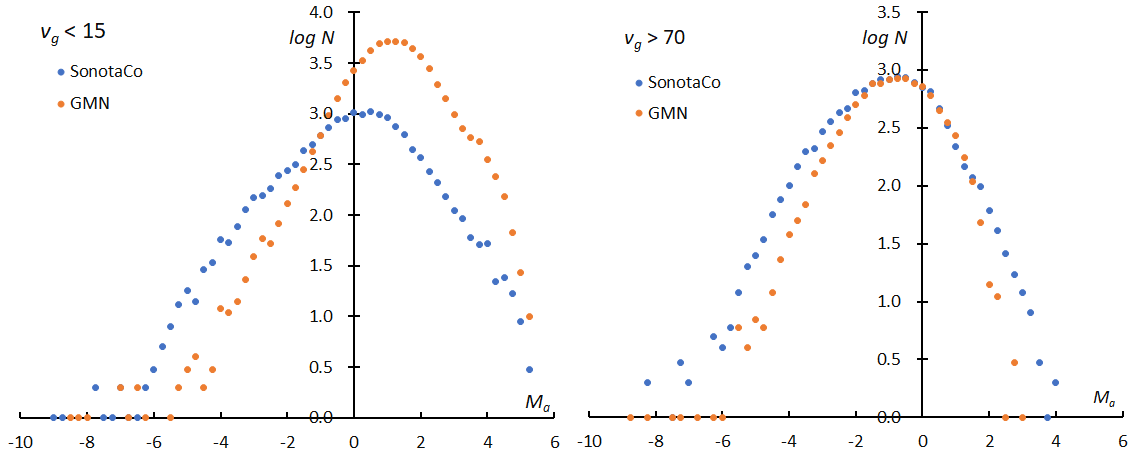
Figure 10 – The logarithm distribution of the number of sporadic meteors against the absolute magnitude Ma; SonotaCo net results (blue filled circle) are added to Figure 7. left: vg < 15 km/s, right: vg > 70 km/s.
4 Discussions
4.1. Perception with velocity
If observations can catch all meteors, the logarithmic distribution would become a straight line. Figure 8 clearly shows the perception changes with velocity as the perception in the slower range is higher than in the faster range. Almost all meteors of the –2nd magnitude could be recorded in Figure 8 (top) but is missing several percentages in Figure 8 (bottom). We selected the slope of the range as Ma = –6~–3 and calculated the magnitude ratio (Table 1). If we changed the range for calculating the sporadic magnitude ratio as shown in Figure 8 in every velocity range, the results would become higher than the former ratio for Ma = –6~–3 (Figure 9).
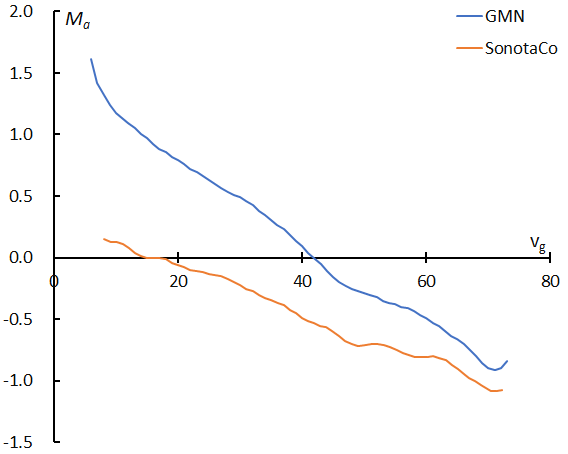
Figure 11 – Moving means of the magnitude of sporadic meteors against velocity (km/s).
It seems too high for the sporadic magnitude ratio which we have known, the ratios are over 4 in all velocity ranges and reach 5 at the highest velocity. Figure 9 compares with SonotaCo net results also, and this comparison might give clues to answer the question. Both results show the increase of the magnitude ratio with velocity; this may be true because the higher velocity meteors belong to the apex source, the middle range the Toroidal, and the slower the ANT source. But the magnitude ratios themselves are different; GMN results are always higher than those of SonotaCo net.
Figure 10 (left) and (right) compares the magnitude distribution of GMN with the one of SonotaCo net for vg < 15(km/s) and vg > 70(km/s) respectively. GMN catches fainter meteors than SonotaCo net especially for slower meteors because they use larger lenses (Figure 11). The magnitude ratio of the latter in the range of slower meteors might be biased and seems to be underestimated. On the other hand, the mean magnitude of GMN rapidly decreases because they use longer focus lenses than SonotaCo net; the apparent angular velocity of the meteors on a CCD is higher, and the collected light per pixel decreases.
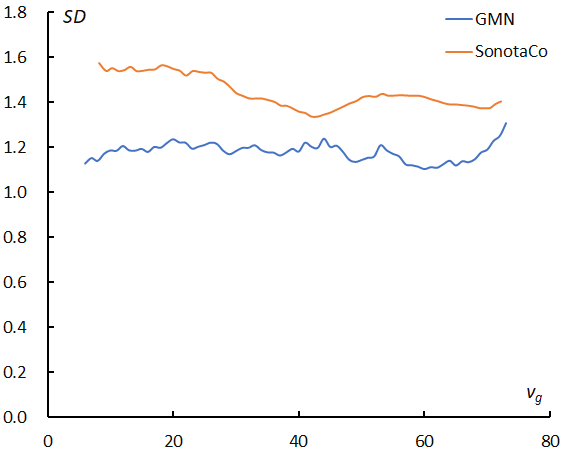
Figure 12 – Moving means of the standard deviation of the magnitude distribution in Figure 11 against velocity (km/s).
Figure 10 shows one more important suggestion for the question; both magnitude distributions of GMN are narrower than those of SonotaCo net. Figure 12 gives the standard deviations for the mean magnitude in Figure 11.
It is clear that the standard deviation, which is the width of the magnitude distribution, of the Global Meteor Network is always narrower than those of SonotaCo net. Therefore, it is suggested that the magnitude difference between the Global Meteor Network and SonotaCo net is apparent because they use different cameras and different photometry. It is difficult to obtain an absolute magnitude ratio by video observations at present, though this is also true for other observation techniques. The magnitude ratios or similar indexes are different for visual, radio, and other observing techniques.
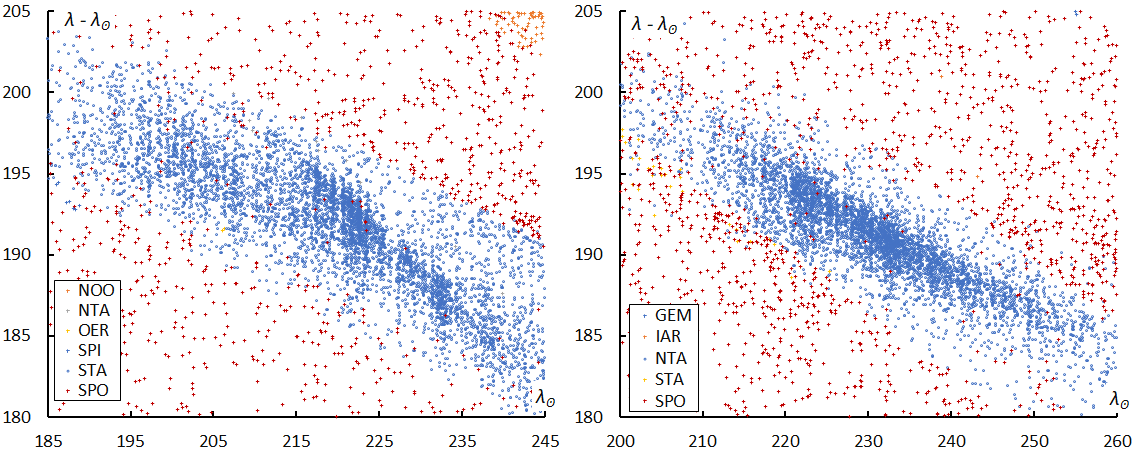
Figure 13 – The distribution of the radiants by SonotaCo net. left: STA, 180° < λ–λʘ < 205°, −8° < β < −2°, between 185° < λʘ < 245°, right: NTA, 180° < λ–λʘ < 205°, 0° < β < +6°, between 200° < λʘ < 260°.
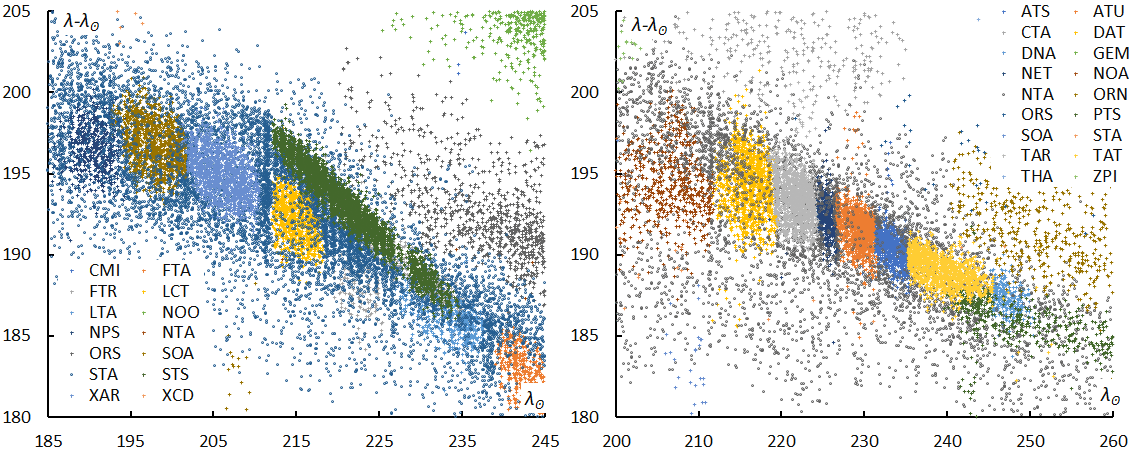
Figure 14 – The distribution of the radiants by the Global Meteor Network. left: STA, 180° < λ–λʘ < 205°, −8° < β < −2°, between 185° < λʘ < 245°, right: NTA, 180° < λ–λʘ < 205°, 0° < β < +6°, between 200° < λʘ < 260°.
4.2. Shower classification in the case of Taurids
We already mentioned the contamination by sporadic or minor shower meteors within the Quadrantids and Geminids. There are many more important problems with the shower classification for the Taurids. Figure 13 shows the sun-centered longitude (λ–λʘ) with the longitude of the sun for classified STA (Figure 13 left) and NTA (Figure 13, right) by SonotaCo net. Both STA and NTA are simply expressed as a single broad group. On the contrary, Global Meteor Network divided both STA and NTA into several sub streams (Figure 14). It seems that the IAU classification was taken very strictly. We noted that such subdivisions should not apply to complex showers such as the Taurids (Koseki, 2018). These subdivisions were introduced by Jenniskens et al. (2016) but they themselves listed these subdivisions ranked as a lower category. The working status in the IAU shower database (IAUSD) means they are under research and not confirmed. There are questionable entries even in the ‘established status’ in IAUSD (Koseki, 2020). We should be careful to study the properties of a meteor shower, if someone does this the shower identification should be redone.
Figure 15 and Figure 16 represent the difference in the magnitude distribution before and after the reclassification. Figure 15 (top) shows the distribution of STA according to the GMN shower classification and it is curiously curved. Figure 15 shows the result after being divided into _SE (middle) and _SF (bottom) components and reclassified. The distributions are just as valid as those for SonotaCo net data (Koseki, 2023). Figure 16 is a similar comparison for NTA; after the reclassification (bottom) the distribution becomes similar like the one shown in the previous result (Koseki, 2023).
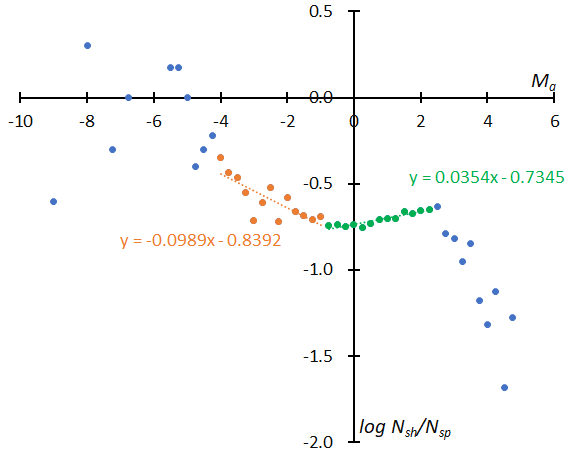
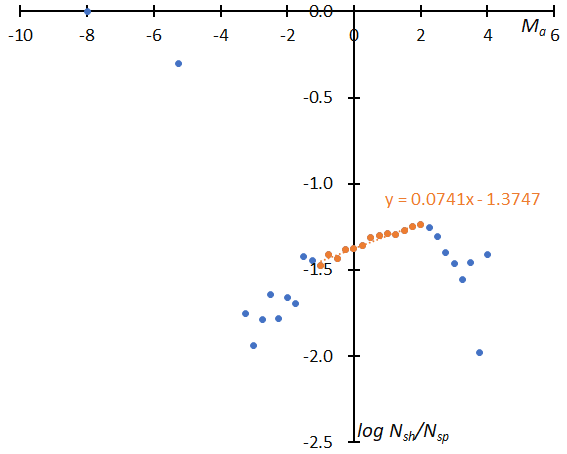
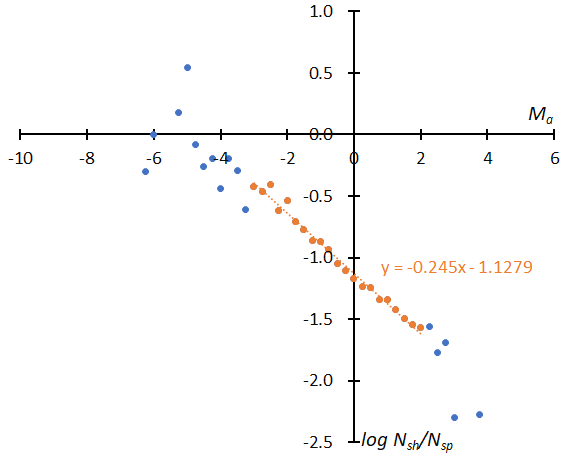
Figure 15 – The distribution of the logarithm of the number of shower meteors relative to sporadic meteors. (Top): GMN originally classified STA meteors, (middle): reclassified results of STA_SE, (bottom): reclassified results of STA_SF.
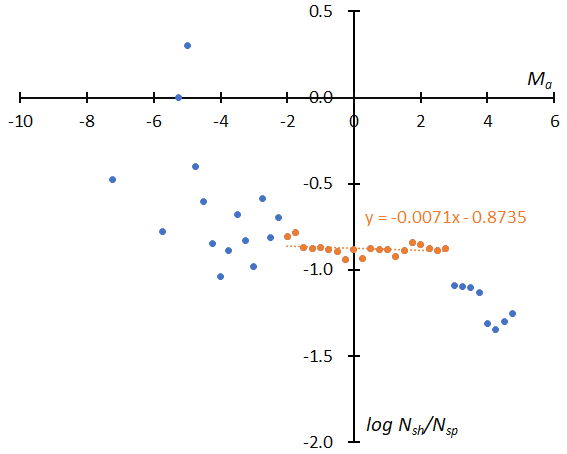
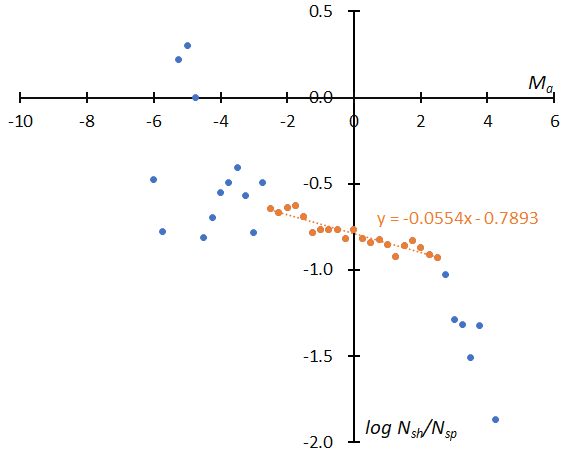
Figure 16 – The distribution of the logarithm of the number of shower meteors relative to sporadic meteors. (Top): GMN originally classified NTA meteors, (bottom): reclassified results of NTA.
5 Properties discussed by shower
The following meteor shower characteristics obtained from Global Meteor Network data can be compared to the corresponding results obtained from SonotaCo data (Koseki, 2023).
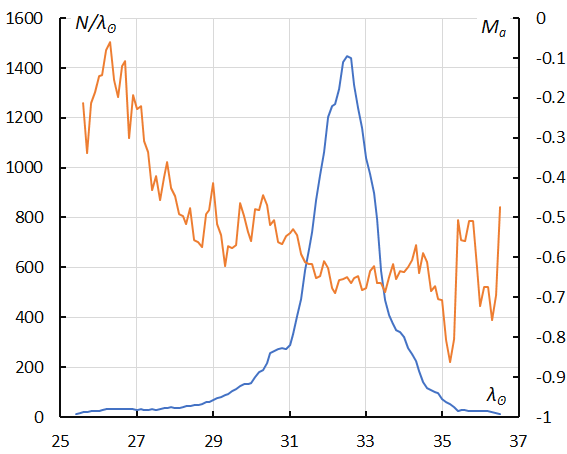
Figure 17 – The sliding mean of the number of Lyrids (solid line, blue) and of the absolute magnitude (solid line, orange) using with 1 solar longitude bin; the number is the total number of orbits collected (see Koseki, 2023, page 156).
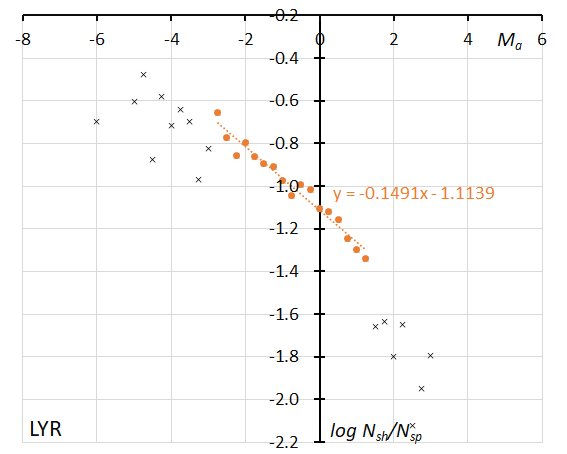
Figure 18 – The dotted line indicates the result of the linear regression analysis for the Lyrids between Ma = –2.75~+1.25, crosses on both sides are excluded from the analysis because of the scarcity of the data (see Koseki, 2023, page 156).
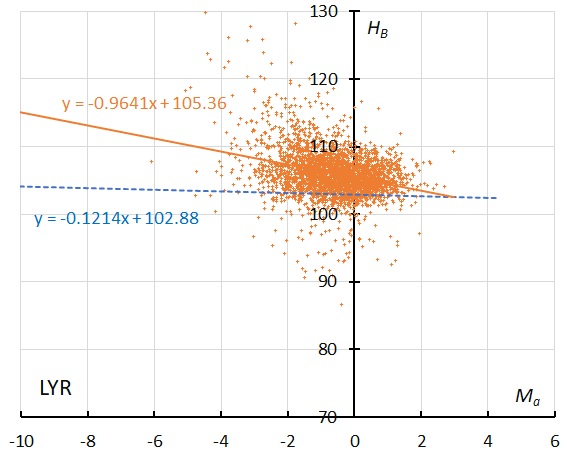
Figure 19 – The result of the linear regression for sporadic meteors is shown as a dashed line, that of the Lyrids as a solid line (see Koseki, 2023, page 156).
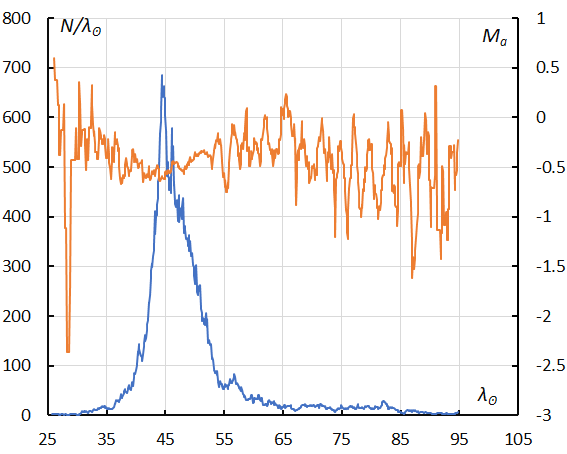
Figure 20 – The sliding mean of the number of eta Aquariids (solid line, blue) and of the absolute magnitude (solid line, orange) using with 1 solar longitude bin; the number is the total number of orbits collected (see Koseki, 2023, page 157).
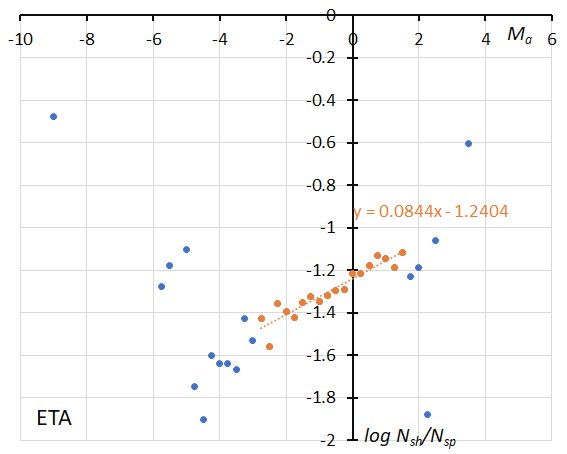
Figure 21 – The dotted line indicates the result of the linear regression analysis for the eta Aquariids between Ma = –2.75~+1.5, dots on both sides are excluded from the analysis because of the scarcity of the data observations (see Koseki, 2023, page 157).
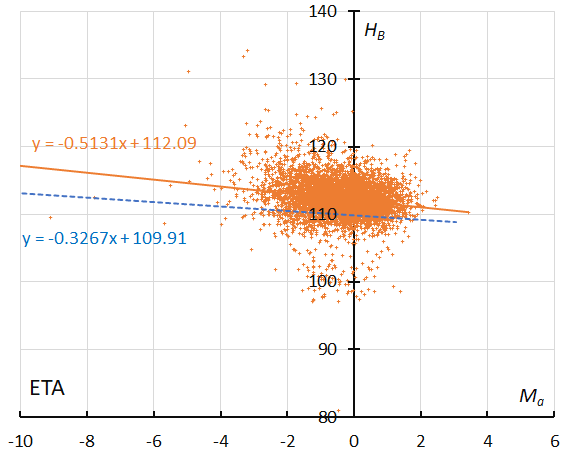
Figure 22 – The result of the linear regression for sporadic meteors is shown as a dashed line, that of the eta Aquariids as a solid line observations (see Koseki, 2023, page 157).
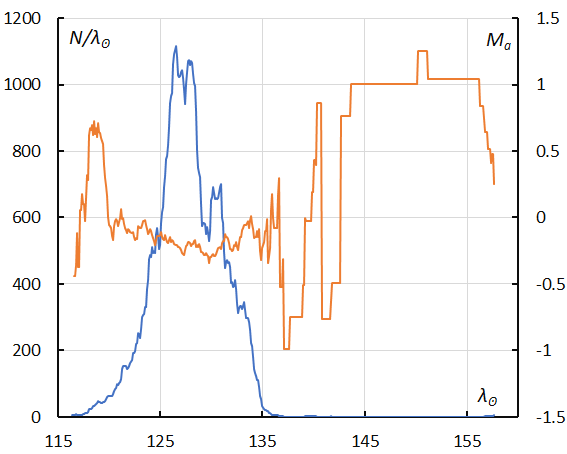
Figure 23 – The sliding mean of the number of Southern delta Aquariids (solid line, blue) and of the absolute magnitude (solid line, orange) using with 1 solar longitude bin; the number is the total number of orbits collected (see Koseki, 2023, page 157).
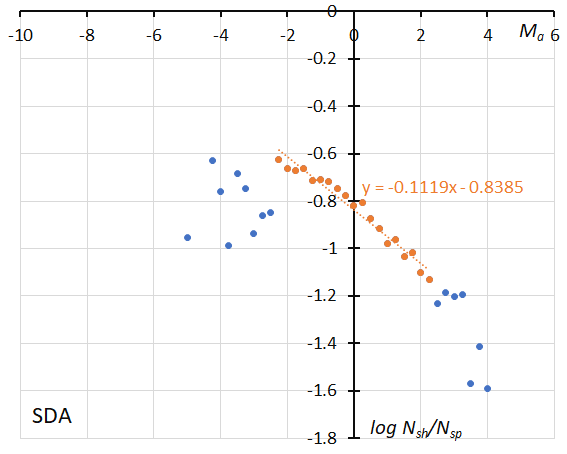
Figure 24 – The dotted line indicates the result of the linear regression analysis for the Southern delta Aquariids between Ma = –2.25~+2.25, dots on both sides are excluded from the analysis because of the scarcity of the data (see Koseki, 2023, page 157).
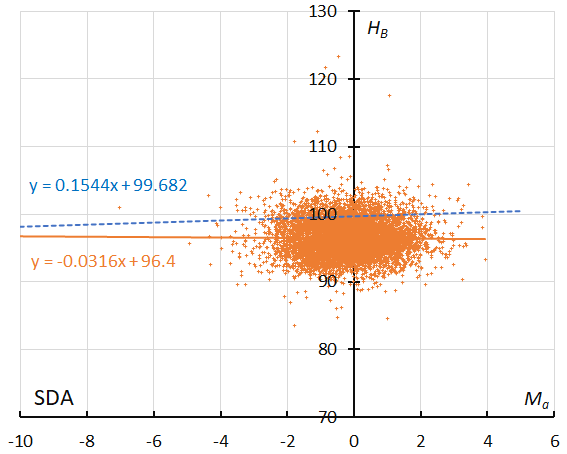
Figure 25 – The result of the linear regression for sporadic meteors is shown as a dashed line, that of the Southern delta Aquariids as a solid line (see Koseki, 2023, page 158).
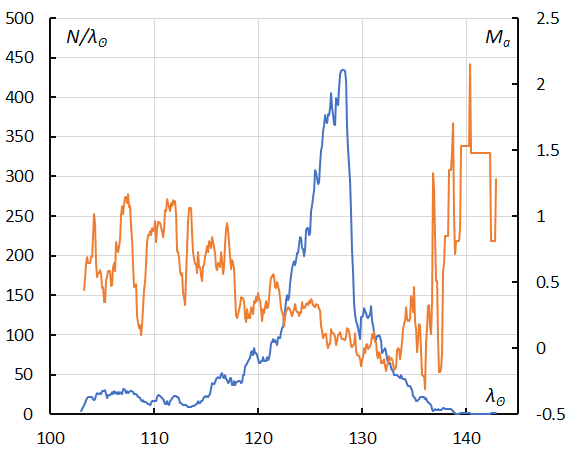
Figure 26 – The sliding mean of the number of Capricornids (solid line, blue) and of the absolute magnitude (solid line, orange) using with 1 solar longitude bin; the number is the total number of orbits collected (see Koseki, 2023, page 158).
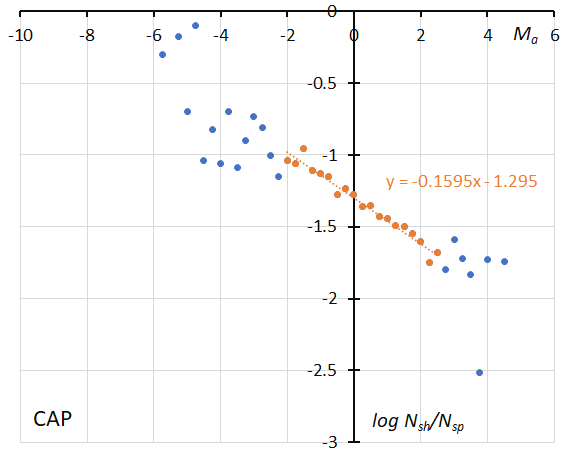
Figure 27 – The dotted line indicates the result of the linear regression analysis for the Capricornids between Ma = –2~+2.5, dots on both sides are excluded from the analysis because of the scarcity of the data (see Koseki, 2023, page 158).
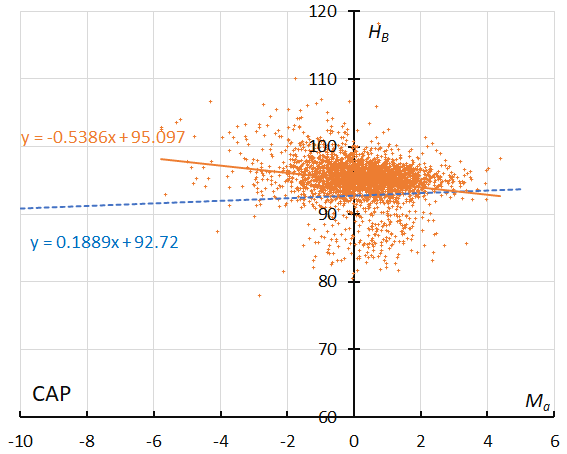
Figure 28 – The result of the linear regression for sporadic meteors is shown as a dashed line, that of the Capricornids as a solid line (see Koseki, 2023, page 158).
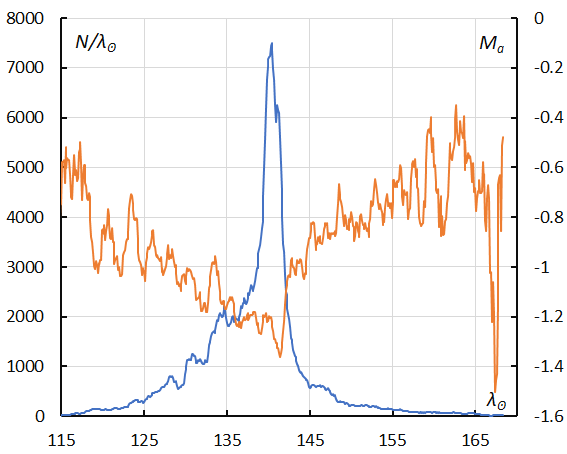
Figure 29 – The sliding mean of the number of Perseids (solid line, blue) and of the absolute magnitude (solid line, orange) using with 1 solar longitude bin; the number is the total number of orbits collected (see Koseki, 2023, page 159).
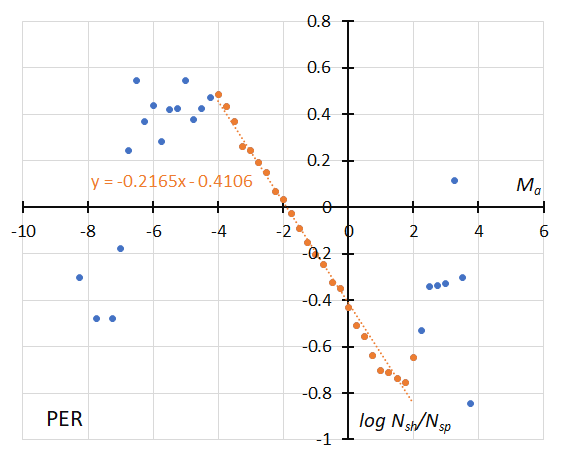
Figure 30 – The dotted line indicates the result of the linear regression analysis for the Perseids between Ma = –4~+2, dots on both sides are excluded from the analysis because of the scarcity of the data (see Koseki, 2023, page 159).
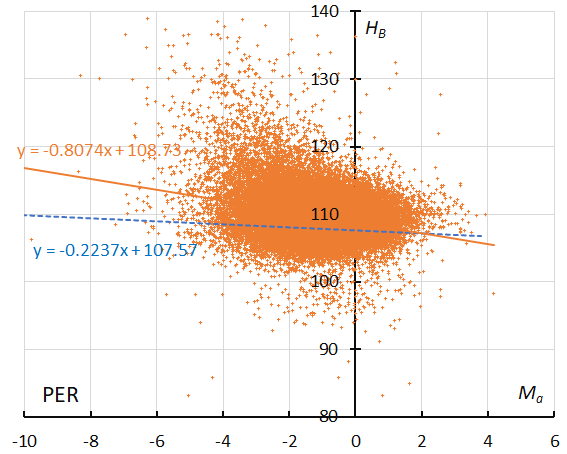
Figure 31 – The result of the linear regression for sporadic meteors is shown as a dashed line, that of the Perseids as a solid line (see Koseki, 2023, page 159).
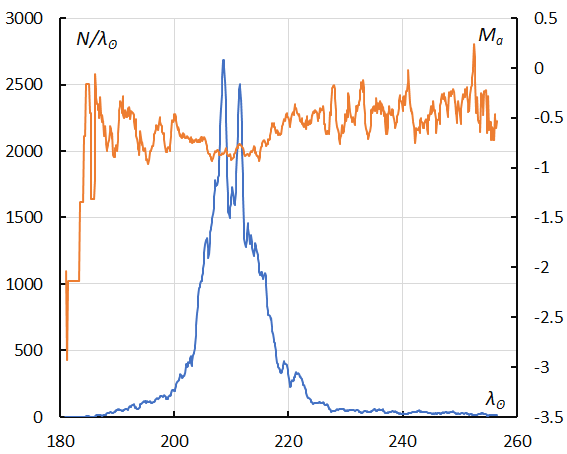
Figure 32 – The sliding mean of the number of Orionids regular activity (solid line, blue) and of the absolute magnitude (solid line, orange) using with 1 solar longitude bin; the number is the total number of orbits collected (see Koseki, 2023, page 159).
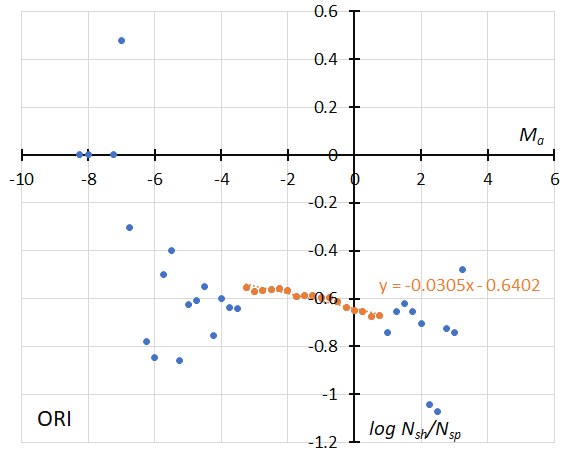
Figure 33 – The dotted line indicates the result of the linear regression analysis for the Orionids during the regular activity, between Ma = –3.25~+0.75, dots on both sides are excluded from the analysis because of the scarcity of the data (see Koseki, 2023, page 160).
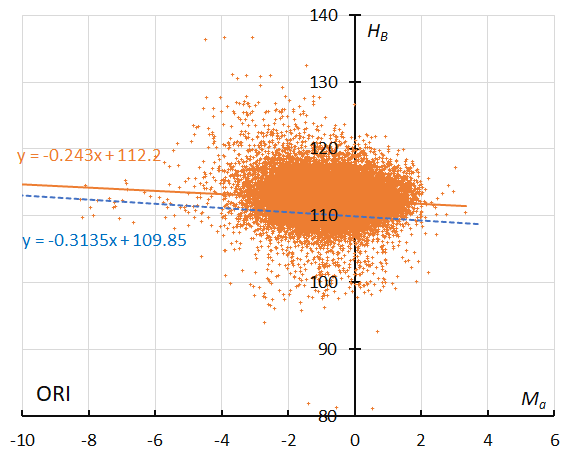
Figure 34 – The result of the linear regression for sporadic meteors is shown as a dashed line, that of the Orionids during regular activity as a solid line (see Koseki, 2023, page 160).
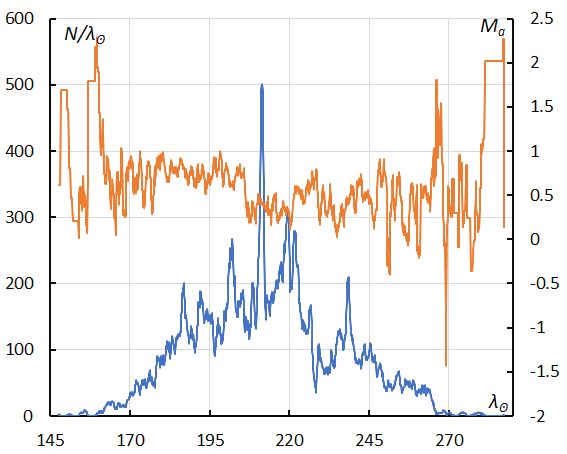
Figure 35 – GMN originally classified STA meteors, sliding mean of the number of Southern Taurids activity (solid line, blue) and of the absolute magnitude (solid line, orange) using with 1 solar longitude bin; the number is the total number of orbits collected.
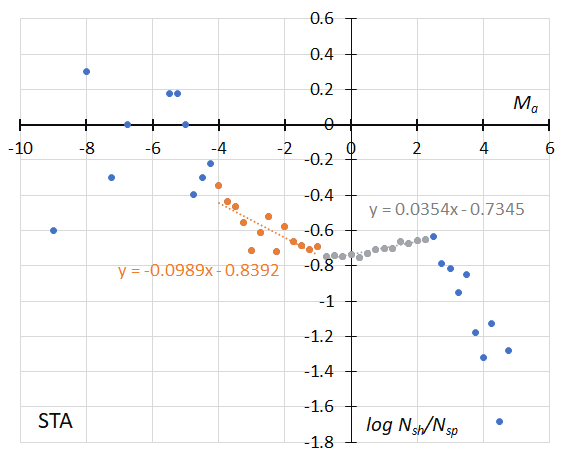
Figure 36 – GMN originally classified STA meteors, the dotted line indicates the result of the linear regression analysis for the Southern Taurids, between Ma = –4~–1 and Ma = –0.75~+2.25, dots on both sides are excluded from the analysis because of the scarcity of the data.
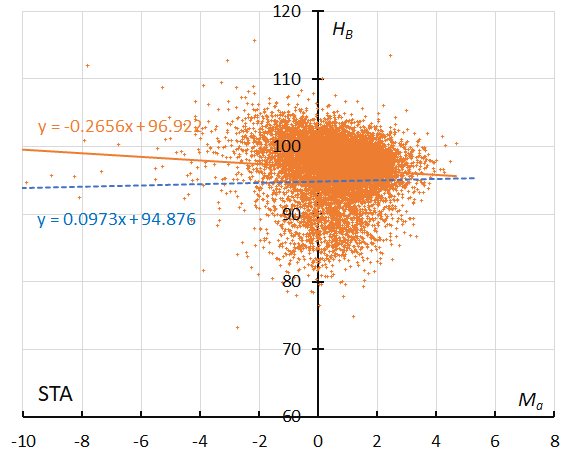
Figure 37 – GMN originally classified STA meteors. The result of the linear regression for sporadic meteors is shown as a dashed line, that of the Southern Taurids as a solid line.
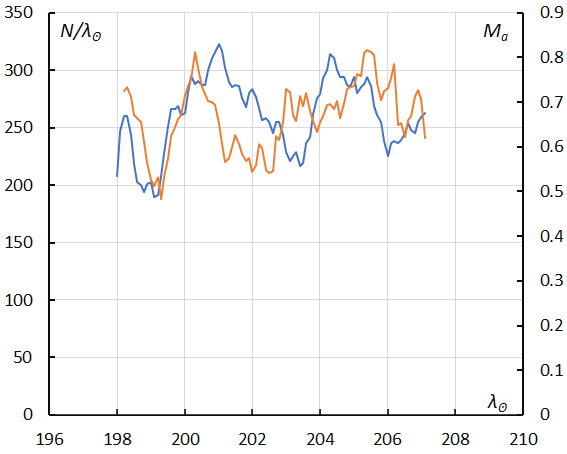
Figure 38 – The sliding mean of the number of Southern Taurids SE activity (solid line, blue) and of the absolute magnitude (solid line, orange) using with 1 solar longitude bin; the number is the total number of orbits collected (see Koseki, 2023, page 160).
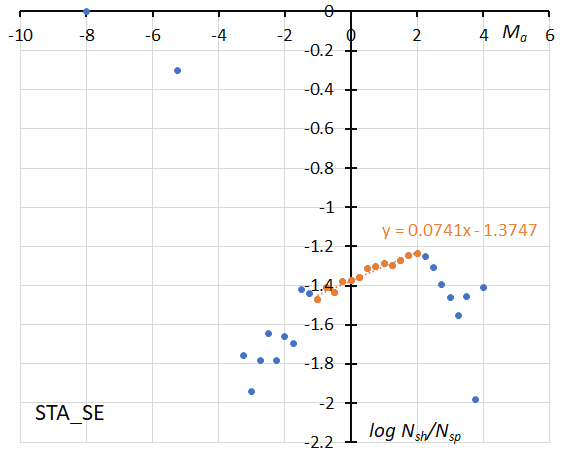
Figure 39 – The solid line indicates the result of the linear regression analysis for the Southern Taurids SE, between Ma = –1~+2, dots on both sides are excluded from the analysis because of the scarcity of the data (see Koseki, 2023, page 160).
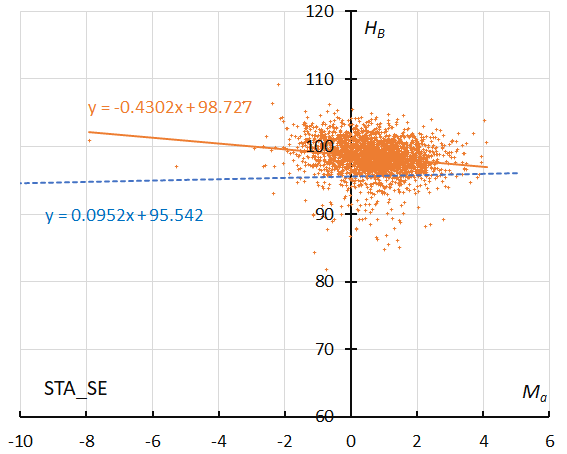
Figure 40 – The result of the linear regression for sporadic meteors is shown as a dashed line, that of the Southern Taurids SE as a solid line (see Koseki, 2023, page 161).
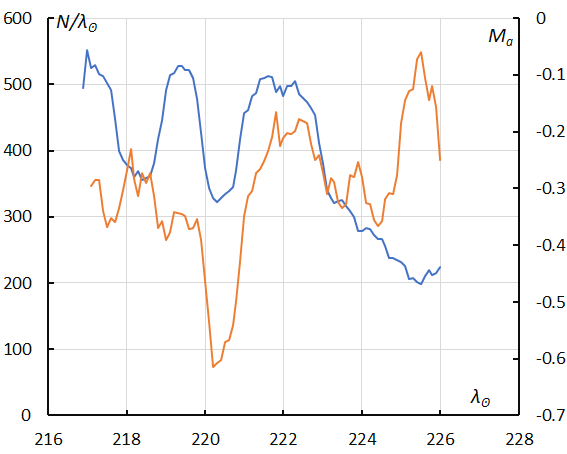
Figure 41 – The sliding mean of the number of Southern Taurids SF regular activity (solid line, blue) and of the absolute magnitude (solid line, orange) using with 1 solar longitude bin; the number is the total number of orbits collected (see Koseki, 2023, page 161).
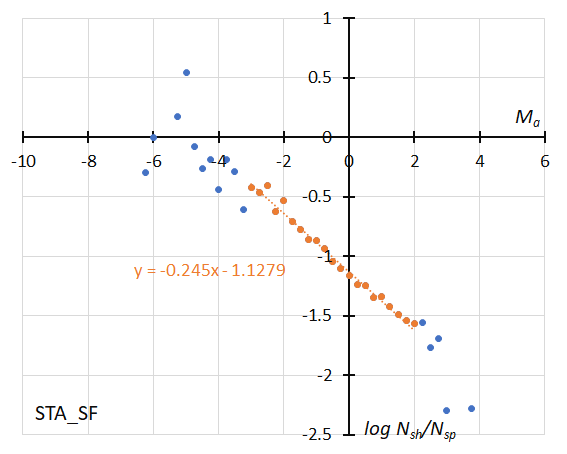
Figure 42 – The dotted line indicates the result of the linear regression analysis for the Southern Taurids SF during the regular activity, between Ma = –3~+2, dots on both sides are excluded from the analysis because of the scarcity of the data (see Koseki, 2023, page 161).
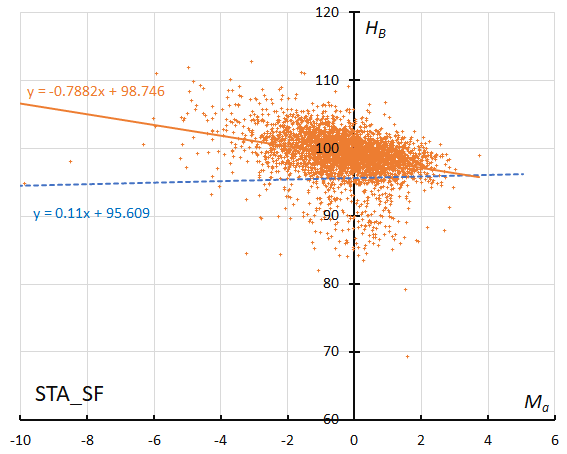
Figure 43 – The result of the linear regression for sporadic meteors is shown as a dashed line, that of the Southern Taurids SF during regular activity as a solid line (see Koseki, 2023, page 162).
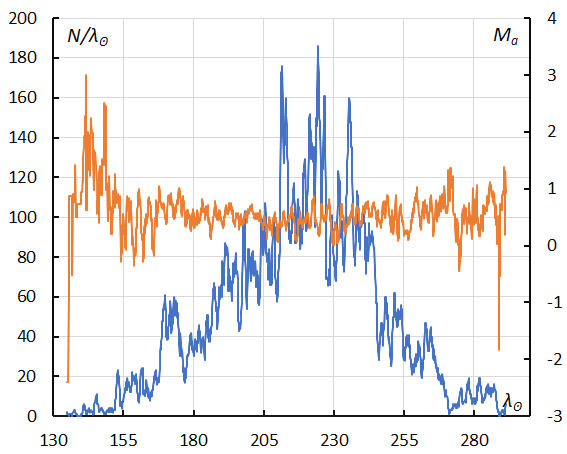
Figure 44 – GMN originally classified NTA meteors. The sliding mean of the number of Northern Taurids (solid line, blue) and of the absolute magnitude (solid line, orange) using with 1 solar longitude bin; the number is the total number of orbits collected (see Koseki, 2023, page 162).
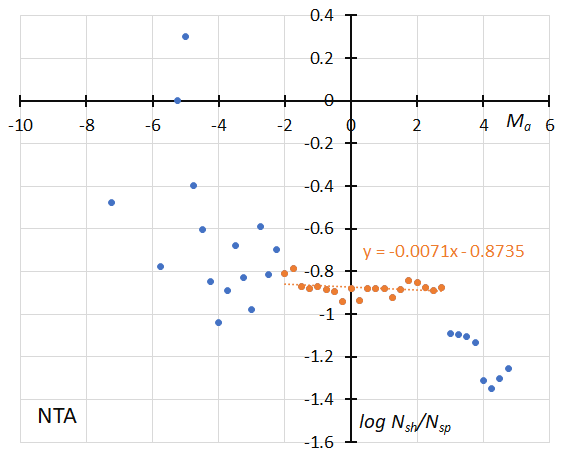
Figure 45 – GMN originally classified NTA meteors. The dotted line indicates the result of the linear regression analysis for the Northern Taurids, between Ma = –2~+2.75, dots on both sides are excluded from the analysis because of the scarcity of the data (see Koseki, 2023, page 162).
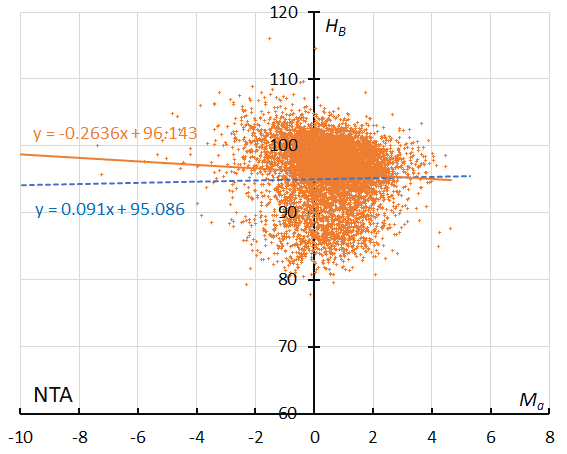
Figure 46 – GMN originally classified NTA meteors. The result of the linear regression for sporadic meteors is shown as a dashed line, that of the Northern Taurids as a solid line (see Koseki, 2023, page 162).
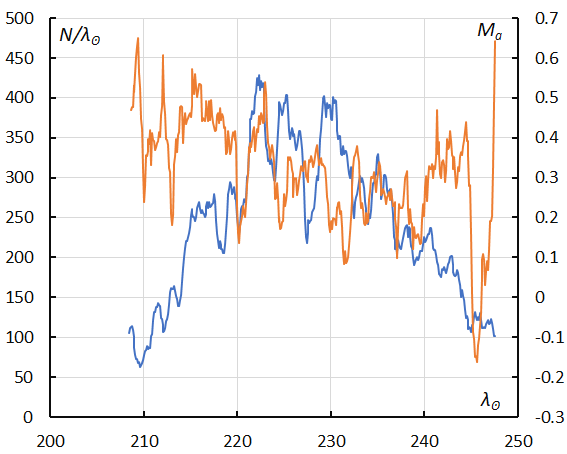
Figure 47 – The sliding mean of the number of the reclassified results of Northern Taurids (solid line, blue) and of the absolute magnitude (solid line, orange) using with 1 solar longitude bin; the number is the total number of orbits collected (see Koseki, 2023, page 162).
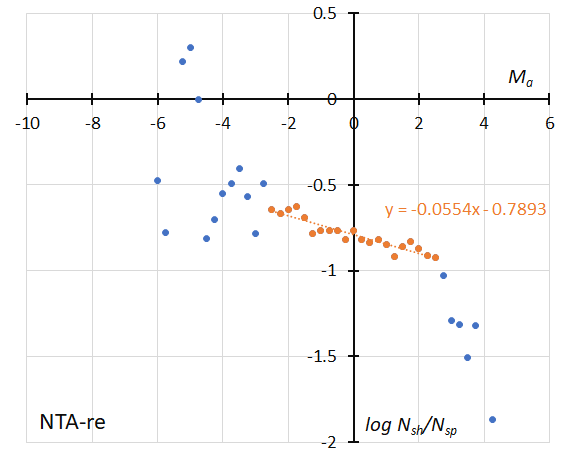
Figure 48 – The dotted line indicates the result of the linear regression analysis for the reclassified results of Northern Taurids, between Ma = –2.5~+2.5, crosses on both sides are excluded from the analysis because of the scarcity of the data (see Koseki, 2023, page 162).
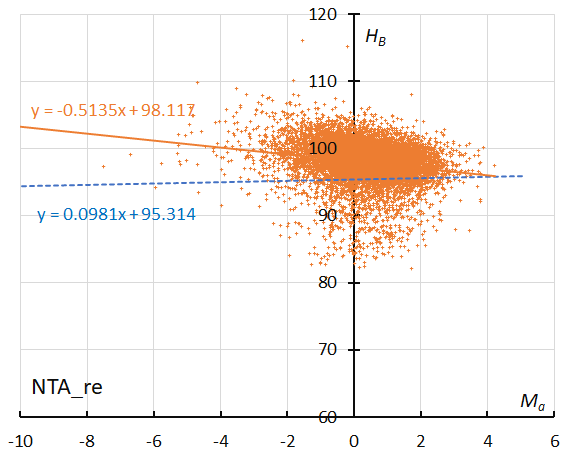
Figure 49 – The result of the linear regression for sporadic meteors is shown as a dashed line, that of the reclassified results of Northern Taurids as a solid line (see Koseki, 2023, page 162).
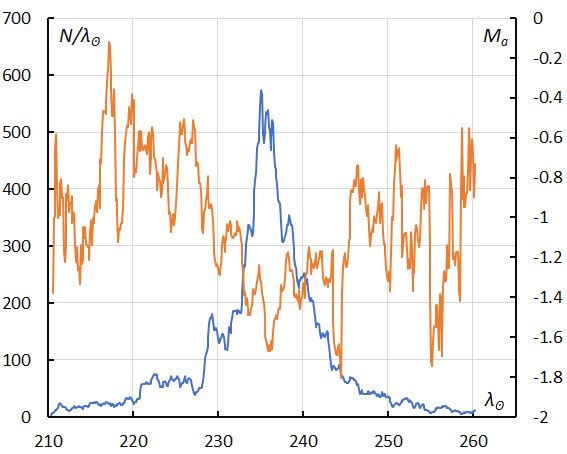
Figure 50 – The sliding mean of the number of Leonids (solid line, blue) and of the absolute magnitude (solid line, orange) using with 1 solar longitude bin; the number is the total number of orbits collected (see Koseki, 2023, page 162).
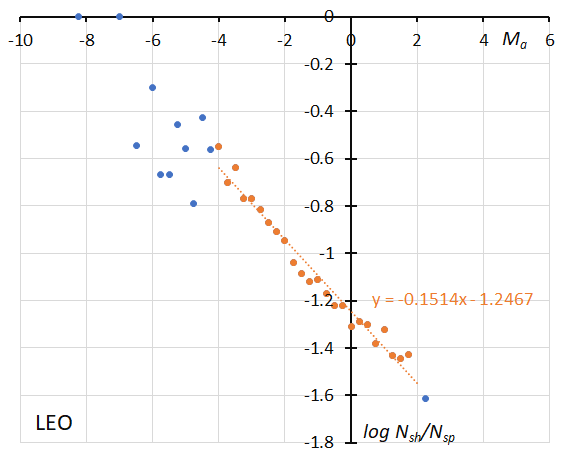
Figure 51 – The dotted line indicates the result of the linear regression analysis for the Leonids, between Ma = –4~+2, crosses on both sides are excluded from the analysis because of the scarcity of the data (see Koseki, 2023, page 163).
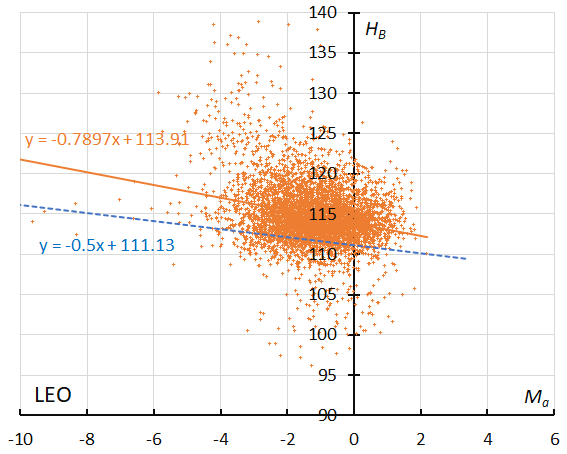
Figure 52 – The result of the linear regression for sporadic meteors is shown as a dashed line, that of Leonids as a solid line (see Koseki, 2023, page 163).
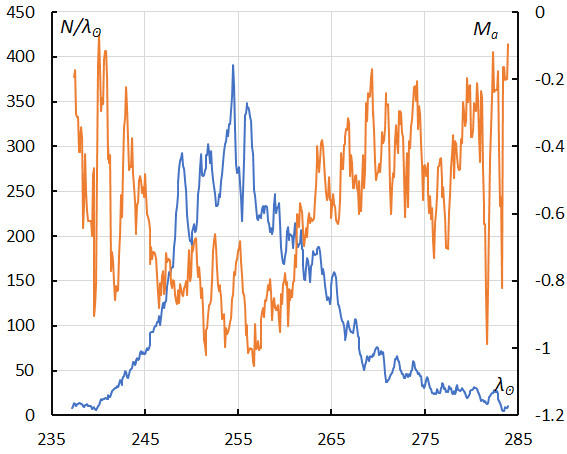
Figure 53 – The sliding mean of the number of sigma Hydrids (solid line, blue) and of the absolute magnitude (solid line, orange) using with 1 solar longitude bin; the number is the total number of orbits collected (see Koseki, 2023, page 163).
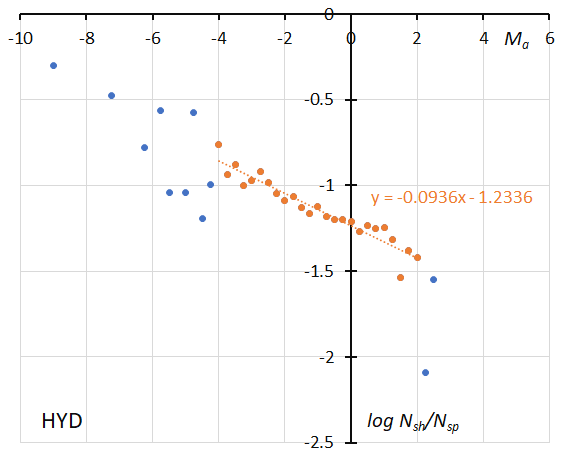
Figure 54 – The dotted line indicates the result of the linear regression analysis for the sigma Hydrids, between Ma = –4~+2, dots on both sides are excluded from the analysis because of the scarcity of the data (see Koseki, 2023, page 163).
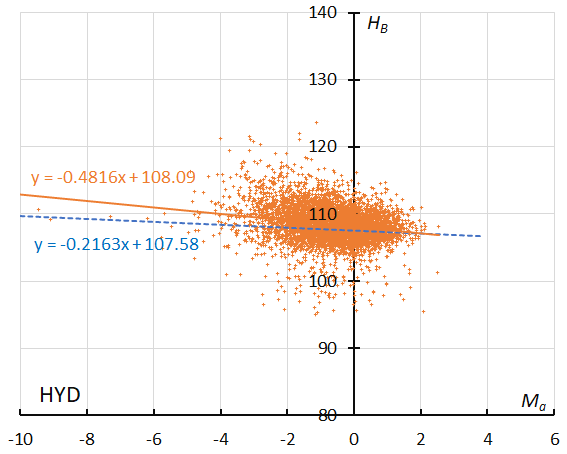
Figure 55 – The result of the linear regression for sporadic meteors is shown as a dashed line, that of the sigma Hydrids as a solid line (see Koseki, 2023, page 163).
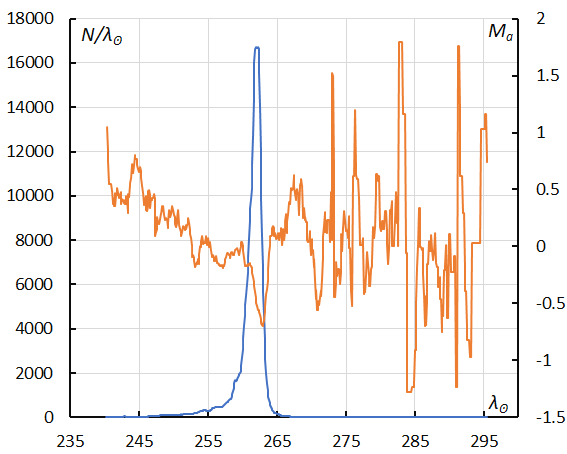
Figure 56 – The sliding mean of the number of Geminids (solid line, blue) and of the absolute magnitude (solid line, orange) using with 1 solar longitude bin; the number is the total number of orbits collected (see Koseki, 2023, page 164).
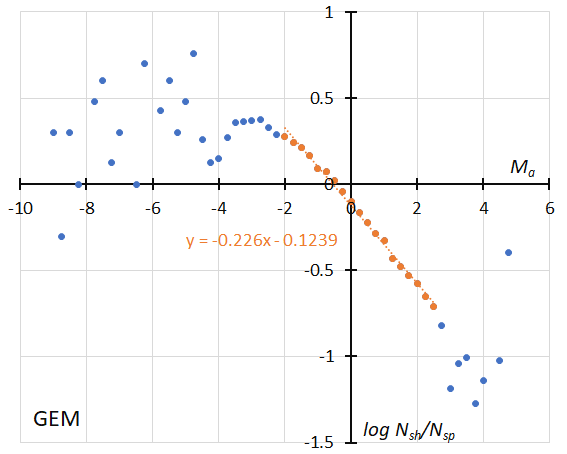
Figure 57 – The dotted line indicates the result of the linear regression analysis for the Geminids, between Ma = –2~+2.5, dotts on both sides are excluded from the analysis because of the scarcity of the data (see Koseki, 2023, page 164).
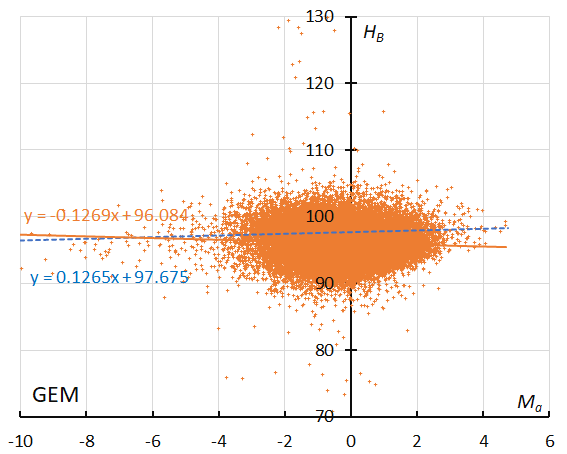
Figure 58 – The result of the linear regression for sporadic meteors is shown as a dashed line, that of the Geminids as a solid line (see Koseki, 2023, page 164).
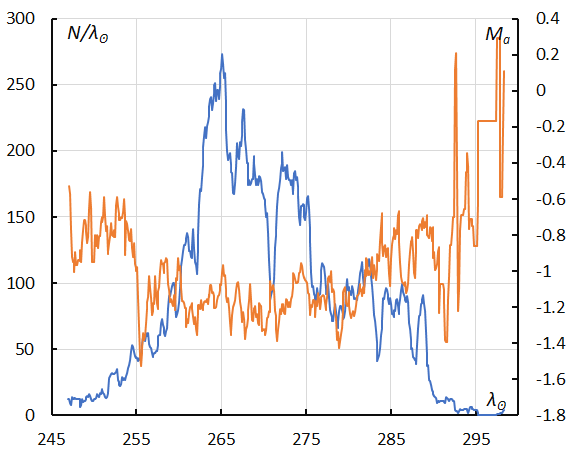
Figure 59 – The sliding mean of the number of Comae Berenicids (solid line, blue) and of the absolute magnitude (solid line, orange) using with 1 solar longitude bin; the number is the total number of orbits collected (see Koseki, 2023, page 164).
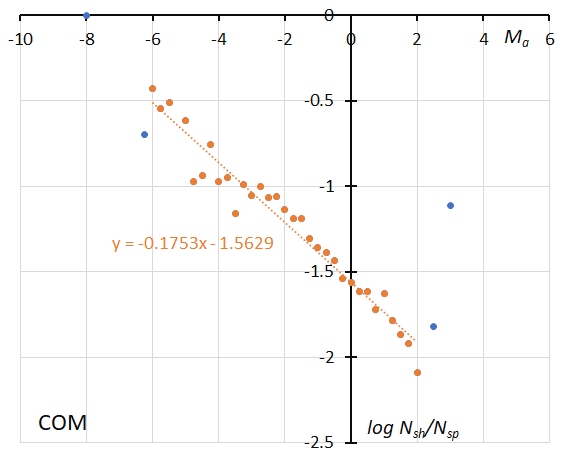
Figure 60 – The dotted line indicates the result of the linear regression analysis for the Comae Berenicids, between Ma = –6~+2, dots on both sides are excluded from the analysis because of the scarcity of the data (see Koseki, 2023, page 164).
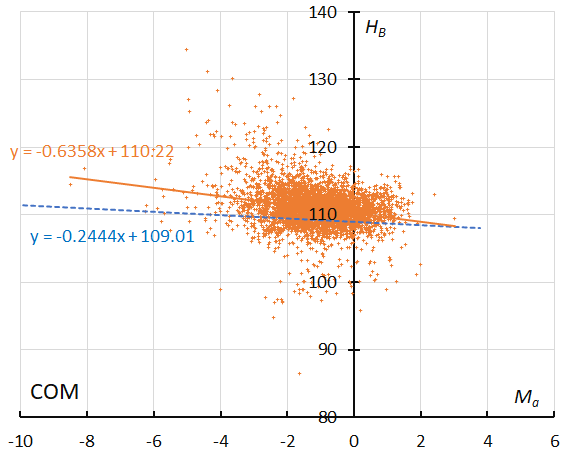
Figure 61 – The result of the linear regression for sporadic meteors is shown as a dashed line, that of the Comae Berenicids as a solid line (see Koseki, 2023, page 165).
Acknowledgments
We sincerely appreciate the Global Meteor Network and SonotaCo net members for their enthusiastic efforts for meteor observations and for making their database public.
References
Jenniskens P., Nénon Q., Gural P. S., Albers J., Haberman B., Johnson B., Morales R., Grigsby B. J., Samuels D., Johannink C. (2016). “CAMS newly detected meteor showers and the sporadic background”. Icarus, 266, 384–409.
Koseki M. (2018). “Different definitions make a meteor shower distorted. The views from SonotaCo net and CAMS”. WGN, Journal of the International Meteor Organization, 46, 119–135.
Koseki M. (2020). “Confusions in IAUMDC Meteor Shower Database (SD)”. eMetN, 5, 93–111.
Koseki M. (2023). “Properties of 14 major meteor showers: magnitude ratio derived from video observations” eMetN, 8, 151–170.
Rendtel, J., (2022), “International Meteor Organization – 2023 Meteor Shower Calendar”.
SonotaCo (2009). “A meteor shower catalog based on video observations in 2007–2008”. WGN, Journal of the IMO, 37, 55–62.
SonotaCo, Uehara S., Sekiguchi T., Fujiwara Y., Maeda K., and Ueda M. (2021). “J14: A Meteor Shower and Cluster”. WGN, Journal of the IMO, 49, 76–97.
Vida D., Gural P., Brown P., Campbell-Brown M., Wiegert P. (2019). “Estimating trajectories of meteors: an observational Monte Carlo approach – I. Theory”. Monthly Notices of the Royal Astronomical Society, 491, 2688–2705.
Vida D., Gural P., Brown P., Campbell-Brown M., Wiegert P. (2020). “Estimating trajectories of meteors: an observational Monte Carlo approach – II. Results”. Monthly Notices of the Royal Astronomical Society, 491, 3996–4011.
Vida D., Šegon D., Gural P. S., Brown P. G., McIntyre M. J., Dijkema T. J., Pavletić L., Kukić P., Mazur M. J., Eschman P., Roggemans P., Merlak A., Zubrović D. (2021). “The Global Meteor Network – Methodology and first results”. Monthly Notices of the Royal Astronomical Society, 506, 5046–5074.
.

