Abstract: An overview of the radio observations during May 2023 is given.
The graphs show both the daily totals (Figure 1) and the hourly numbers (Figure 2) of “all” reflections counted automatically, and of manually counted “overdense” reflections, overdense reflections longer than 10 seconds and longer than 1 minute, as observed here at Kampenhout (BE) on the frequency of our VVS-beacon (49.99 MHz) during the month of May 2023.
The hourly numbers, for echoes shorter than 1 minute, are weighted averages derived from:

The evolution of the observed meteor activity this month is peculiar which is especially striking in the automatic counts of “all” meteors. On May 13, the number of reflections suddenly drops drastically and remains so on May 14. We see the same on May 22 and 23. Since May 13, the number of reflections remains abnormally low during the day, to show almost normal values during the night.
It was first thought to be a problem with the beacon, but that doesn’t seem to be the case. An increased ionization of the D-layer due to the high solar activity could be an explanation, but no direct relationship was found, especially on May 13, 14, 22 and 23. Other causes are still under investigation. The fact is that the low number of reflections was also noticed by other observers of our network.
In the period from May 1 to May 13, lightning activity was recorded on 6 days. It was quite strong on May 4, and on May 5, between 20h00m and 21h00m UT, the core of a thunderstorm area was directly above the beacon, resulting in many remarkable short reflections (Figure 5).
Solar activity produced strong noise almost daily. At our frequency the bursts were mainly of type III and thus relatively short-lived. Some examples are attached (Figures 3 and 4).
Especially the eta-Aquariids caused considerable activity in the beginning of the month, which is striking in the counts of the overdense reflections.
Over the entire month, 12 reflections longer than 1 minute were observed. A selection of these is included along with some other interesting “epsilons” (Figures 6 to 22). Many more of these are available on request.
In addition to the usual graphs, you will also find the raw counts in cvs-format from which the graphs are derived. The table contains the following columns: day of the month, hour of the day, day + decimals, solar longitude (epoch J2000), counts of “all” reflections, overdense reflections, reflections longer than 10 seconds and reflections longer than 1 minute, the numbers being the observed reflections of the past hour.
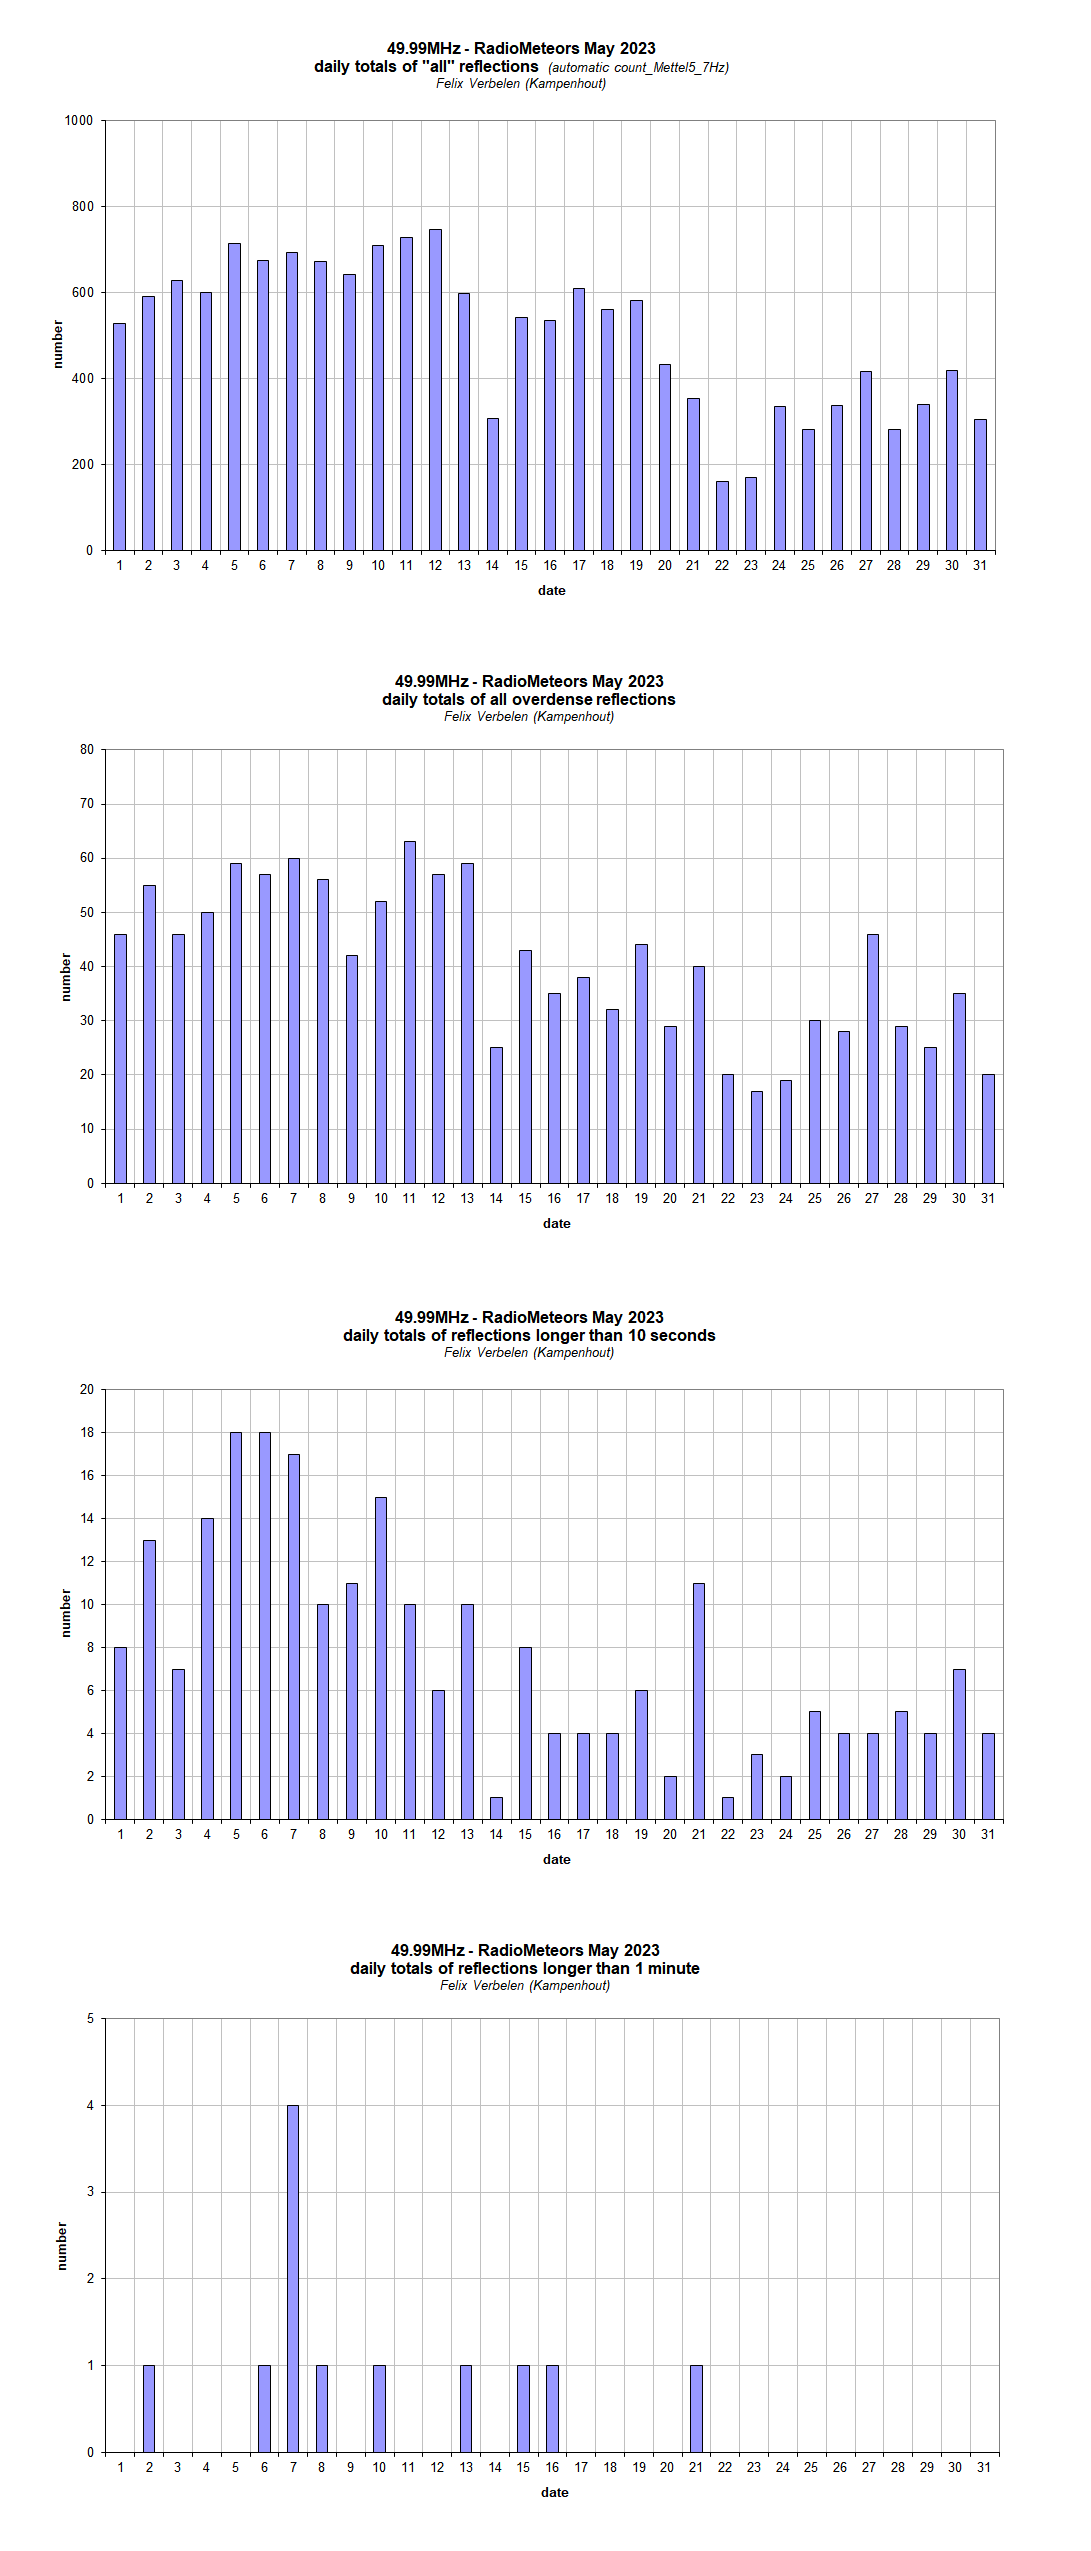
Figure 1 – The daily totals of “all” reflections counted automatically, and of manually counted “overdense” reflections, as observed here at Kampenhout (BE) on the frequency of our VVS-beacon (49.99 MHz) during May 2023.
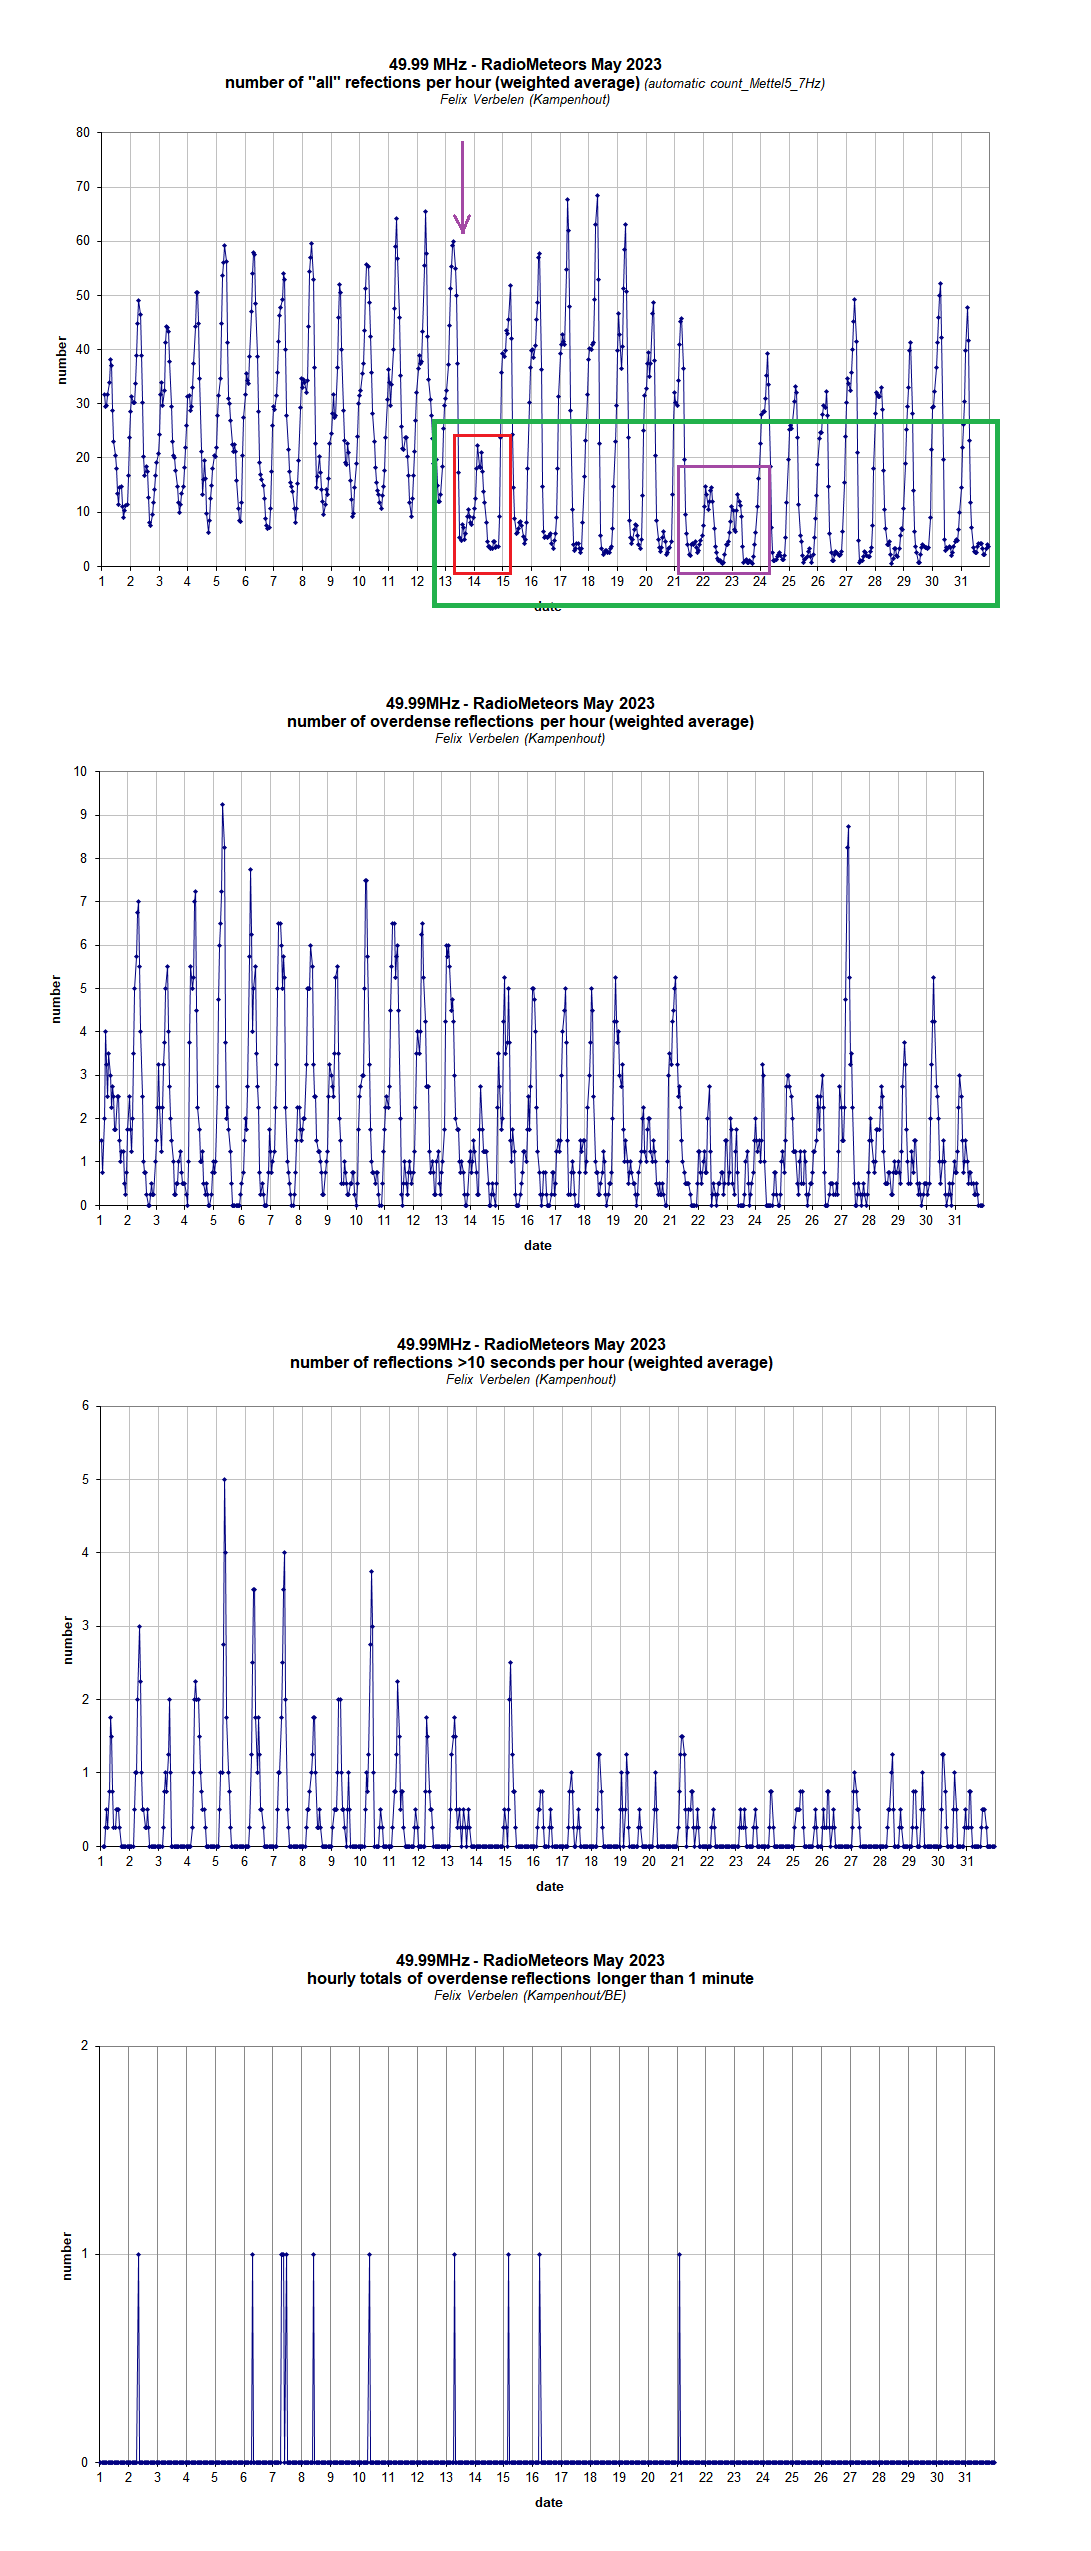
Figure 2 – The hourly numbers of “all” reflections counted automatically, and of manually counted “overdense” reflections, overdense reflections longer than 10 seconds and longer than 1 minute, as observed here at Kampenhout (BE) on the frequency of our VVS-beacon (49.99 MHz) during May 2023.
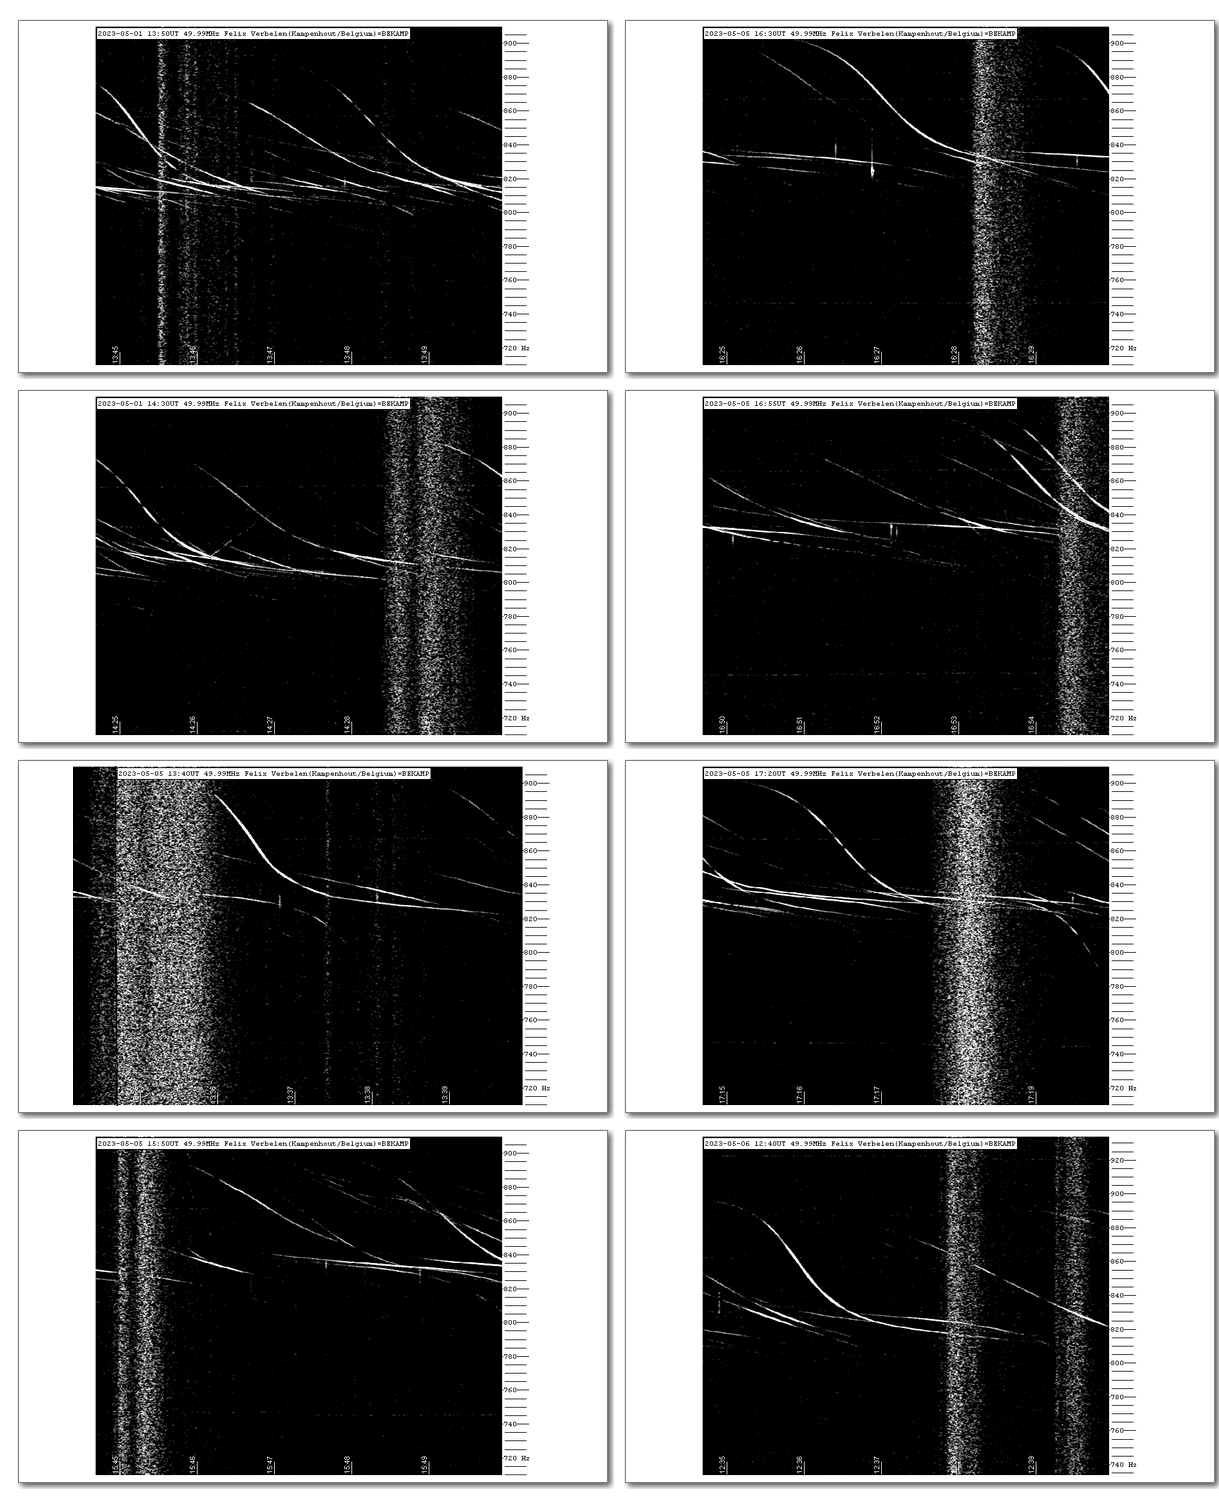
Figure 3 – Solar activity produced strong noise almost daily. At our frequency the bursts were mainly of type III and thus relatively short-lived.
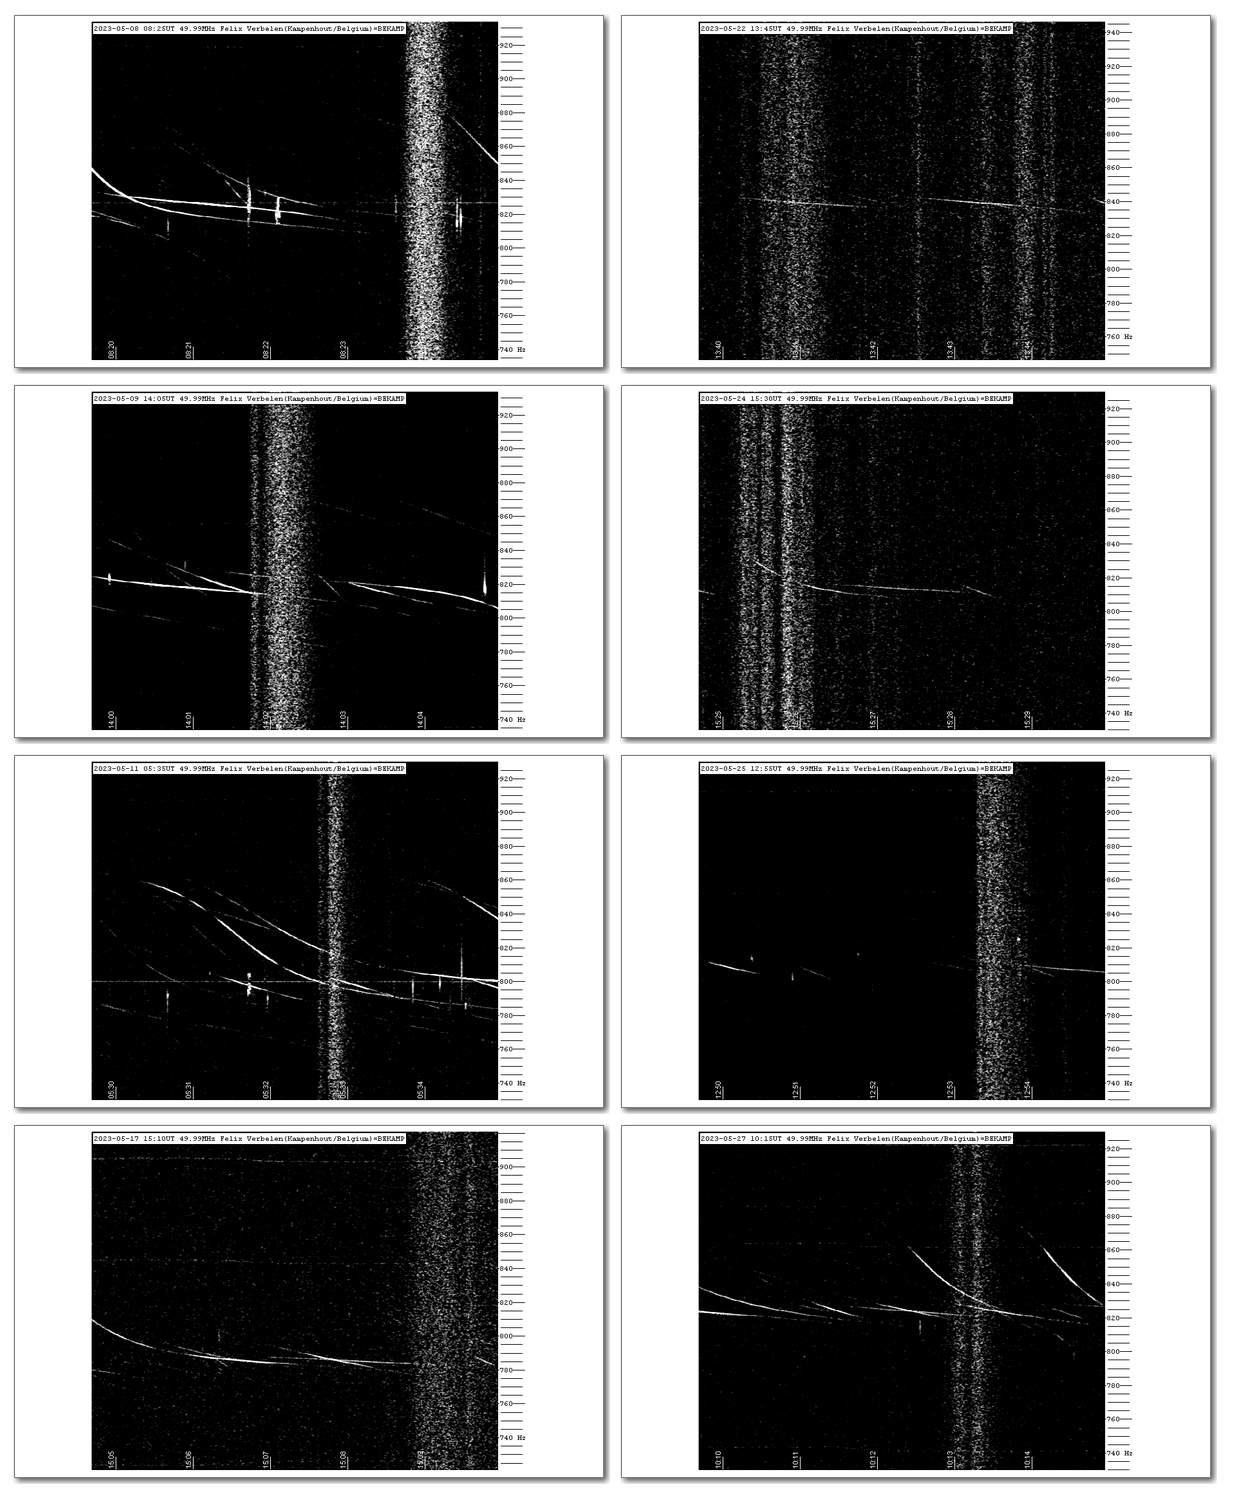
Figure 4 – Solar activity produced strong noise almost daily. At our frequency the bursts were mainly of type III and thus relatively short-lived.
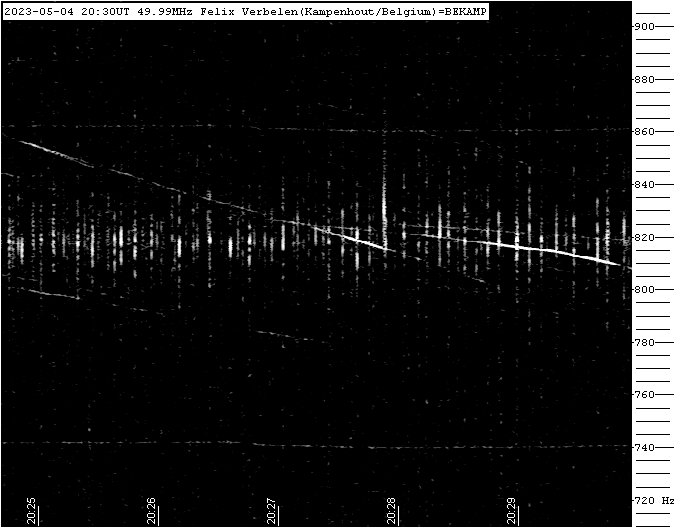
Figure 5 –In the period from May 1 to May 13, lightning activity was recorded on 6 days. It was quite strong on May 4, and on May 5, between 20h00m and 21h00m UT, the core of a thunderstorm area was directly above the beacon, resulting in many remarkable short reflections.
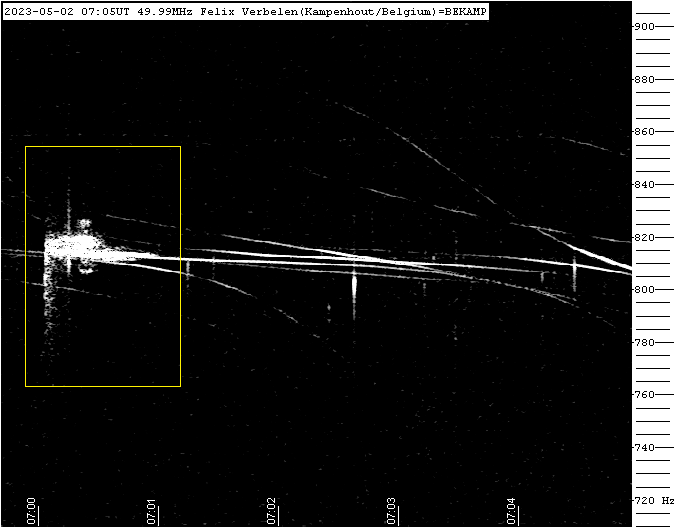
Figure 6 – Meteor echo 2 May 2023, 07h05m UT.
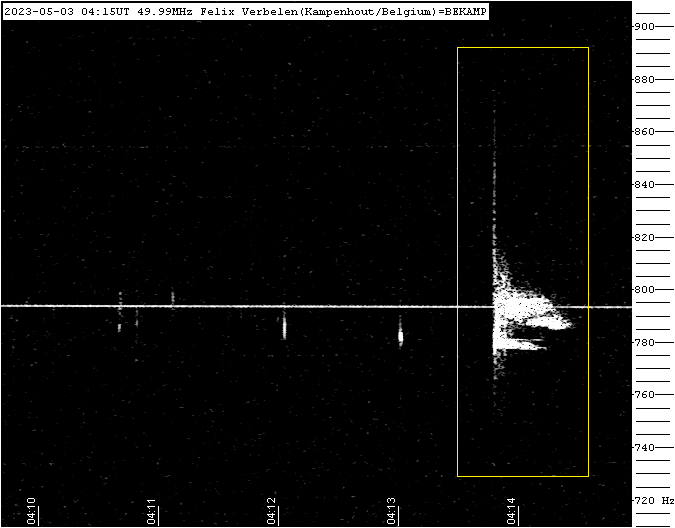
Figure 7 – Meteor echo 3 May 2023, 04h15m UT.
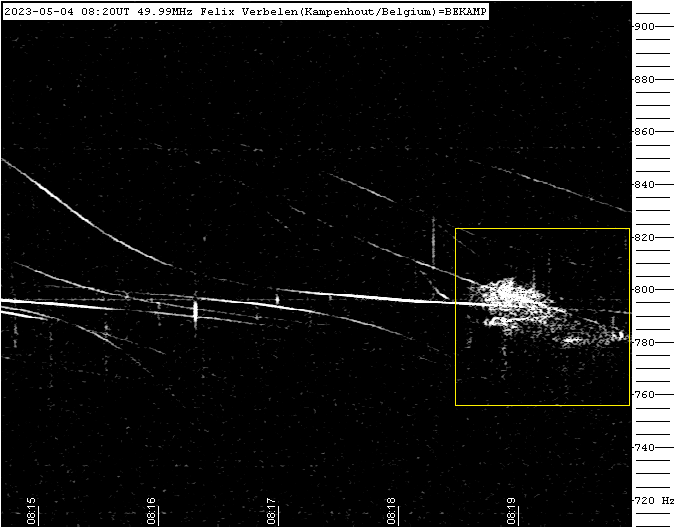
Figure 8 – Meteor echo 4 May 2023, 08h20m UT.
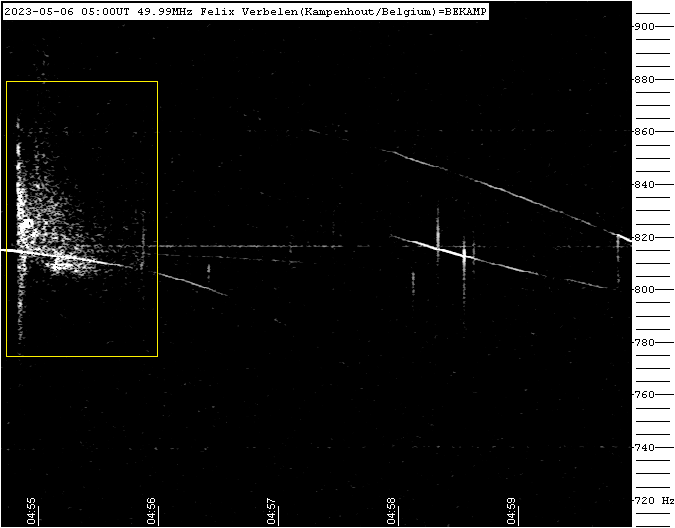
Figure 9 – Meteor echo 6 May 2023, 05h00m UT.
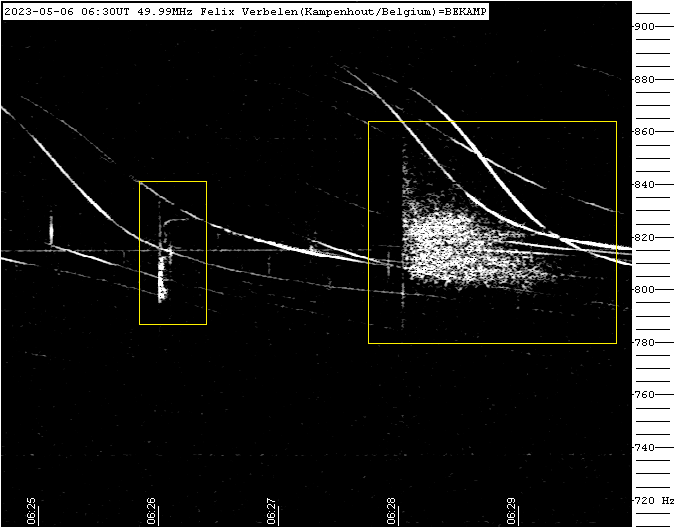
Figure 10 – Meteor echo 6 May 2023, 06h30m UT.
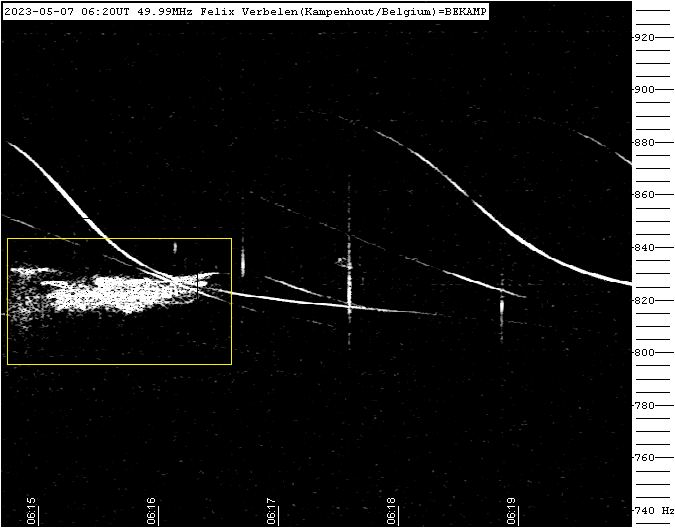
Figure 11 – Meteor echo 7 May 2023, 06h20m UT.
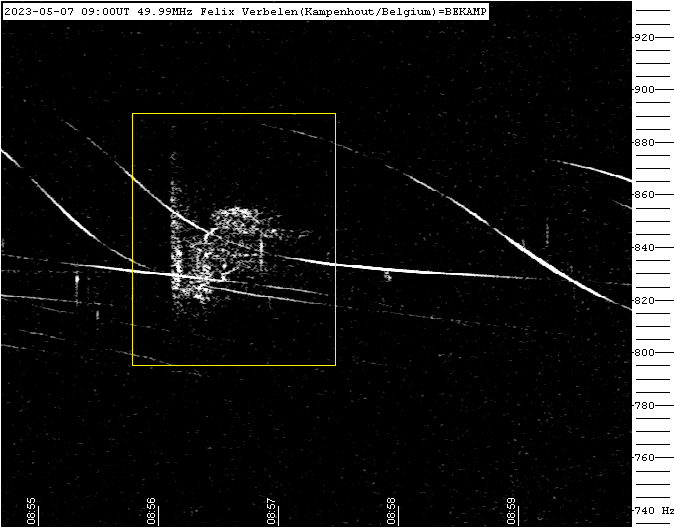
Figure 12 – Meteor echo 7 May 2023, 09h00m UT.
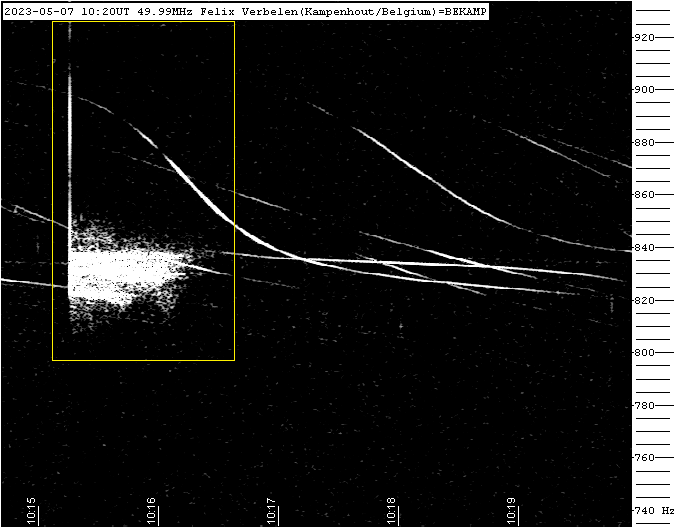
Figure 13 – Meteor echo 7 May 2023, 10h20m UT.
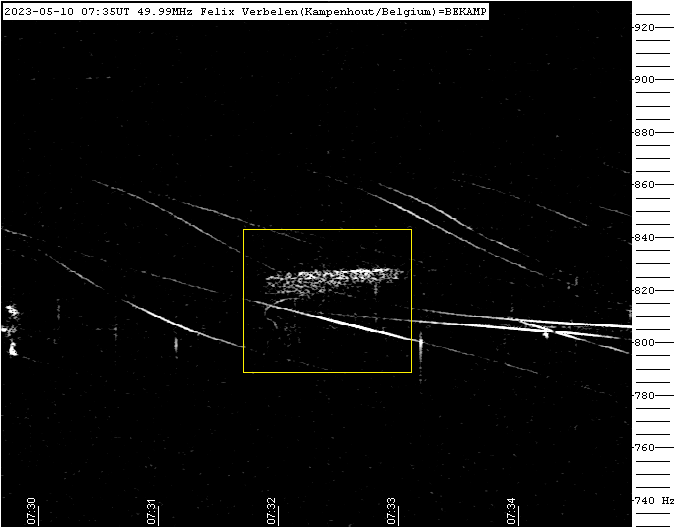
Figure 14 – Meteor echo 10 May 2023, 07h35m UT.
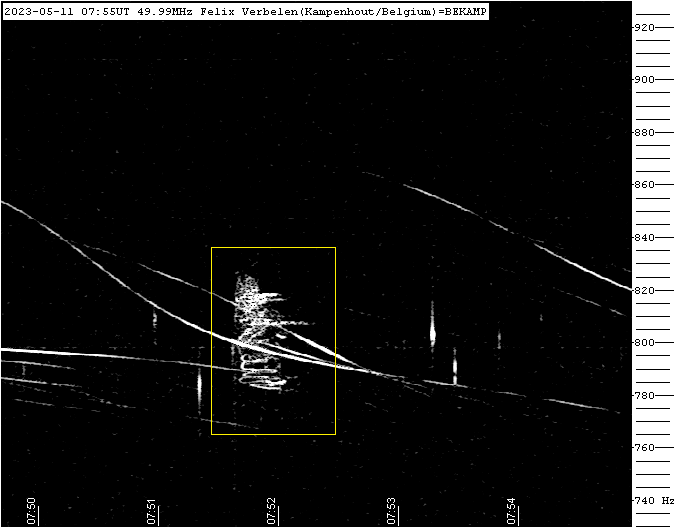
Figure 15 – Meteor echo 11 May 2023, 07h55m UT.
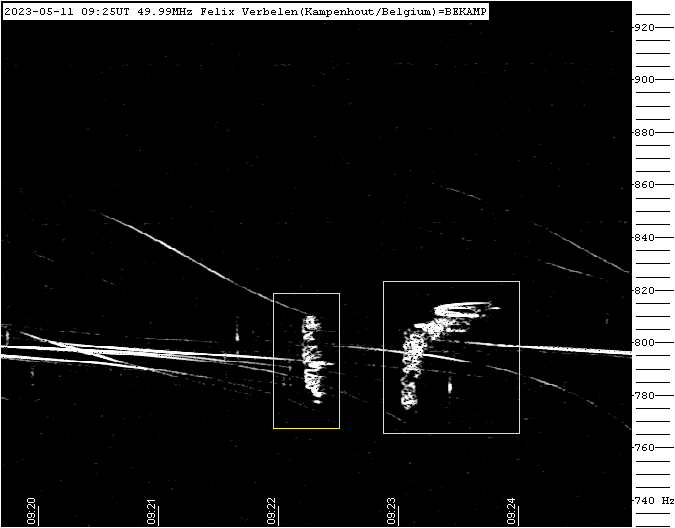
Figure 16 – Meteor echo 11 May 2023, 09h25m UT.
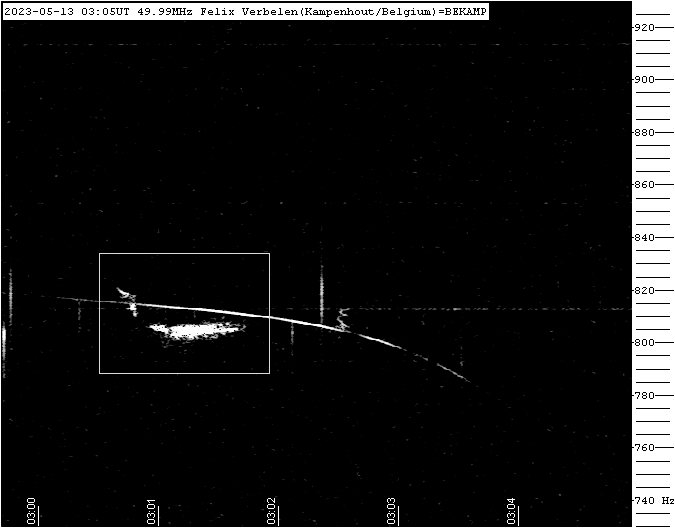
Figure 17 – Meteor echo 13 May 2023, 03h05m UT.
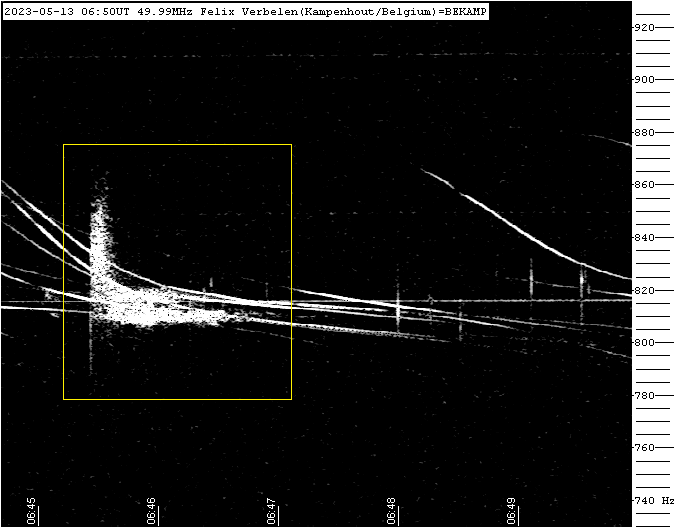
Figure 18 – Meteor echo 13 May 2023, 06h50m UT.
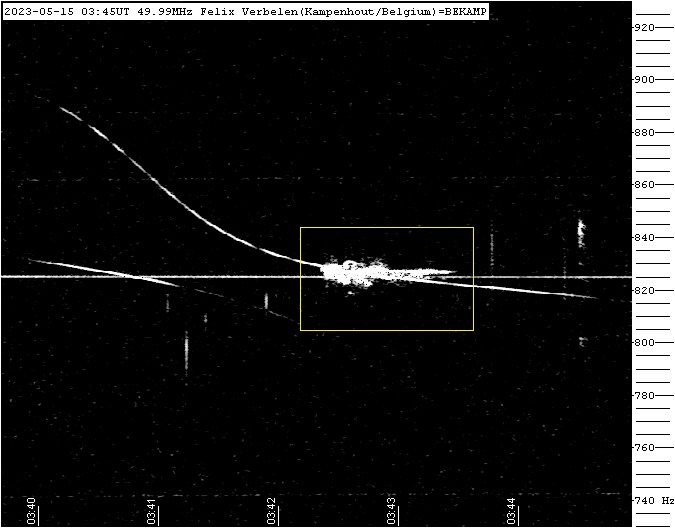
Figure 19 – Meteor echo 15 May 2023, 03h45m UT.
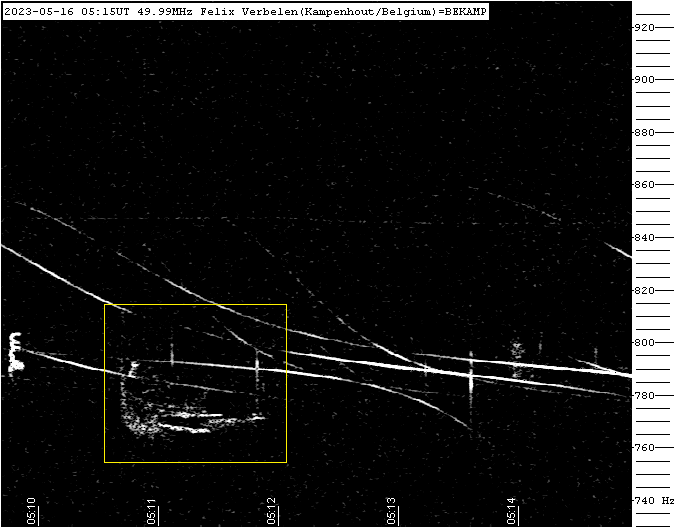
Figure 20 – Meteor echo 16 May 2023, 05h15m UT.
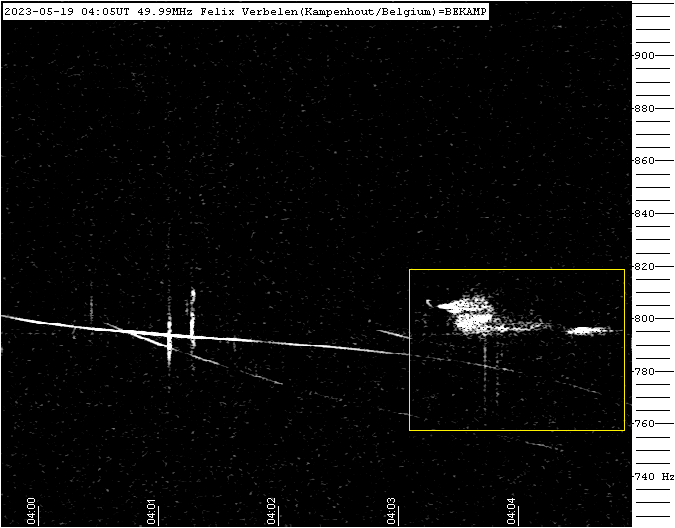
Figure 21 – Meteor echo 19 May 2023, 04h05m UT.
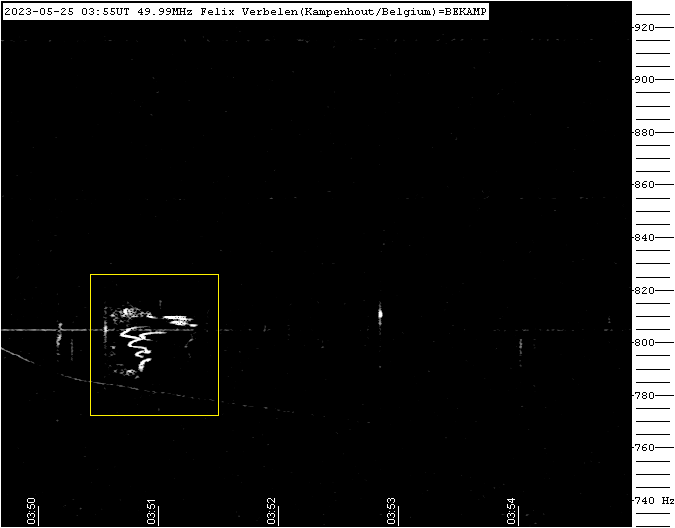
Figure 22 – Meteor echo 25 May 2023, 03h55m UT.

