Abstract: An overview of the radio observations during March 2023 is given.
The graphs show both the daily totals (Figure 1) and the hourly numbers (Figure 2) of “all” reflections counted automatically, and of manually counted “overdense” reflections, overdense reflections longer than 10 seconds and longer than 1 minute, as observed here at Kampenhout (BE) on the frequency of our VVS-beacon (49.99 MHz) during the month of March 2023.
The hourly numbers, for echoes shorter than 1 minute, are weighted averages derived from:

Weak to moderate lightning activity was recorded on just 3 days, while local interference and unidentified noise remained low this month. Solar noise was also rather limited, with nonetheless a few fairly strong outbursts like the one on March 4 (Figure 3).
Meteor activity reached its annual minimum this month as expected, with no strong or prominent meteor showers, but a closer look at the data reveals some fainter showers.
Over the entire month, 4 reflections longer than 1 minute were observed. A selection of these, along with some interesting “epsilons” are included (Figures 4 to 18). Many more are available on request.
The number of measurable head reflections remained fairly limited, but two examples are attached (Figures 19 and 20).
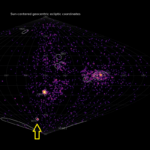
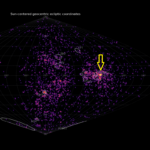
While the x-axis of the SpecLab images is 5 minutes, with the zoomed head reflection it is only 2 seconds. Measurement of the slope of these head reflections give velocities of resp. 59 km/s (20230309_0119 UT) and 45 km/s (20230331_1456 UT). For the calculation used, the method has been described a few years ago (Verbelen, 2019). Over the entire month, 6 reflections longer than 1 minute were observed here. A selection of long reflections is shown in Figures 7 to 14.
.
In addition to the usual graphs, you will also find the raw counts in cvs-format from which the graphs are derived. The table contains the following columns: day of the month, hour of the day, day + decimals, solar longitude (epoch J2000), counts of “all” reflections, overdense reflections, reflections longer than 10 seconds and reflections longer than 1 minute, the numbers being the observed reflections of the past hour.
References
Verbelen F. (2019). “Meteor velocity derived from head echoes obtained by a single observer using forward scatter from a low powered beacon”. WGN, Journal of the International Meteor Organization, 47, 49–54.
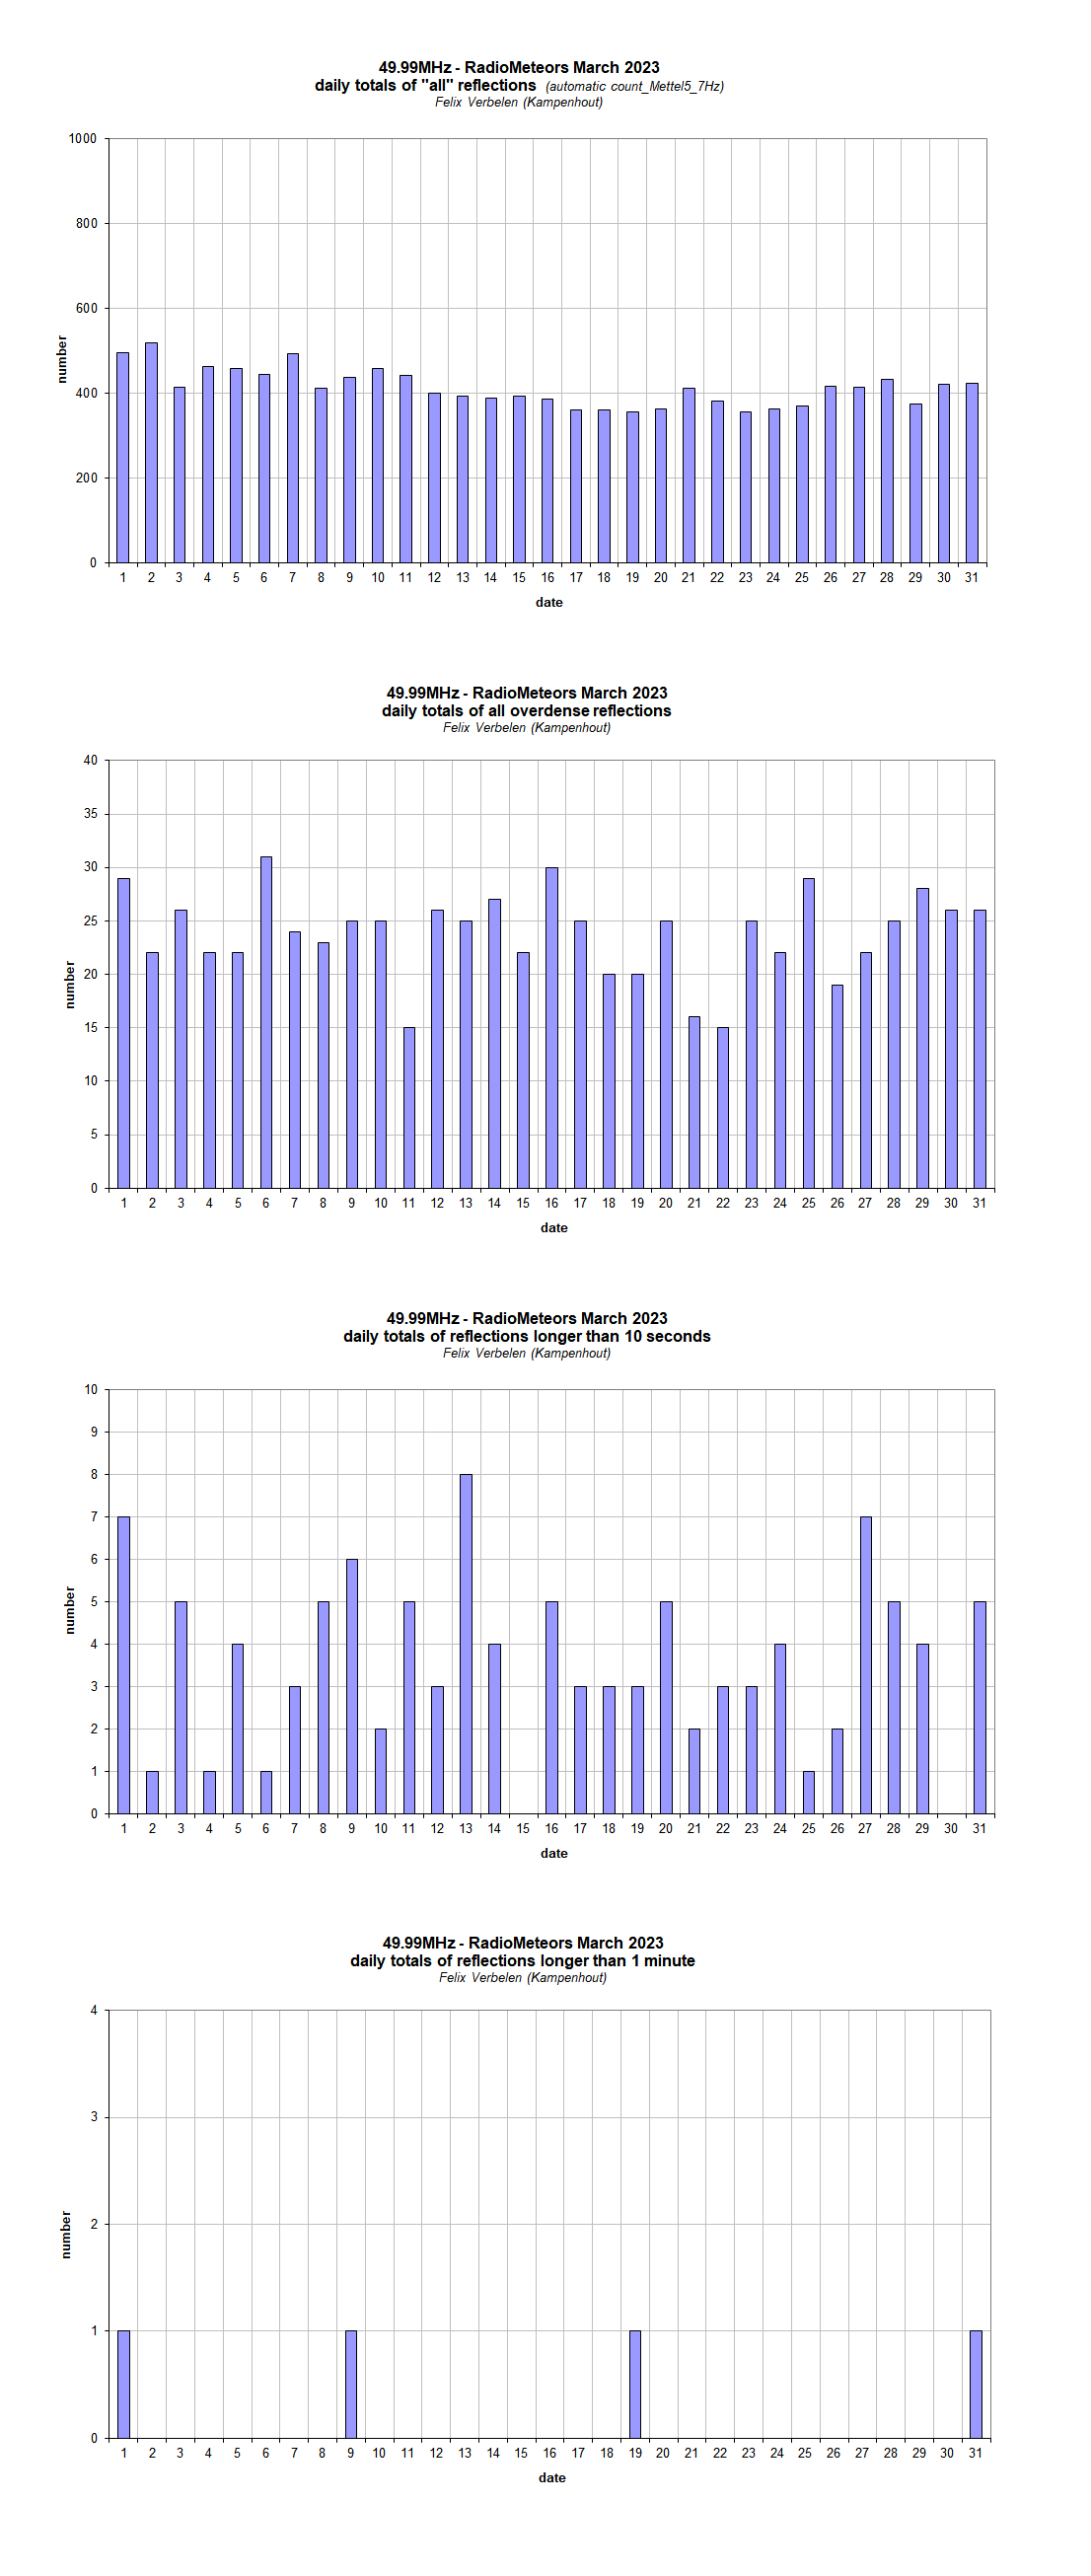
Figure 1 – The daily totals of “all” reflections counted automatically, and of manually counted “overdense” reflections, as observed here at Kampenhout (BE) on the frequency of our VVS-beacon (49.99 MHz) during March 2023.
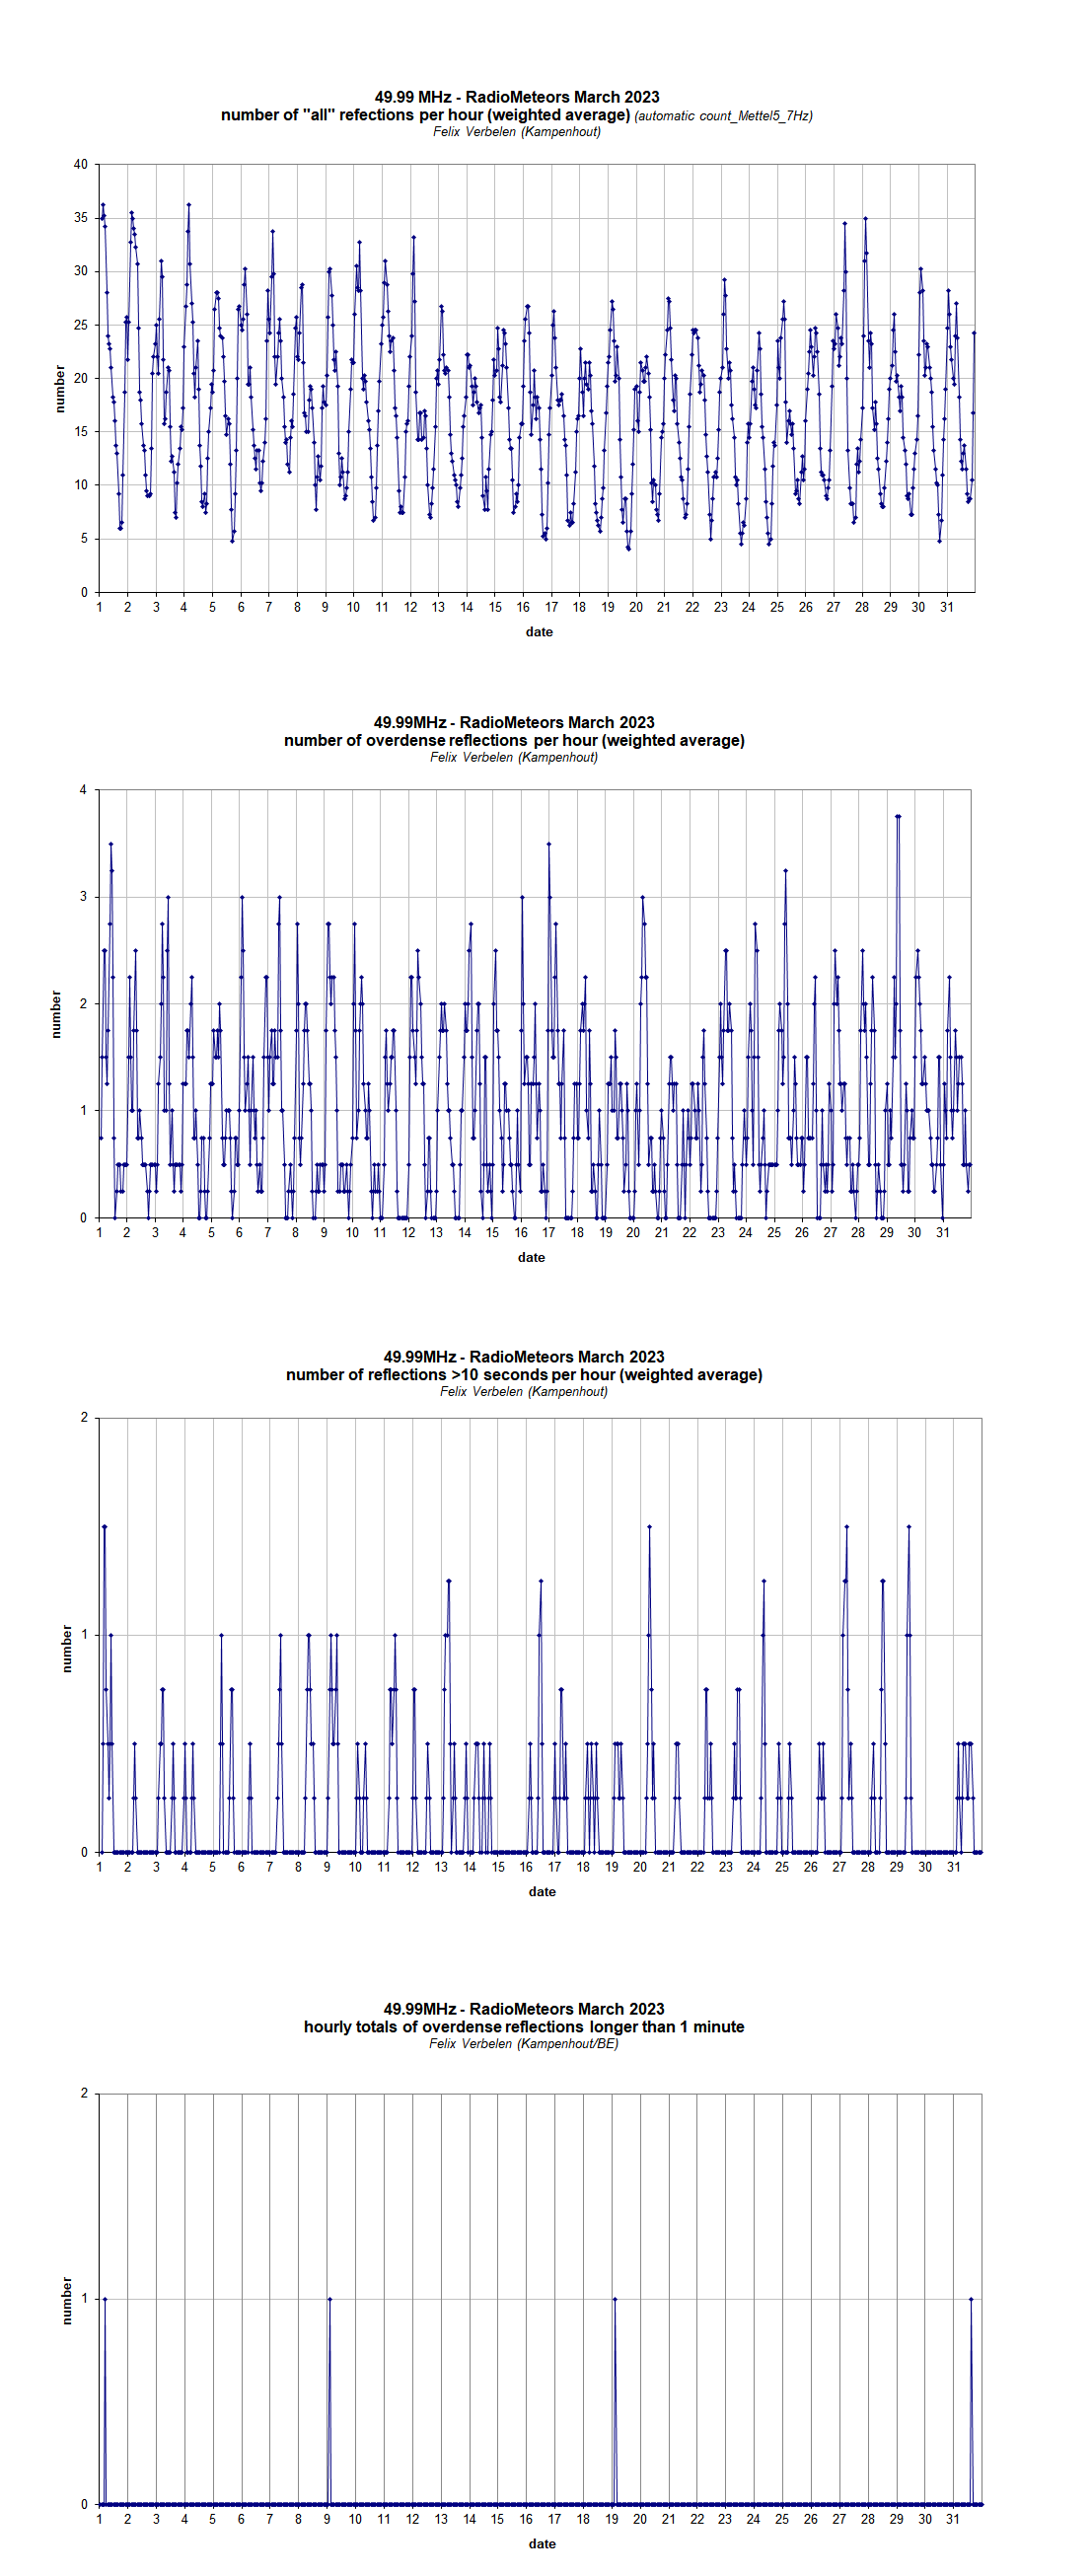
Figure 2 – The hourly numbers of “all” reflections counted automatically, and of manually counted “overdense” reflections, overdense reflections longer than 10 seconds and longer than 1 minute, as observed here at Kampenhout (BE) on the frequency of our VVS-beacon (49.99 MHz) during March 2023.
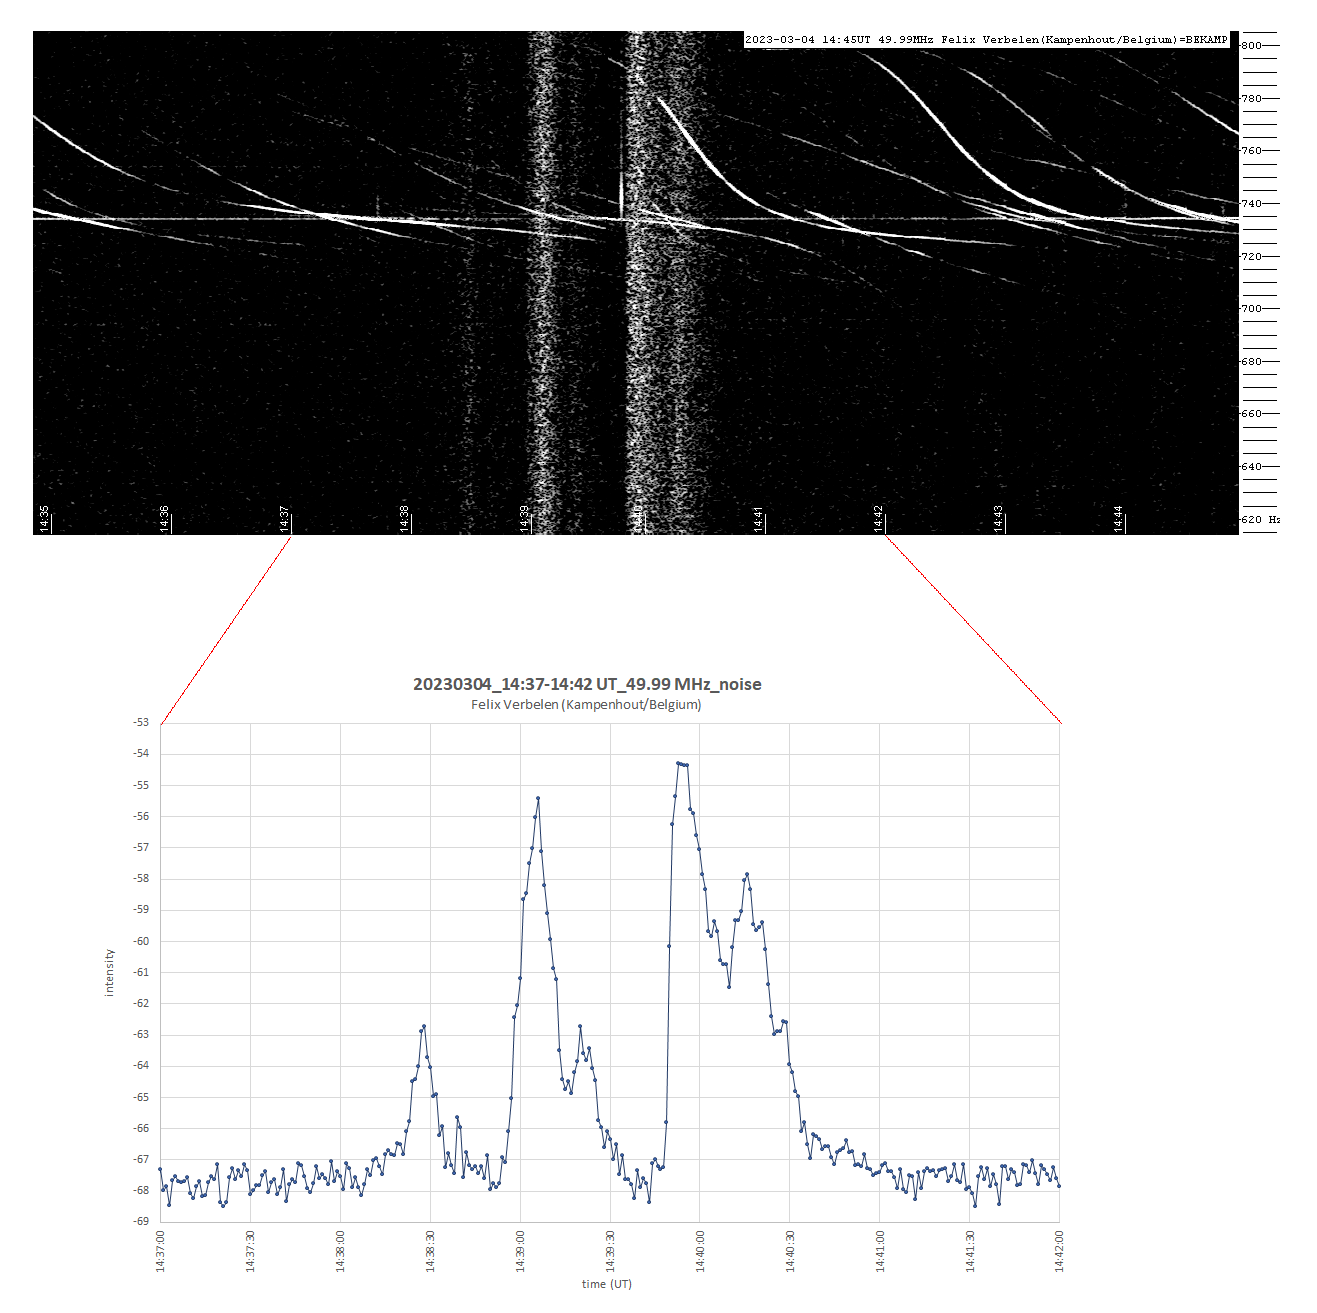
Figure 3 – Solar noise outburst on 4 March 2023.
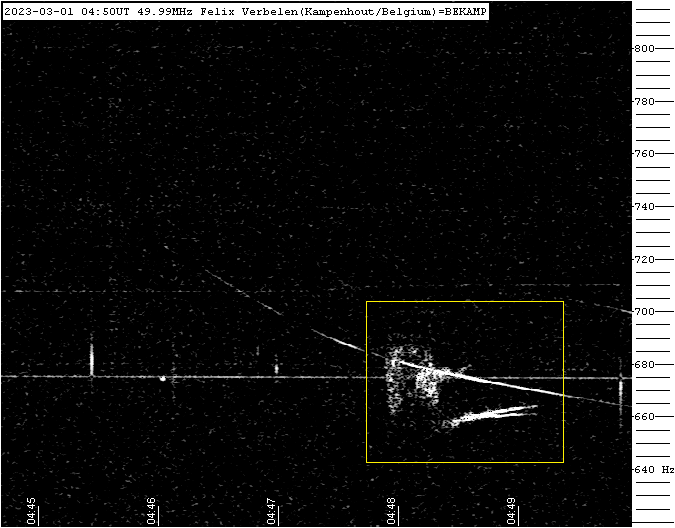
Figure 4 – Meteor echo 1 March 2023, 4h50m UT.
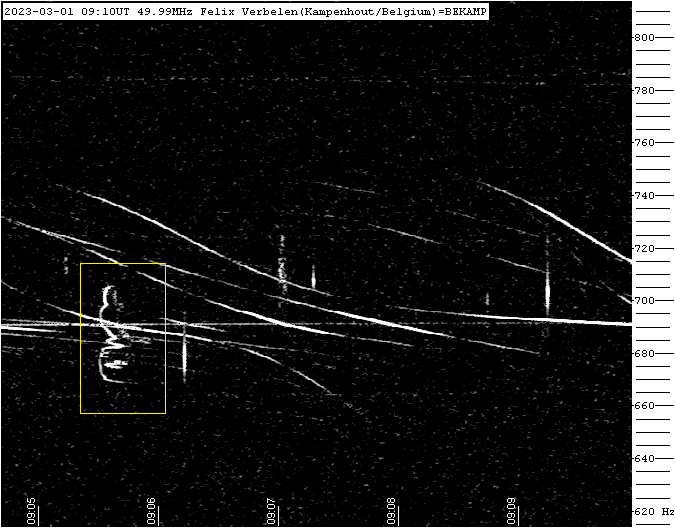
Figure 5 – Meteor echo 1 March 2023, 9h10m UT.
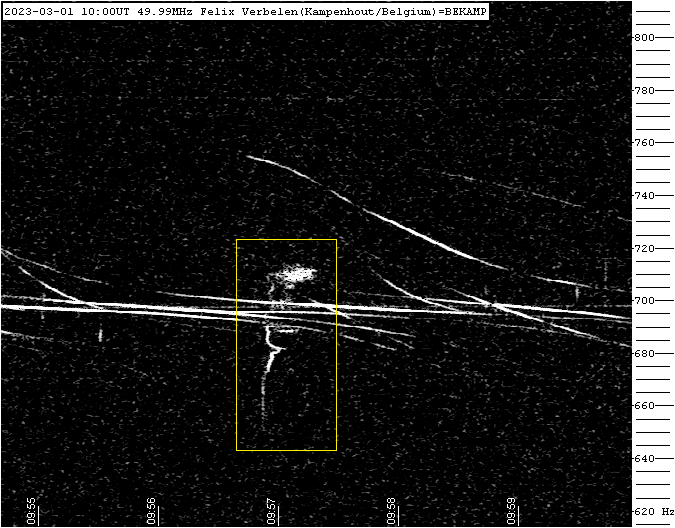
Figure 6 – Meteor echo 1 March 2023, 10h00m UT.
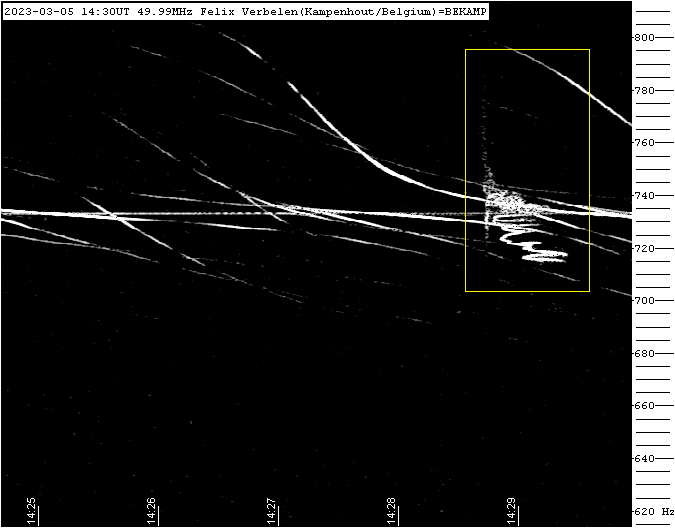
Figure 7 – Meteor echo 5 March 2023, 14h30m UT.
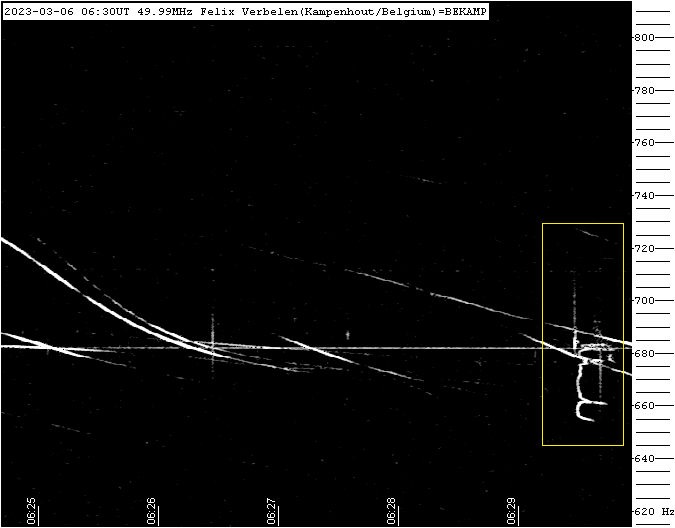
Figure 8 – Meteor echo 6 March 2023, 6h30m UT.
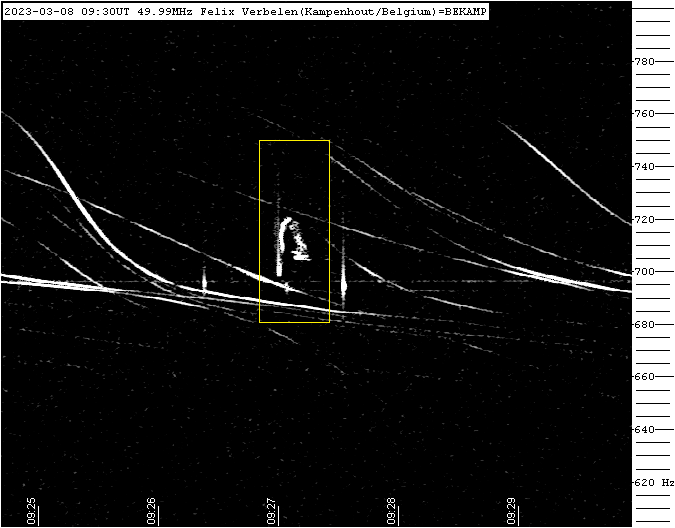
Figure 9 – Meteor echo 8 March 2023, 9h30m UT.
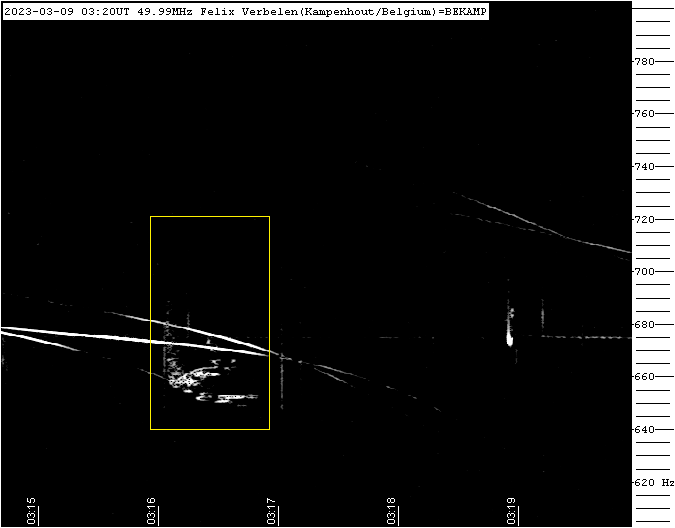
Figure 10 – Meteor echo 9 March 2023, 3h20m UT.
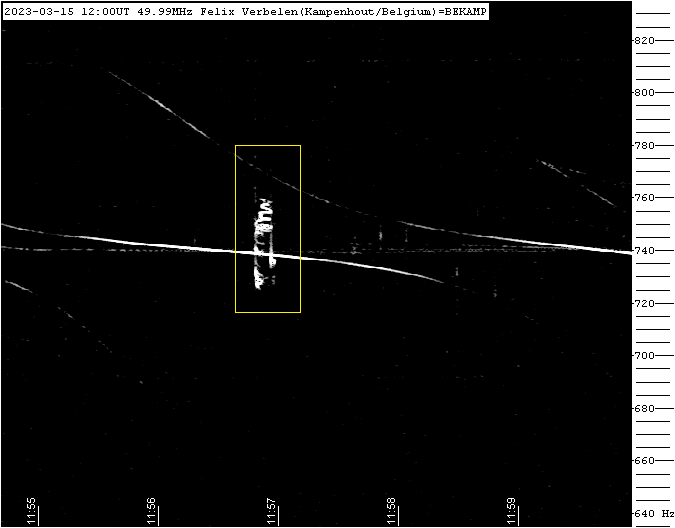
Figure 11 – Meteor echo 15 March 2023, 12h00m UT.
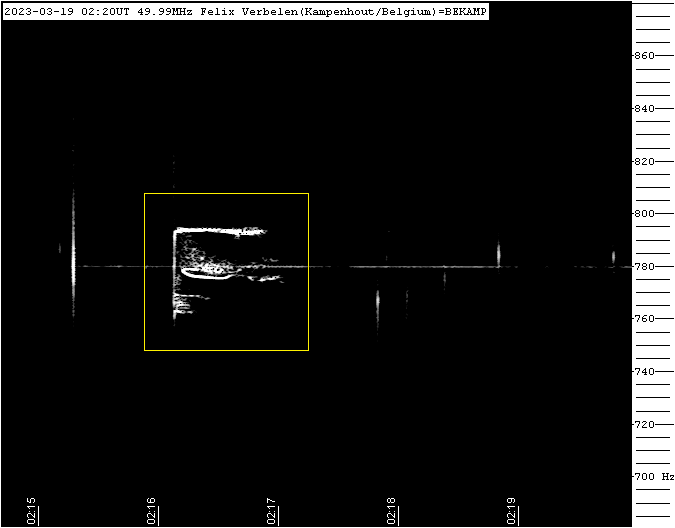
Figure 12 – Meteor echo 19 March 2023, 2h20m UT.
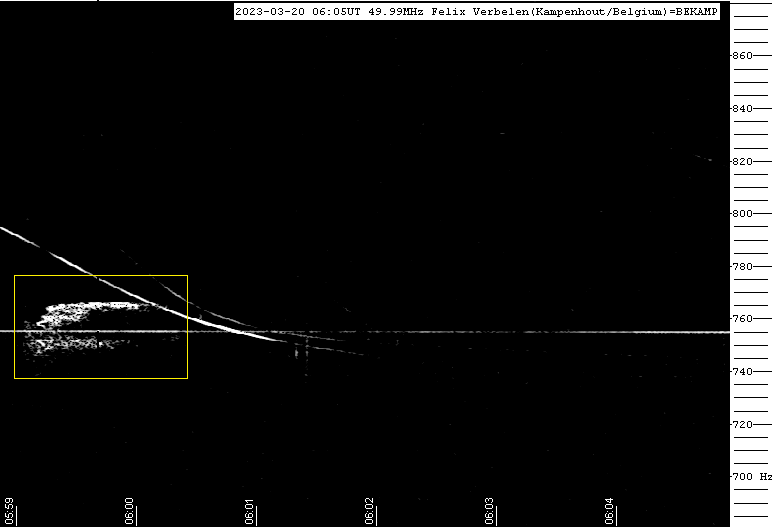
Figure 13 – Meteor echo 20 March 2023, 6h05m UT.
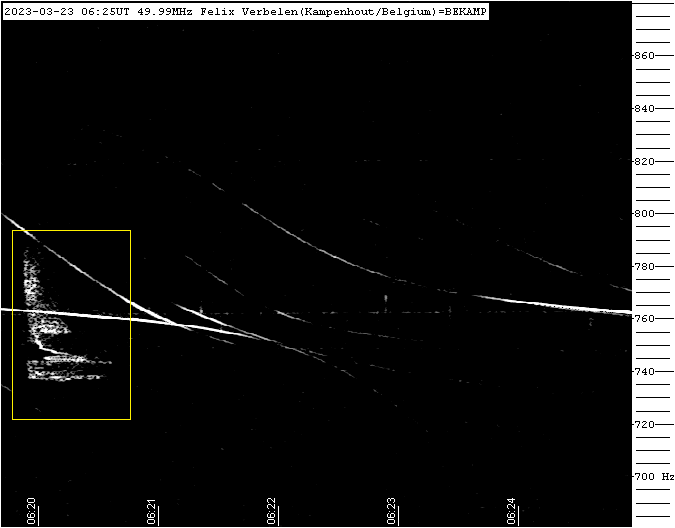
Figure 14 – Meteor echo 23 March 2023, 6h25m UT.
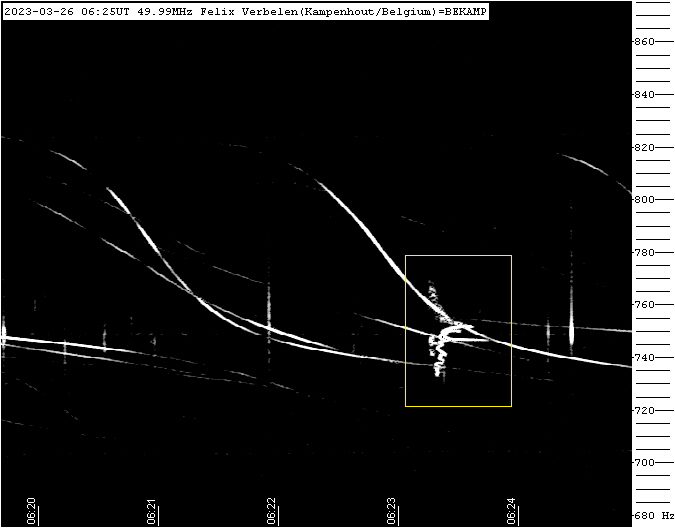
Figure 15 – Meteor echo 26 March 2023, 6h25m UT.
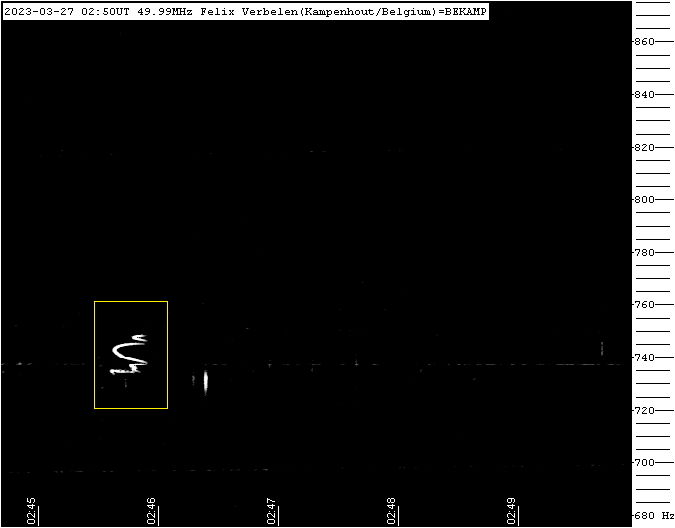
Figure 16 – Meteor echo 27 March 2023, 2h50m UT.
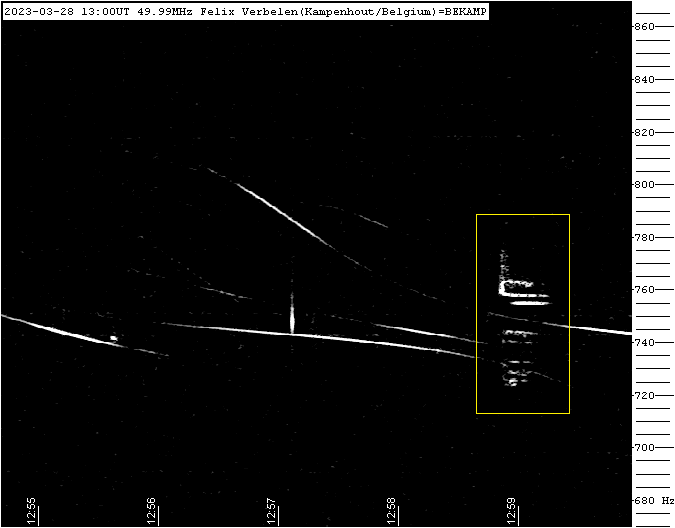
Figure 17 – Meteor echo 28 March 2023, 13h00m UT.
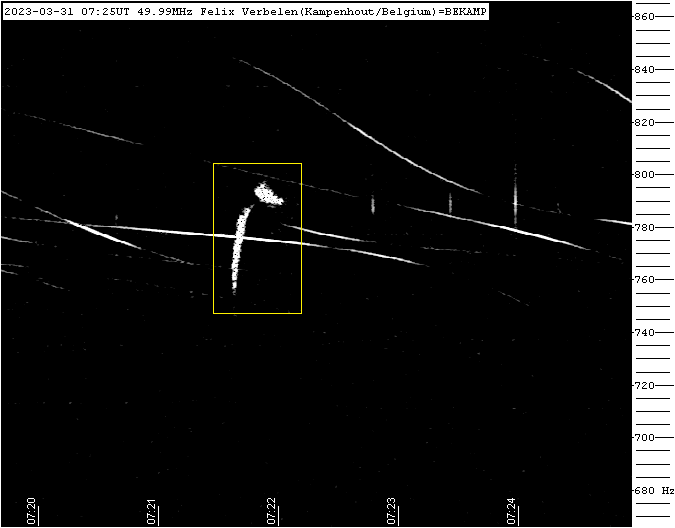
Figure 18 – Meteor echo 31 March 2023, 7h25m UT.
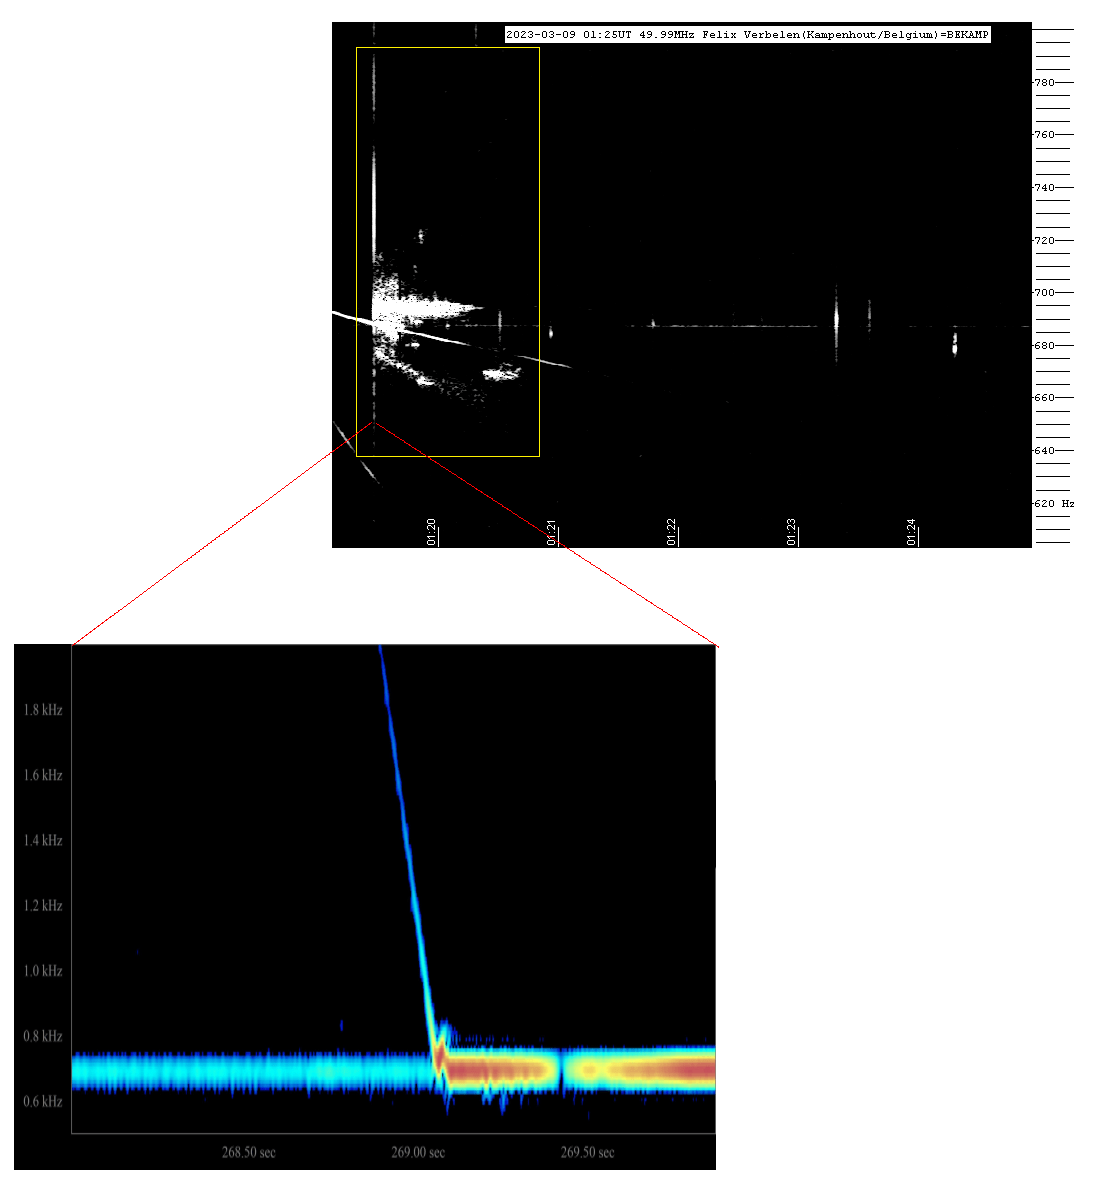
Figure 19 – Head reflections 9 March 2023, 01h19m UT.
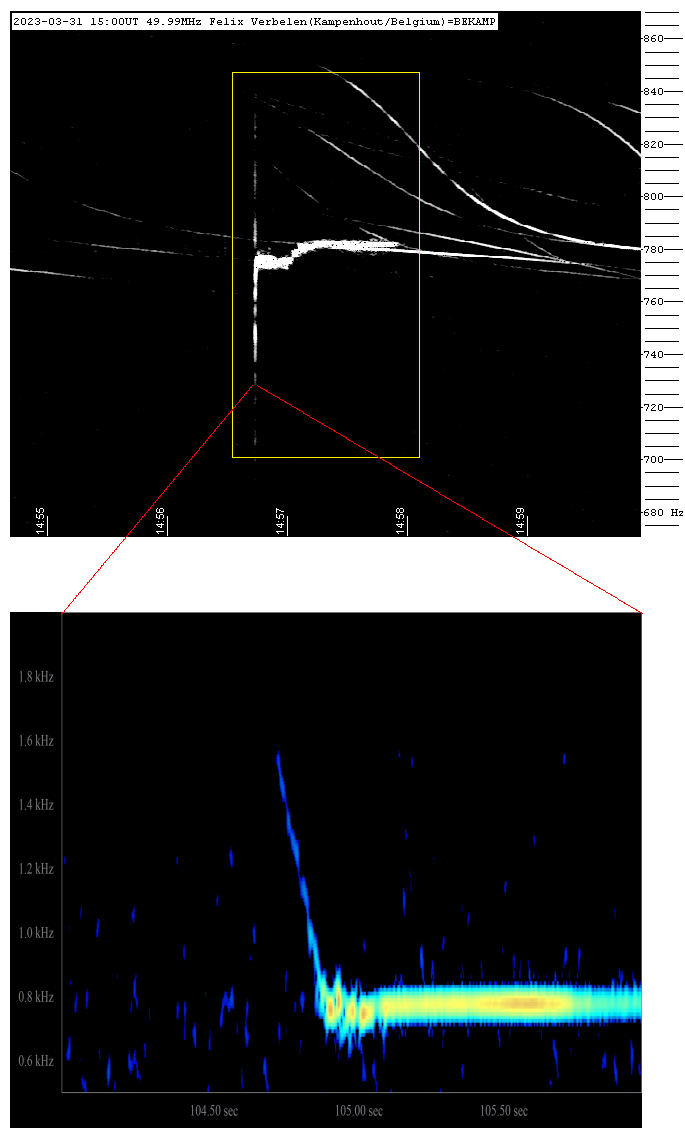
Figure 20 – Head reflections 31 March 2023, 14h56m UT.