Abstract: We challenge to investigate the magnitude ratio (r) of 14 major meteor showers using SonotaCo net video data: Quadrantids (QUA#010), Lyrids (LYR#006), eta Aquariids (ETA#031), Southern delta Aquariids (SDA#005), Capricornids (CAP#001), Perseids (PER#007), Orionids (ORI#008), STA_SE (Steady Expression of Southern Arietids, STA#002), STA_SF (Sharply Fluctuating component of ‘Southern Taurids’, STA#002), Northern Taurids (NTA#017), Leonids (LEO#013), sigma Hydrids (HYD#016), Geminids (GEM#004), and Comae Berenicids (COM#020). We compensate for the observation bias by using the sporadic meteor distribution and the results are in good agreement with past results. The magnitude ratio (r) and the beginning height of a meteor shower strongly relate, and these properties obtained by video observations give a useful clue to infer the origin of the meteoroids.
We study the two most important major meteor showers in detail (Perseids and Geminids) and find a very interesting peculiarity in the Geminids; brighter meteors with absolute magnitude MA < –2 decrease in number compared to sporadic meteors and other meteor showers of course, and the beginning height of Geminids is almost the same as for sporadic meteors.
1 Introduction
Video observations are now conducted on a large scale worldwide. Their results are usually used to detect unknown meteor showers, but other useful data are often disregarded: absolute magnitude and beginning height for example. The author tried to estimate the magnitude ratio from video data, however, photometry in video observations is unique for every observation system (Koseki, 2023). As Ceplecha showed the beginning height of a meteor path suggests the property of its meteoroid (Ceplecha, 1968), the author used this as an index of the meteor shower property in the case of the remnants from comet 73P/Schwassmann–Wachmann 3 (Koseki, 2022). A vast amount of video data has been accumulated but this has not been used to analyze major shower properties. We challenge here to show the importance of forgotten video data by representing the properties of major meteor showers using SonotaCo net video data (SonotaCo, 2009; SonotaCo et al., 2021).
2 Activity profile and mean magnitude
For each of the 14 major meteor showers, we will discuss in detail and show the activity profile and the mean absolute magnitude (MA) change (see Section 5). You may be wondering why the Southern Taurids (STA#002) are split. The author stressed that the “Southern Taurids” have two quite different activity peaks: one around October 13 and another around November 5 (Koseki, 2020).
These graphs display the sliding mean of the number of shower meteors (solid blue line) and of the absolute magnitude (dotted orange line) with 1 solar longitude bin; the number is divided by the years of the observations, which is 15 for representing the yearly average activity profile. These activity profiles are derived using the raw number and have not been compensated for the background sporadic meteor activity; observing conditions may have affected the profiles. This research aims to investigate the outline of the properties of meteor showers. If one intended to show more accurate activity profiles, this could be obtained by using the DR parameter (density ratio of shower meteors to sporadic meteors): see Koseki (2019).
We use the classification applied in SonotaCo net data except for the two STAs and NTA.
3 Magnitude ratio
3.1 Slope in the logarithm distribution
The magnitude ratio is determined by the slope of the logarithm distribution of meteor numbers along the magnitude; Figure 1 shows the distribution for the Perseids for example. But it is not so easy to determine the magnitude ratio, because the distribution cannot be expressed by a linear regression line (see Table 1).
Table 1 – The magnitude ratio estimated by several different magnitudes ranges for Figure 1. Slopes represent the results of the regression analysis in given magnitude ranges and the magnitude ratios are values corresponding to the slopes.
| Magnitude range | slope | Magnitude ratio |
| –7~–2 | 0.548 | 3.54 |
| –7~–3 | 0.625 | 4.22 |
| –7~–4 | 0.681 | 4.80 |
| –6~–2 | 0.494 | 3.12 |
| –6~–3 | 0.591 | 3.90 |
| –6~–4 | 0.681 | 4.80 |
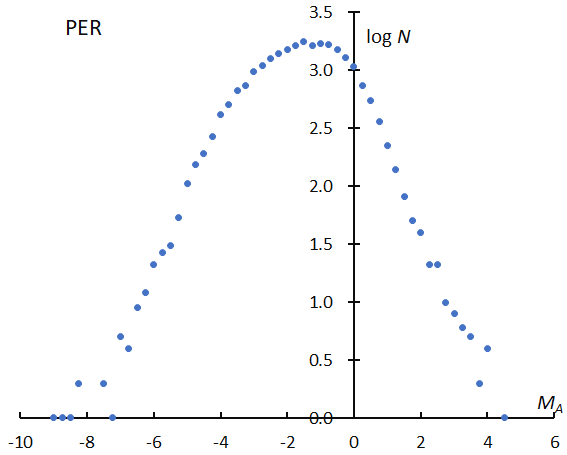
Figure 1 – The logarithm distribution of the number of meteors in function of the absolute magnitude for the Perseids. The classification of meteor showers is based on SonotaCo net.
Such a distribution as shown in Figure 1 reflects not only the real meteoroid distribution but also the observational selection. Video observations have problems with their photometric techniques as well as with the perception of the meteor magnitude. If we could estimate the perception coefficients for SonotaCo net system, the magnitude distribution might be represented by a smoother line.
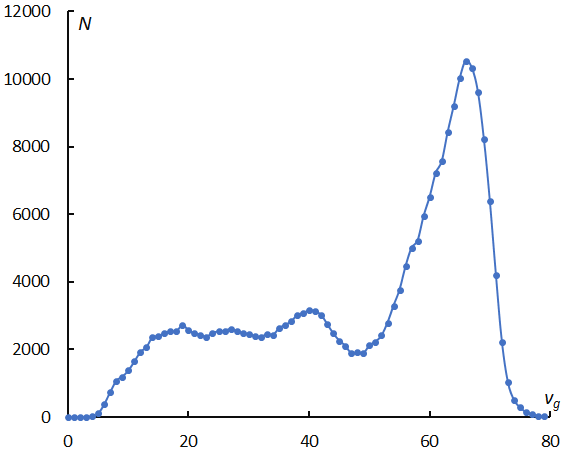
Figure 2 – The velocity distribution of sporadic meteors in video observations. It is important to note that different observation techniques give different results.
We know there are two meteor groups divided by a geocentric velocity vg of 50 km/s (Figures 2 and 3). Figure 2 represents the sporadic meteor number distribution against the geocentric velocity; it should be stressed that this graph is for SonotaCo net and the shapes of the graphs differ depending on observational techniques although the two groups are obvious in these graphs (Koseki, 2015).
Figure 3 displays the ratio of the number of meteors with vg less than 50 km/s to the number with vg faster than 50 km/s, standardized by each total number of meteors against the meteor magnitude. There are two striking characteristics; the slower meteors with MA = –3~–4, exceed the faster ones by more than a factor of two and the change in MA is very regular. We can suggest two reasons; both the perception coefficients and the magnitude ratio vary with the geocentric velocity.
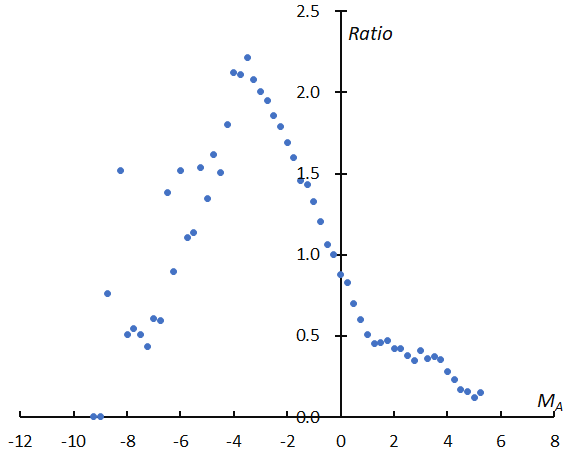
Figure 3 – The ratio of the number of meteors slower than 50 km/s to the number of faster meteors against the meteor magnitude. This graph is standardized by each total number of meteors and we can see that the faster meteors dominate in fainter meteors MA > 0 and the brightest range MA < –5.
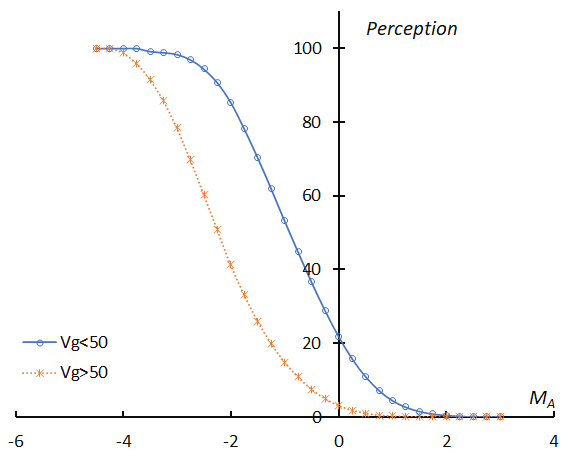
Figure 4 – Perception coefficients for meteors slower than 50 km/s and faster than 50 km/s with the assumption r = 3.18 for meteors slower than 50 km/s and r = 4.24 for faster meteors.
We estimate two perception coefficients, one for meteors slower than 50 km/s and one for faster meteors. Figure 4 shows the smoothed lines of these coefficients. If we correct the number distribution of the Perseids using the perception coefficient for meteors faster than 50 km/s, a pretty good distribution can be plotted in Figure 5 compared to Figure 1. We can get r = 3.04 from the slope between MA = –4 and MA = 0. The used coefficient is temporary because the values in Figure 4 are estimated by the assumption of r = 3.18 for meteors slower than 50 km/s and r = 4.24 for faster meteors. The magnitude ratio and the perception coefficient might change with the geocentric velocity, and, therefore, r = 3.04 for the Perseids seems to be overestimated. SonotaCo net has piled up a great amount of data, but this data is still not enough to evaluate the perception coefficient changes in function of the geocentric velocity.
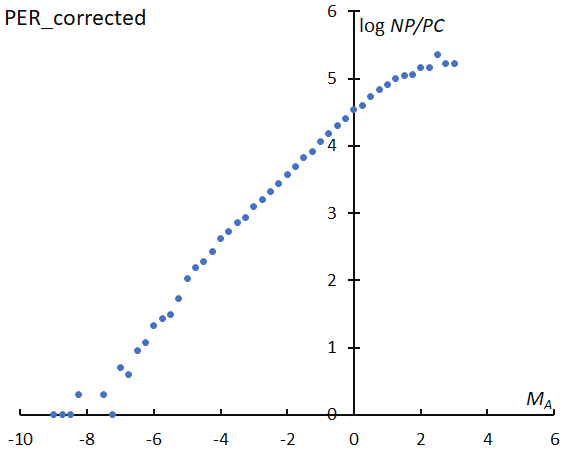
Figure 5 – The corrected logarithm distribution of meteor numbers against the magnitude for the Perseids using the perception coefficient curve for meteors faster than 50 km/s.
We try to search for another way to obtain the magnitude ratio; we study the ratio of shower meteors to sporadic meteors instead of the perception coefficient. If the perception coefficients of both shower meteors and sporadic ones are assumed to be equal, we could calculate the magnitude ratio using the ratio of shower meteors and sporadic ones; , where ssh is the slope of the shower meteors to the sporadic meteors and ssp is the slope of the sporadic meteors. First of all, it is necessary to investigate how the magnitude ratio of sporadic meteors changes with the geocentric velocity.
3.2. Magnitude ratio dependence on a geocentric velocity
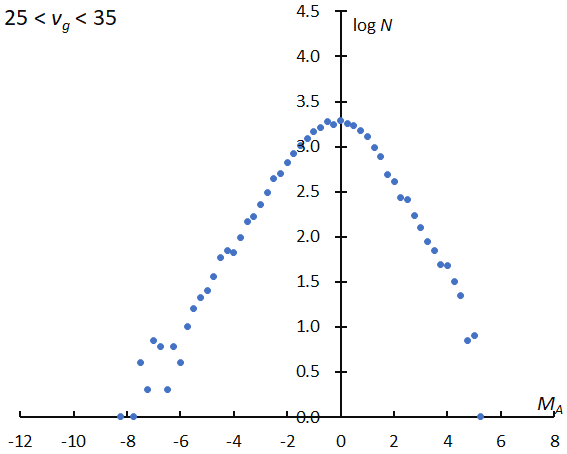
Figure 6a – The logarithm distribution of the number of sporadic meteor against absolute magnitude MA, for 25 km/s < vg < 35 km/s.
As suggested by Figure 3, the magnitude ratio of sporadic meteors varies with the geocentric velocity. We divided sporadic meteors into 14 groups with 10 km/s bins in geocentric velocity overlapping 5 km/s each, vg < 15, 10 < vg < 20, 15 < vg < 25, and so on. Figures 6a and 6b show the logarithm distribution for 25 < vg < 35 and 60 < vg < 70 as examples. The two graphs show that the slopes are different. The slope of the faster meteors is steeper (Figure 6b). But, the two graphs are not straight lines, and it is difficult to select the most suitable section (Table 2).
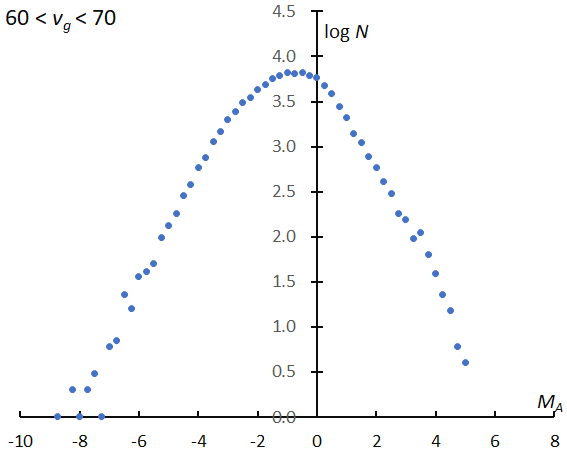
Figure 6b – The logarithm distribution of the number of sporadic meteor against absolute magnitude MA, for 60 km/s < vg <70 km/s.
Table 2 – The slopes of the logarithm distribution and the derived magnitude ratios in the different magnitude ranges for Figures 6a and 6b.
| 25 < vg < 35 | |||||
| Range | –6~–4 | –5~–3 | –4~–2 | –6~–2 | –6~–3 |
| slope | 0.586 | 0.455 | 0.489 | 0.5 | 0.521 |
| r | 3.85 | 2.85 | 3.09 | 3.16 | 3.32 |
| 60 < vg < 70 | |||||
| Range | –6~–4 | –5~–3 | –4~–2 | –6~–2 | –6~–3 |
| slope | 0.634 | 0.593 | 0.437 | 0.556 | 0.612 |
| r | 4.31 | 3.92 | 2.73 | 3.6 | 4.1 |
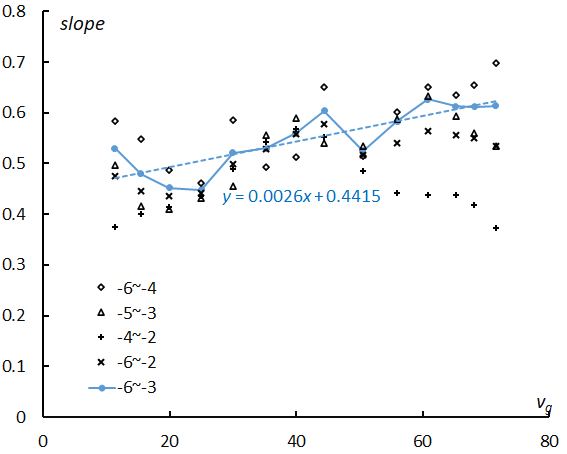
Figure 7 – Changes in the slopes shown in Table 2 along with the geocentric velocity. The values of the slopes for the most plausible range –6 < MA < –3 are connected, and the result of the regression analysis is shown as inset.
We plot the slopes and the estimated magnitude ratios for all groups in Figure 7. The range MA = –4~–2 is clearly influenced by the perception coefficient which becomes lower for faster meteors, and the slope is dropping after vg > 50 km/s. The range MA = –6~–2 seems to be influenced by the perception coefficient because meteors fainter than MA > –3 may be overlooked. Therefore, we select the range MA = –6~–3, because the range is wider than the other two ranges and gives moderate magnitude ratios. We use the result of the linear regression analysis to estimate the magnitude distribution of sporadic meteors hereafter.
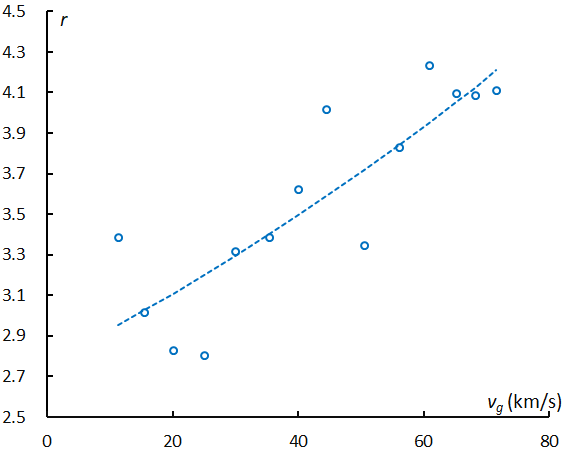
Figure 8 – Estimated magnitude ratio for sporadic meteors with geocentric velocity derived from the slopes of –6 < MA < –3 in Figure 7. The dashed line is given by the result of the regression analysis in Figure 7 and we use it hereafter for the estimation of the magnitude ratio of shower meteors.
Figure 8 shows the estimated magnitude ratio of sporadic meteors based on the slopes for the range MA = –6~–3, and the smoothed line represents the relationship of the slope of the magnitude distribution with the geocentric velocity as the result of the regression analysis.
3.3. Ratio of shower meteors to sporadic meteors
We know the dependence of the magnitude ratio of sporadic meteors on the geocentric velocity (Figure 8), and, therefore, we can estimate the magnitude ratio of the shower meteors by calculating the ratio of shower meteors to sporadic meteors against the absolute magnitude.
It is necessary to examine the magnitude distribution around the mean geocentric velocity of the shower meteors in order to calculate the ratio. Figure 9 shows the magnitude distribution of sporadic meteors around vg = 58.7 km/s, which is the mean geocentric velocity of the Perseids; we choose the velocity range as ±5 km/s: vg = 53.7~63.7 km/s. Figure 10 gives the results for the comparison of Figure 1 with Figure 9: the ratio of the number of Perseids to sporadic meteors in a logarithm distribution. It seems to be better to adopt a linear regression to the graph of Figure 10 rather than to Figure 5. We exclude both the ranges brighter than MA < –4 and fainter than MA > +2, because the smaller numbers of data cause uncertainties. The magnitude ratio of the Perseids, then, can be calculated by estimating the slope of the sporadic meteors for vg = 58.7 km/s which is 0.5914 in Figure 7 and the slope of the Perseids to sporadic meteors in Figure 10 is –0.1956: r = 10(0.5914–0.1956) = 2.49.
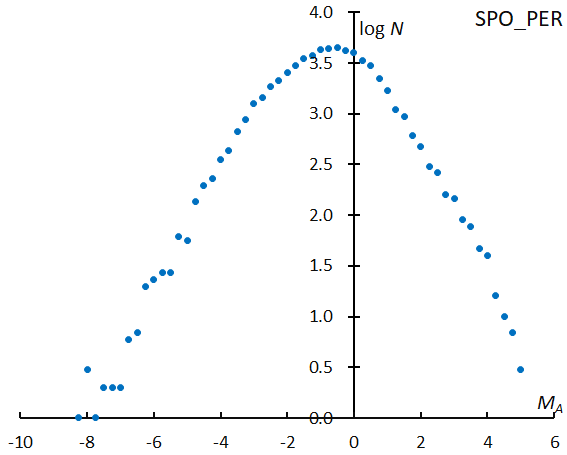
Figure 9 – The magnitude distribution of sporadic meteors vg = 58.7 ± 5 km/s, which is around the mean magnitude of the Perseids.
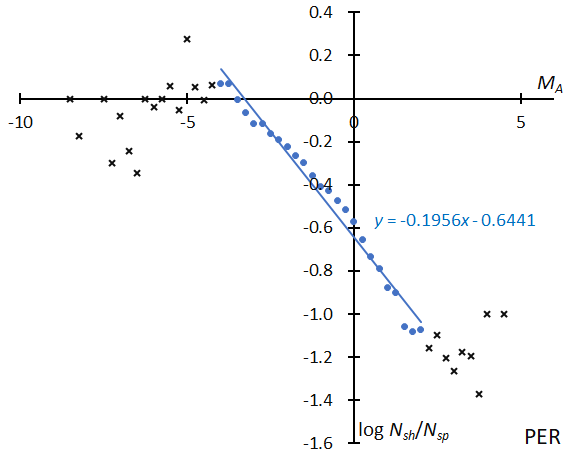
Figure 10 – The logarithm distribution of the ratio of the number of Perseids (Figure 1) to sporadic meteors (Figure 9).
We can confirm the workability of the ratio of shower meteors to sporadic meteors by applying this method to the major showers (see Figures 12, 15, 18, 21, 24, 27, 31, 35, 39, 43, 46, 49, 52 and 55). The full line is the result of the linear regression analysis between MA = –4~+2. Crosses on both sides are excluded from the analysis because of the scarcity of data. Because all abscissas in the above-mentioned figures are the same and the widths of the ordinates are the same, we can derive the difference in the magnitude distribution as seen in the slope of the figures. A steep slope means such a meteor shower is rich in bright meteors and a flatter one suggests it is rich in faint meteors. Both enhanced activities of the Orionids in 2007–09 and the STA_SF display were rich in bright meteors. We can see the explanation for the difference in the mean magnitude (see Figures 11, 14, 17, 20, 23, 26, 29, 30, 34, 37, 38, 42, 45, 48, 51 and 54) from another point of view. The slopes of the logarithm distribution of the ratio of shower meteors relative to sporadic meteors in function of the absolute magnitude shows that the magnitude ratios are different in each meteor showers.
Table 3 – Magnitude ratio of the major 14 meteor showers. vg is the mean geocentric velocity of the shower. The slope is the slope of the magnitude distribution and r is the magnitude ratio. Each upper line is for sporadic meteors estimated by the relation shown in Figure 7 and each lower line is for the meteor shower.
| QUA | LYR | ETA | SDA | CAP | PER | ORI1 | ORI2 | _SE | _SF1 | _SF2 | NTA | LEO | HYD | GEM | COM | |
| vg | 40.2 | 46.6 | 65.6 | 39.7 | 22.3 | 58.7 | 65.9 | 65.9 | 28.5 | 27.9 | 27.9 | 27.3 | 69.9 | 59.4 | 33.8 | 62.9 |
| slope | 0.544 | 0.561 | 0.609 | 0.543 | 0.498 | 0.591 | 0.61 | 0.61 | 0.514 | 0.513 | 0.513 | 0.511 | 0.62 | 0.593 | 0.528 | 0.602 |
| -0.095 | -0.161 | -0.007 | -0.076 | -0.161 | -0.196 | -0.126 | -0.036 | 0.076 | -0.146 | 0.018 | -0.063 | -0.167 | -0.06 | -0.1 | -0.083 | |
| r | 3.5 | 3.64 | 4.06 | 3.49 | 3.15 | 3.9 | 4.07 | 4.07 | 3.27 | 3.26 | 3.26 | 3.25 | 4.17 | 3.92 | 3.37 | 4 |
| 2.81 | 2.51 | 4 | 2.93 | 2.17 | 2.49 | 3.05 | 3.75 | 3.89 | 2.33 | 3.39 | 2.81 | 2.84 | 3.42 | 2.68 | 3.31 |
Table 4 – Survey outline for the beginning height. Shower codes are listed in the first line: ORI1 is for the enhanced activity of ORI and ORI2 for the regular years. _SE, _SF1, and _SF2 correspond to STA_SE, enhanced activity of STA_SF and regular years respectively. The two λʘ give the activity interval, we used the QUA meteors between λʘ = 282.6~283.6° for example. The two vg lines give the upper and lower values of the geocentric velocity of sporadic meteors, we selected sporadic meteors between vg = 38.4~42.0 for QUA, that is, in the range of ±1σ of the mean velocity of QUA.
| QUA | LYR | ETA | SDA | CAP | PER | ORI1 | ORI2 | _SE | _SF1 | _SF2 | NTA | LEO | HYD | GEM | COM | |
| λʘ | 282.6 | 31.9 | 44 | 126 | 125 | 139.5 | 206 | 206 | 195 | 218 | 218 | 222 | 234 | 250 | 262.5 | 259 |
| 283.6 | 32.9 | 49 | 130 | 133 | 140.5 | 210 | 212 | 205 | 224 | 224 | 234 | 239 | 260 | 263 | 279 | |
| vg | 38.4 | 44.7 | 63.6 | 37.8 | 20.5 | 56.5 | 63.9 | 63.4 | 26.3 | 26.5 | 25.2 | 24.7 | 67.7 | 56.7 | 31.8 | 60.6 |
| 42 | 48.6 | 67.6 | 41.6 | 24 | 60.9 | 68.2 | 68.2 | 30.6 | 30.3 | 29.7 | 29.9 | 72.1 | 62 | 35.8 | 65.3 |
3.4. Estimate of the magnitude ratio of shower meteors
It may be enough to determine how rich in bright or faint meteors a meteor shower is, by showing the slope of the ratio of shower meteors to sporadic ones. But it is convenient for readers to calculate the magnitude ratio and it is very easy because we have gotten the slopes of major showers and the relation of the slope of sporadic meteors with a given geocentric velocity. We can calculate the magnitude ratio by the formula; , where ssh is the slope of the shower meteors to sporadic meteors and ssp is the slope of the sporadic meteors estimated by the relation shown in Figure 7.
4 Beginning height
The beginning height of meteors is the clue to understanding the meteoroid properties (Cook, 1973). We investigated the beginning height of 14 major showers according to the conditions shown in Table 4.
The widths of the two axes are the same in for all showers, though the ranges of the beginning height (HB) are different from each other. The result of the linear regression for sporadic meteors is shown as a dashed line (blue) and that of the shower meteors with a solid line (orange), both are shown with the linear expression. We can estimate meteoroid properties for shower meteors by comparing them with the corresponding sporadic ones. If the beginning height of shower meteors is higher than that for the sporadic ones, we can infer that such meteoroids might be more porous than sporadic ones. The results are discussed shower by shower in Section 5.
5 Properties discussed by shower
5.1 Quadrantids (QUA#010)
The maximum of Quadrantids is narrow, and meteors classified as Quadrantids in SonotaCo net beyond the 2 days maximum might be contaminated by sporadic meteors or by other minor shower activities such as DAD. The mean absolute magnitude (MA) drops about 0.5 magnitude at the maximum, brighter meteors become more abundant at the maximum. The changes in the mean magnitude apart from the maximum are very uncertain because of the small number of shower meteors (Figure 11).
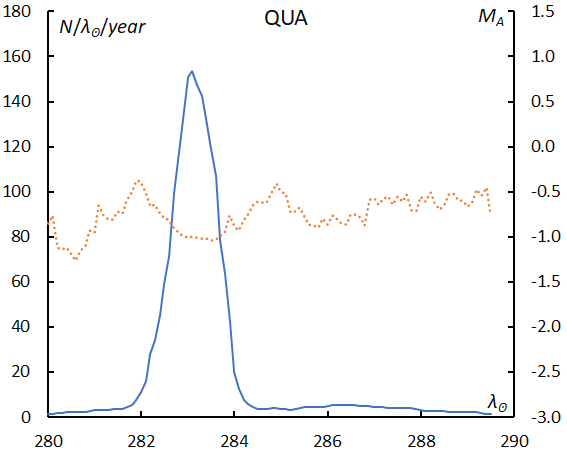
Figure 11 – The sliding mean of the number of Quadrantids (solid line, blue) and of the absolute magnitude (dotted line, orange) using with 1 solar longitude bin; the number is divided by the number of years of the observations.
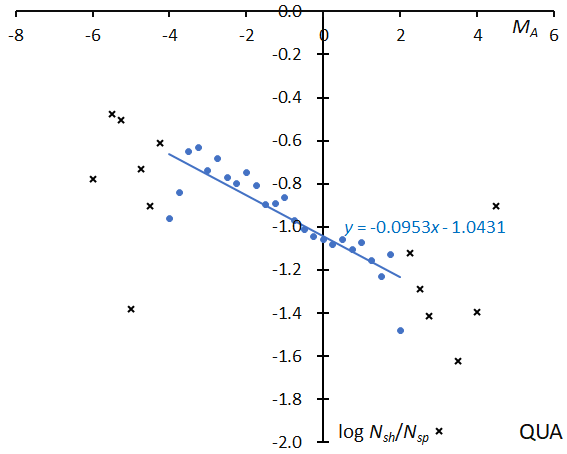
Figure 12 – The solid line indicates the result of the linear regression analysis for the Quadrantids between MA = –4~+2, crosses on both sides are excluded from the analysis because of the scarcity of the data.
The two filled circles on the left side and one in right are lower than the line because of the scarcity of data, but excluded data shown in crosses are consistent with the expected extension of the line. The slope suggests QUA belongs to the ecliptic meteor showers (Figure 12).
The beginning height of QUA is slightly above the sporadic ones (Figure 13). If QUA has common ancestors with SDA, the larger perihelion distance of QUA could be the cause of the difference.
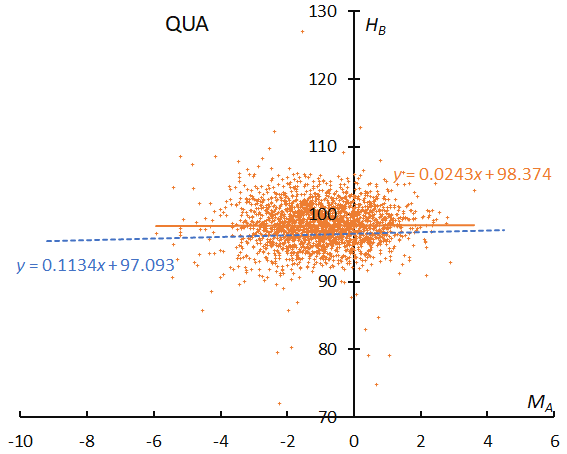
Figure 13 – The result of the linear regression for sporadic meteors is shown as a dashed line, that of the Quadrantids as a solid line.
5.2 Lyrids (LYR#006)
The activity period of Lyrids is also short, and the activity level is lower than for the Quadrantids. The mean magnitude change, therefore, is uncertain but seems to be lower than for the Quadrantids and richer in brighter meteors (Figure 14).
The slope is approximately comparable to CAP and suggests that LYR produces abundantly bright meteors (Figure 15). The beginning height of LYR is clearly higher than for QUA. The meteoroids of LYR could have a cometary origin and might be more porous than those of QUA (Figure 16).
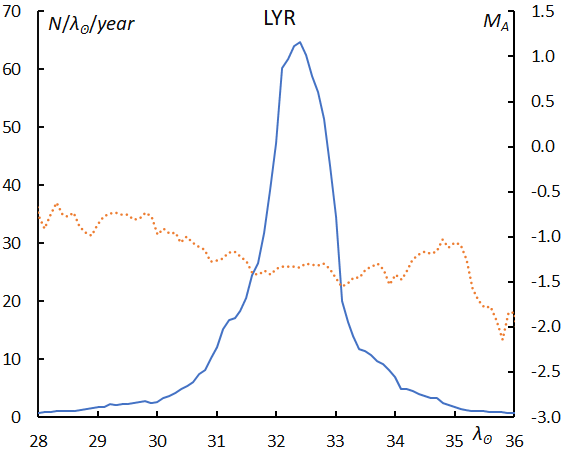
Figure 14 – The sliding mean of the number of Lyrids (solid line, blue) and of the absolute magnitude (dotted line, orange) using with 1 solar longitude bin; the number is divided by the number of years of the observations.
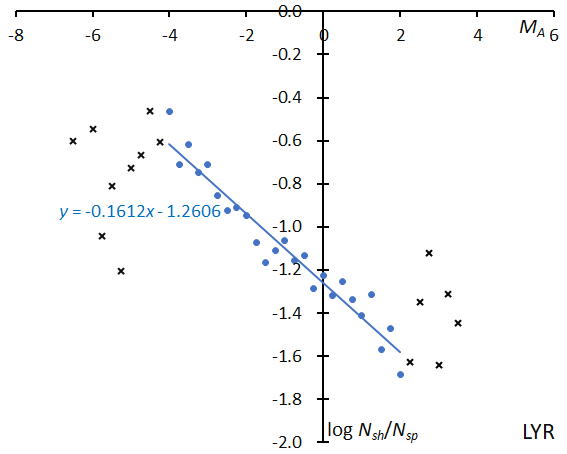
Figure 15 – The solid line indicates the result of the linear regression analysis for the Lyrids between MA = –4~+2, crosses on both sides are excluded from the analysis because of the scarcity of the data.
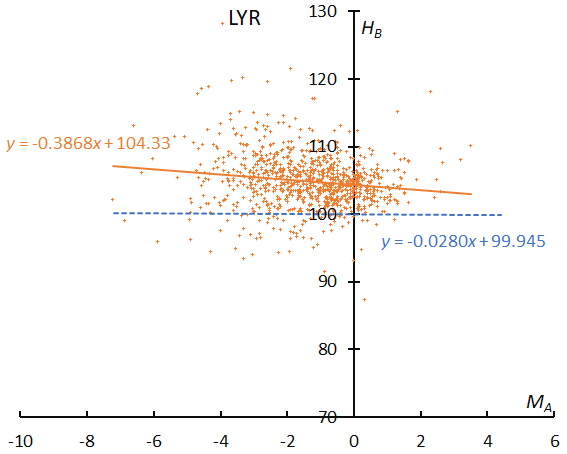
Figure 16 – The result of the linear regression for sporadic meteors is shown as a dashed line, that of the Lyrids as a solid line.
5.3 Eta Aquariids (ETA#031)
It is obvious that the double maximum is just apparent because of the short observation period in the morning twilight and the weather condition which often distorted the results of the observations. The mean magnitude is lower around the maximum like with the Quadrantids (Figure 17).
The slope is the smoothest among the major showers and is flatter than that of ORI in its regular years. This may be since ETA is farther away from the core of the meteoroid’s distribution derived from 1P/Halley than ORI, although the distance between the orbit of ETA and the parent comet is smaller than that of ORI (Figure 18).
The beginning height of ETA is slightly higher than ORI (both enhanced and regular years). This difference may be related to the distance from the orbit of 1P/Halley; the distance between descending nodes of ETA and 1P/Halley is closer than that of the ascending nodes of ORI and the comet (Figure 19).
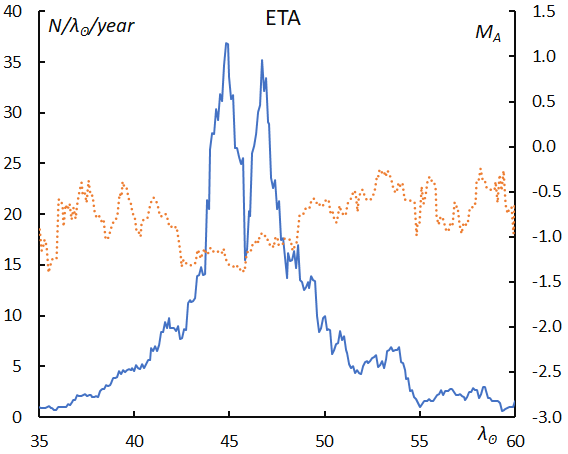
Figure 17 – The sliding mean of the number of eta Aquariids (solid line, blue) and of the absolute magnitude (dotted line, orange) using with 1 solar longitude bin; the number is divided by the number of years of the observations.
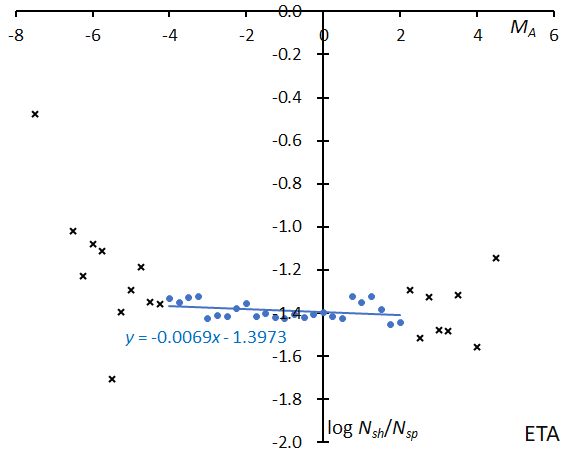
Figure 18 – The solid line indicates the result of the linear regression analysis for the eta Aquariids between MA = –4~+2, crosses on both sides are excluded from the analysis because of the scarcity of the data.
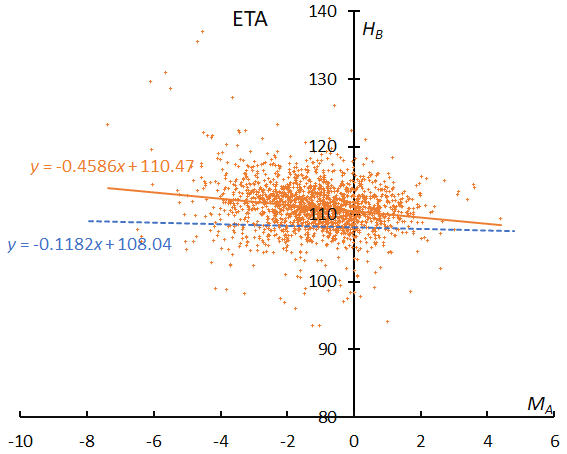
Figure 19 – The result of the linear regression for sporadic meteors is shown as a dashed line, that of the eta Aquariids as a solid line.
5.4 Southern delta Aquariids (SDA#005)
The mean magnitude does not show any distinct brightening around the maximum and is higher, that is, fainter than CAP (Figure 20).
SDA is active in late July at the same time as CAP, but the slopes of the two meteor showers show very well their difference in appearance. SDA meteors appear to be more like QUAs (Figure 21).
SDA is the only meteor shower for which the beginning height is lower than this for the sporadic meteors. The perihelion distance of SDA is the closest to the Sun among all 14 major meteoroid streams, and this might make meteoroids more solid (Figure 22).
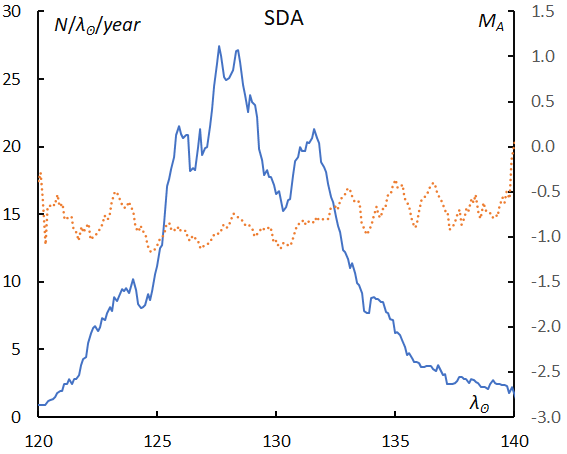
Figure 20 – The sliding mean of the number of Southern delta Aquariids (solid line, blue) and of the absolute magnitude (dotted line, orange) using with 1 solar longitude bin; the number is divided by the number of years of the observations.
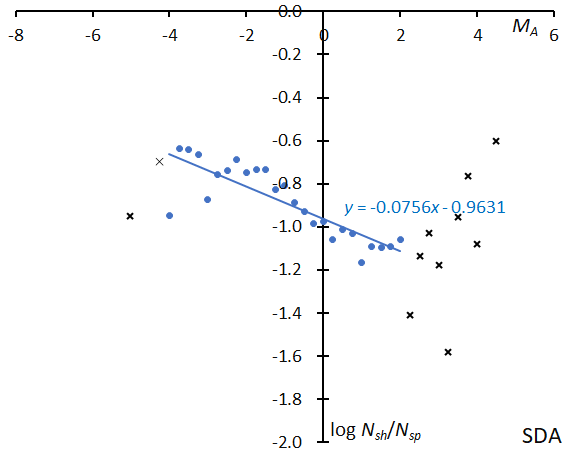
Figure 21 – The solid line indicates the result of the linear regression analysis for the Southern delta Aquariids between MA = –4~+2, crosses on both sides are excluded from the analysis because of the scarcity of the data.
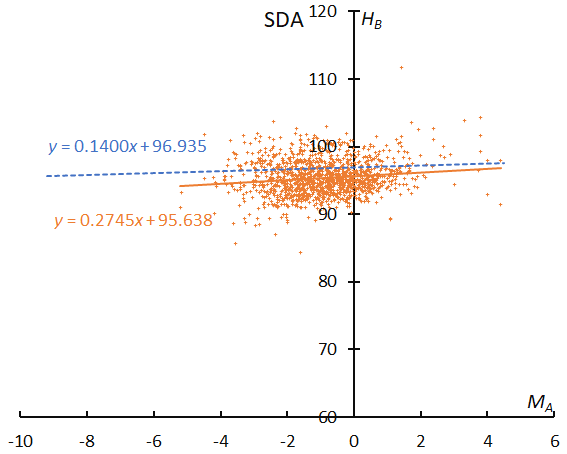
Figure 22 – The result of the linear regression for sporadic meteors is shown as a dashed line, that of the Southern delta Aquariids as a solid line.
5.5 Capricornids (CAP#001)
The first half of the activity profile is uncertain because of the bad weather condition in Japan and, therefore, the real maximum might be earlier. The mean magnitude deviates widely and clearly shows brightening around the maximum of the activity (Figure 23).
The slope is consistent with our experiences: we know CAP is one of the magnificent meteor showers producing conspicuous fireballs (Figure 24). This may suggest that CAP is of cometary origin and we encounter the very core of its meteoroid stream such as the Perseids and Leonids.
The beginning height of sporadic meteors is an ascending slope, and this is a common feature in the low-velocity range of meteors (see Figure 25 and other graphs of ecliptic showers). The beginning height of CAP is quite different from SDA and meteoroids of CAP are more fragile than those of SDA.
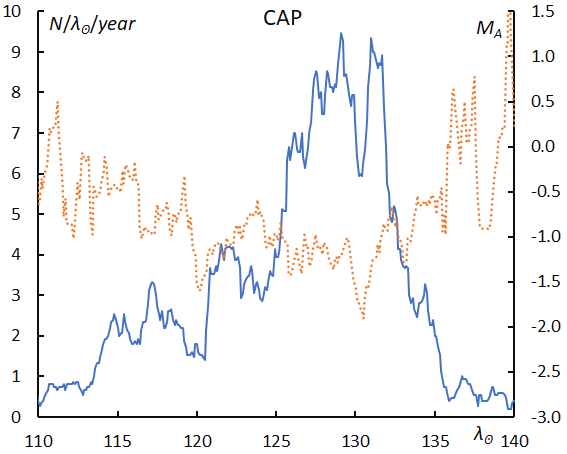
Figure 23 – The sliding mean of the number of Capricornids (solid line, blue) and of the absolute magnitude (dotted line, orange) using with 1 solar longitude bin; the number is divided by the number of years of the observations.
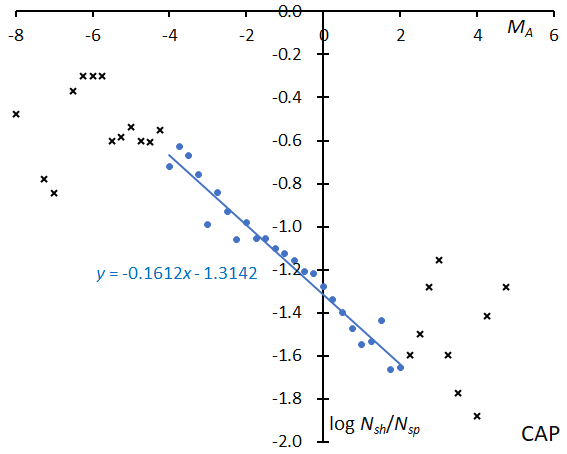
Figure 24 – The solid line indicates the result of the linear regression analysis for the Capricornids between MA = –4~+2, crosses on both sides are excluded from the analysis because of the scarcity of the data.
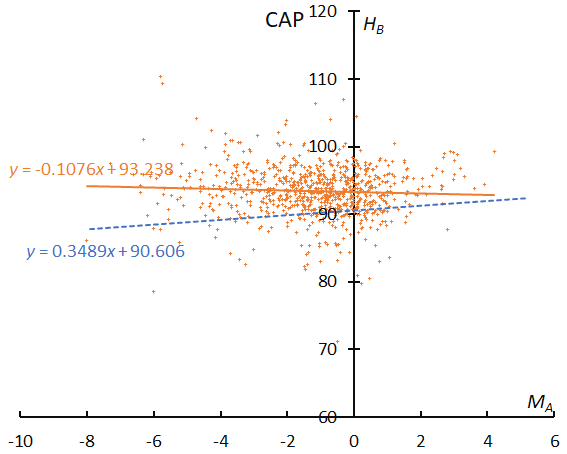
Figure 25 – The result of the linear regression for sporadic meteors is shown as a dashed line, that of the Capricornids as a solid line.
5.6 Perseids (PER#007)
Perseids are active during more than a month, and the mean magnitude gets brighter around the maximum although it remains in the bright range during the entire activity period (Figure 26).
The magnitude slope is the steepest among all major showers and, therefore, we can enjoy their summer fireworks (Figure 27). The distribution seems to be bulging in the middle; we will study this problem in Section 6.
The beginning height of the Perseids shows a descending slope, and this seems to be common for those of cometary origin (see ORI and LEO). The line for the sporadic meteors is flat although we choose the same geocentric velocity range as for PER (Figure 28).
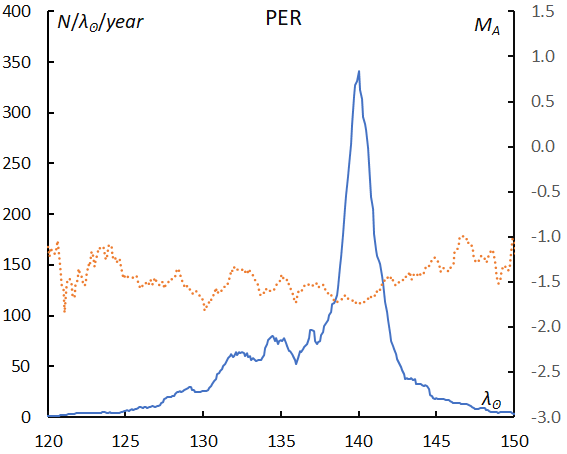
Figure 26 – The sliding mean of the number of Perseids (solid line, blue) and of the absolute magnitude (dotted line, orange) using with 1 solar longitude bin; the number is divided by the number of years of the observations.
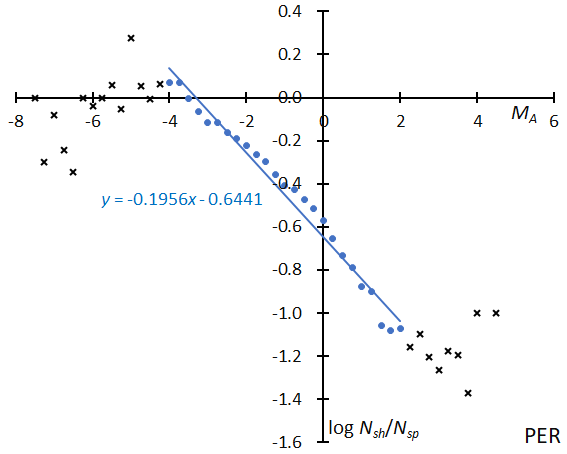
Figure 27 – The solid line indicates the result of the linear regression analysis for the Perseids between MA = –4~+2, crosses on both sides are excluded from the analysis because of the scarcity of the data.
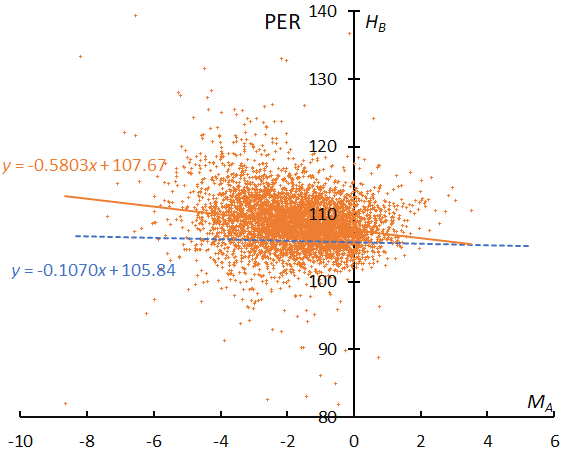
Figure 28 – The result of the linear regression for sporadic meteors is shown as a dashed line, that of the Perseids as a solid line.
5.7 Orionids (ORI#008)
SonotaCo net caught the enhanced activity of Orionids in 2007–09, and, therefore, we divide Orionids data into two parts: the enhanced period (2007–09) and the regular period (2010–22). The Orionids during enhanced years were about five times more abundant in numbers of meteors than in the regular years and with brighter meteors than the latter ΔMA = –0.5~–1.0. The left wing is different in both plots though the right wing is the same (Figures 29 and 30).
SonotaCo net captured the enhanced activities of ORI in 2007–09. The magnitude distribution in these years is clearly different from the regular years; we were closer to the core of the meteoroid concentration in the enhanced years than in the regular years (Figure 31).
The beginning height of ORI in enhanced years (Figure 33) clearly shows a descending slope and looks similar like ETA. The regression line for the regular years is even higher than the sporadic one (Figure 32).
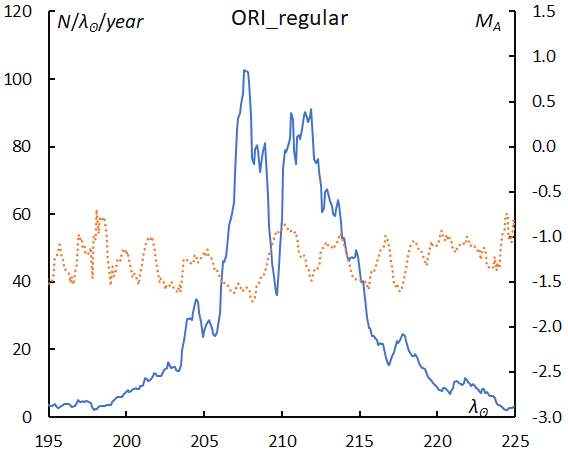
Figure 29 – The sliding mean of the number of Orionids regular activity (solid line, blue) and of the absolute magnitude (dotted line, orange) using with 1 solar longitude bin; the number is divided by the number of years of the observations.
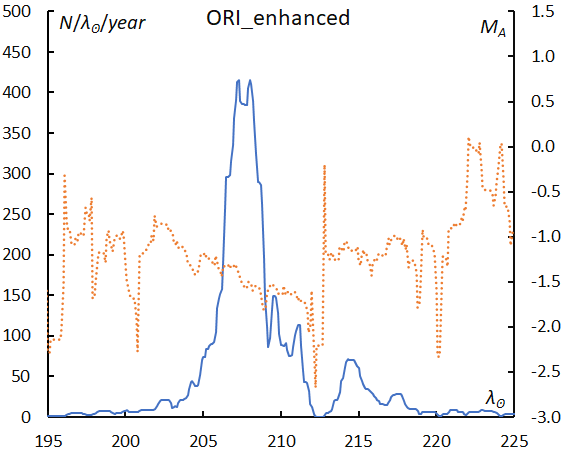
Figure 30 – The sliding mean of the number of Orionids during enhanced activity (solid line, blue) and of the absolute magnitude (dotted line, orange) using with 1 solar longitude bin; the number is divided by the number of years of the observations.
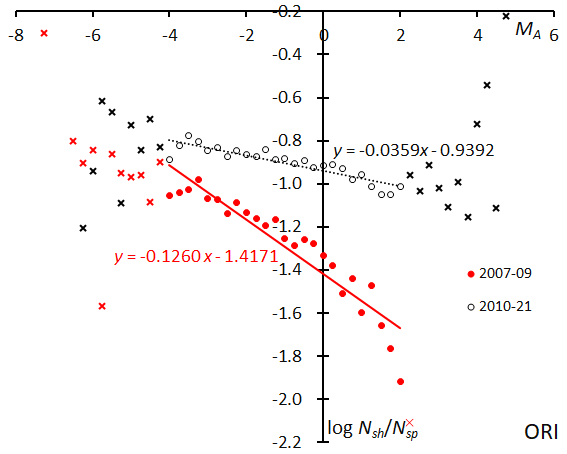
Figure 31 – The solid line indicates the result of the linear regression analysis for the Orionids during enhanced activity, the dotted line for the regular activity, between MA = –4~+2, crosses on both sides are excluded from the analysis because of the scarcity of the data.
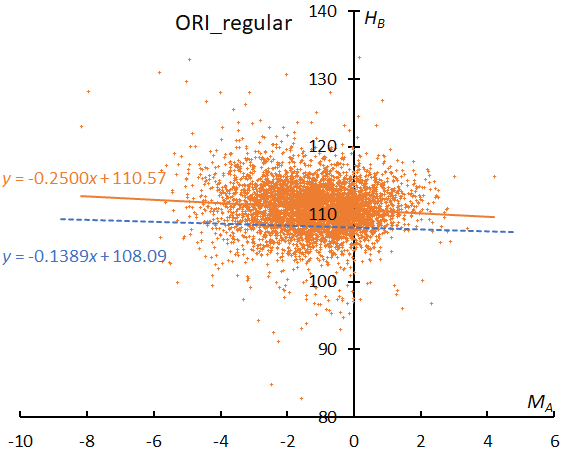
Figure 32 – The result of the linear regression for sporadic meteors is shown as a dashed line, that of the Orionids during regular activity as a solid line.
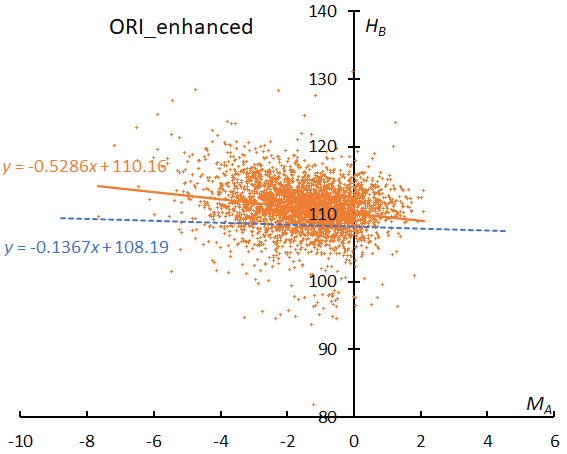
Figure 33 – The result of the linear regression for sporadic meteors is shown as a dashed line, that of the Orionids during enhanced activity as a solid line.
5.8 STA_SE (Steady Expression, STA#002)
It is often said that Southern Taurids are active from September to December, but they are composites of ANT activities. We can recognize two distinct meteor showers: STA_SE and STA_SF. We use the code STA for this activity because of the IAU code, although STA_SE is located in Aries. This activity is the second in rank within the so-called STA-activities but the maximum is uncertain (λʘ = 203°) and the mean magnitude is the faintest one among the 14 meteor major showers (Figure 34).
STA_SE is so unique that its magnitude slope shows an ascending slope; this shower is richer in faint meteors than the sporadic activity (Figure 35). It should be stressed we have to distinguish two ‘STA’ components because of the magnitude distribution on top of the difference in the maximum date.
The beginning height of STA_SE is almost parallel to the sporadic one although higher and clearly different from STA_SF (Figure 36).
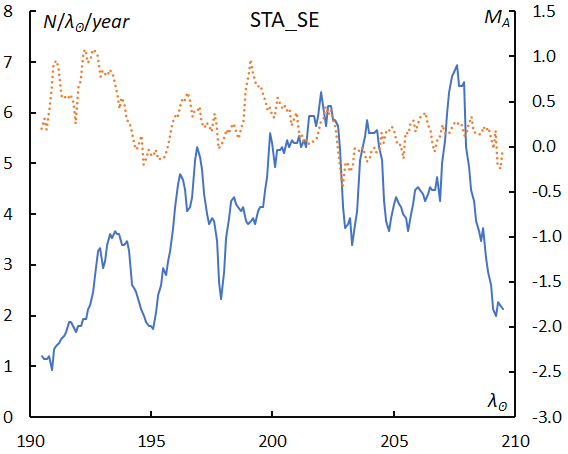
Figure 34 – The sliding mean of the number of Southern Taurids SE activity (solid line, blue) and of the absolute magnitude (dotted line, orange) using with 1 solar longitude bin; the number is divided by the number of years of the observations.
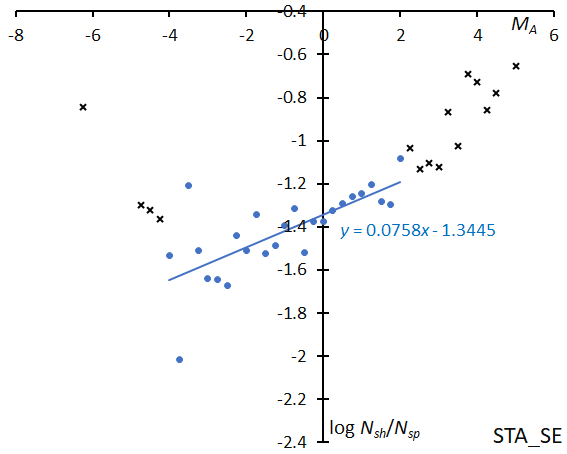
Figure 35 – The solid line indicates the result of the linear regression analysis for the Southern Taurids SE, between MA = –4~+2, crosses on both sides are excluded from the analysis because of the scarcity of the data.
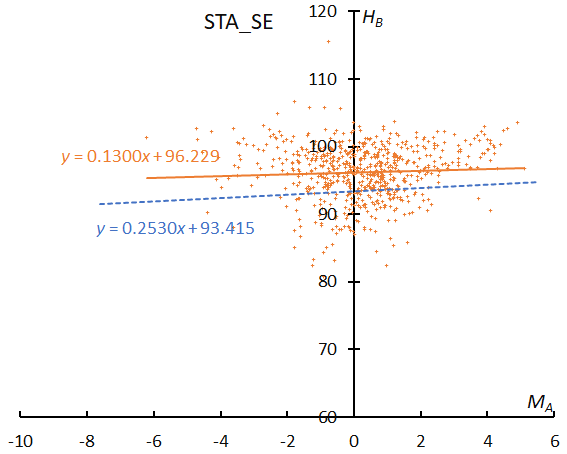
Figure 36 – The result of the linear regression for sporadic meteors is shown as a dashed line, that of the Southern Taurids SE as a solid line.
5.9 STA_SF (Sharply Fluctuating STA#002)
This activity fluctuates from year to year; the enhanced activities were observed in 2008, 2012, 2015, and 2022 although this search was done before the apparition in 2022. Although STA_SF is more active than STA_SE at the maximum (λʘ = 222°) even during regular years (Figure 37), the meteor rates exceed several times the regular activity level during these enhanced years and the mean magnitude becomes about 1 magnitude brighter (Figure 38).
The magnitude slope during the enhanced years is clearly different from the regular years; this shower produces many fireballs in its enhanced years similar to CAP, though meteors are fainter than NTA and inconspicuous in the regular years (Figure 39).
The beginning height of enhanced years (Figure 41) clearly shows a descending slope and suggests this activity might be of cometary origin and be near the core of emitted dust. Even the line of regular years (Figure 40) is not an ascending slope like STA_SE shows (Figure 36).
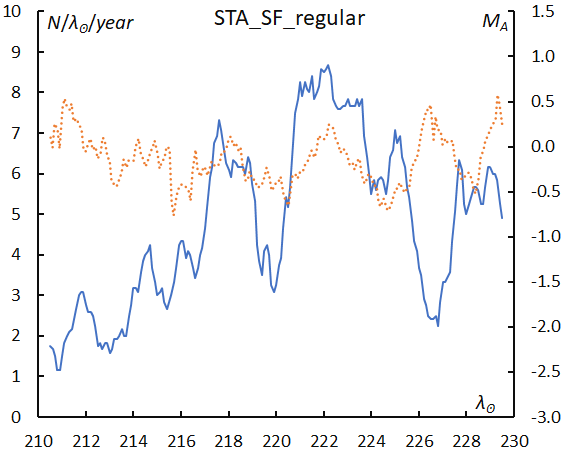
Figure 37 – The sliding mean of the number of Southern Taurids SF regular activity (solid line, blue) and of the absolute magnitude (dotted line, orange) using with 1 solar longitude bin; the number is divided by the number of years of the observations.
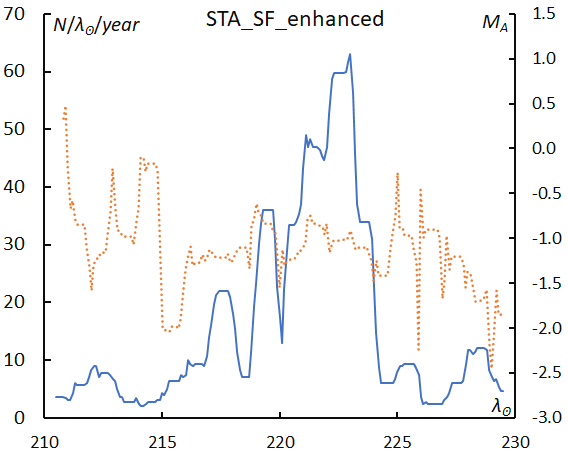
Figure 38 – The sliding mean of the number of Southern Taurids SF enhanced activity (solid line, blue) and of the absolute magnitude (dotted line, orange) using with 1 solar longitude bin; the number is divided by the number of years of the observations.
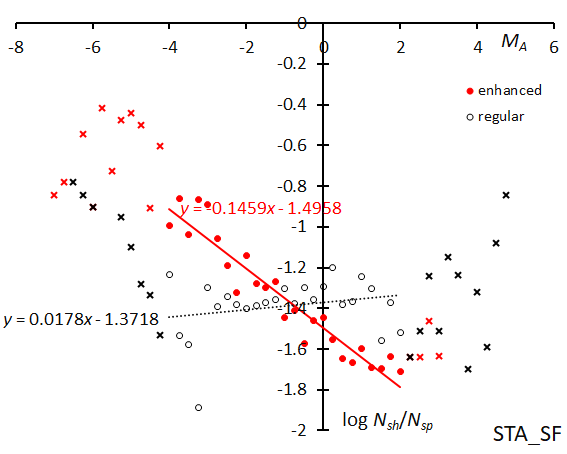
Figure 39 – The solid line indicates the result of the linear regression analysis for the Southern Taurids SF during enhanced activity, the dotted line for the regular activity, between MA = –4~+2, crosses on both sides are excluded from the analysis because of the scarcity of the data.
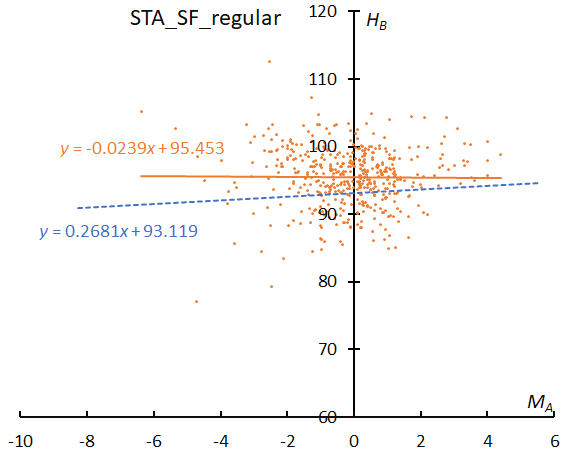
Figure 40 – The result of the linear regression for sporadic meteors is shown as a dashed line, that of the Southern Taurids SF during regular activity as a solid line.
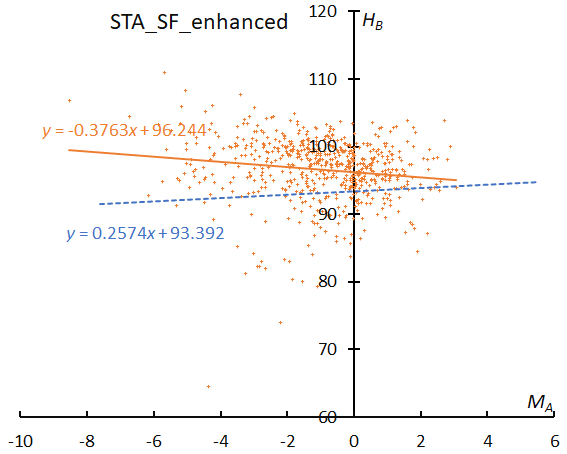
Figure 41 – The result of the linear regression for sporadic meteors is shown as a dashed line, that of the Southern Taurids SF during enhanced activity as a solid line.
5.10 Northern Taurids (NTA#017)
The activity of NTA continues over a month and shows an uncertain peak around λʘ = 230°, the activity fluctuates randomly from year to year (Figure 42). The mean magnitude seems brighter than the regular year activity of STA_SF.
Though the magnitude slope suggests that NTA belongs to the ecliptic meteor showers, NTA becomes a central activity of the three Taurids, or, STA_SE, STA_SF, and NTA itself, because NTA has a rather steeper slope (Figure 43).
Figure 44 of the NTA shows an intermediate property between the enhanced and the regular years of STA_SF.
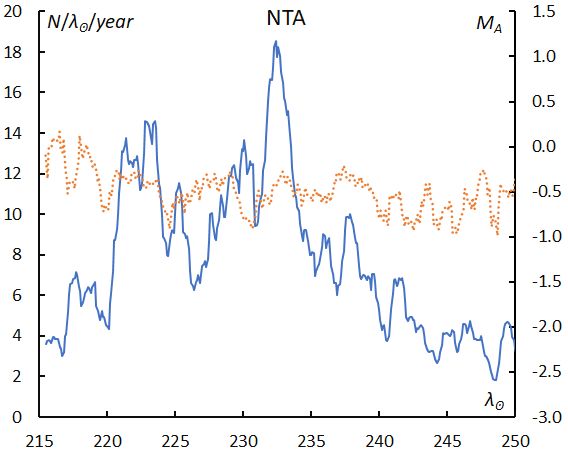
Figure 42 – The sliding mean of the number of Northern Taurids (solid line, blue) and of the absolute magnitude (dotted line, orange) using with 1 solar longitude bin; the number is divided by the number of years of the observations.
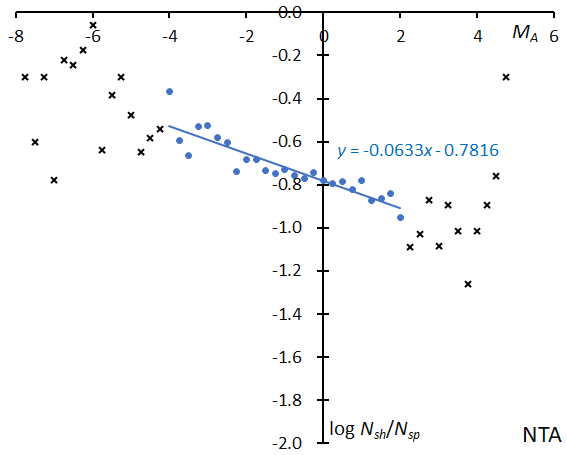
Figure 43 – The solid line indicates the result of the linear regression analysis for the Northern Taurids, between MA = –4~+2, crosses on both sides are excluded from the analysis because of the scarcity of the data.
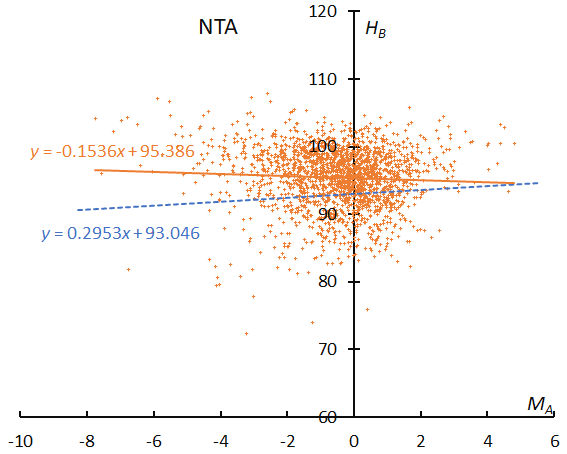
Figure 44 – The result of the linear regression for sporadic meteors is shown as a dashed line, that of the Northern Taurids as a solid line.
5.11 Leonids (LEO#013)
Leonids are now in a low activity period, but the mean magnitude shows this is the brightest meteor shower, moreover, the mean magnitude shows distinct brightening around the maximum (Figure 45).
Leonid activity is rather low, but the slope is the second steepest (Figure 46) after the Perseids. We can enjoy several Leonid fireballs during the maximum activity of this shower. The regression line of the Leonids (Figure 47) clearly indicates a cometary origin, although the shower is in a calm period of activity.
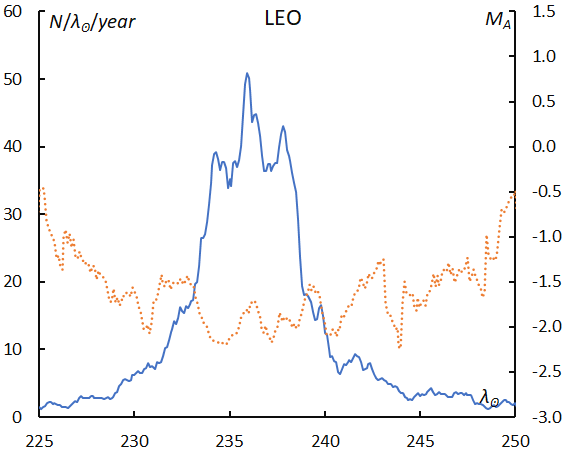
Figure 45 – The sliding mean of the number of Leonids (solid line, blue) and of the absolute magnitude (dotted line, orange) using with 1 solar longitude bin; the number is divided by the number of years of the observations.
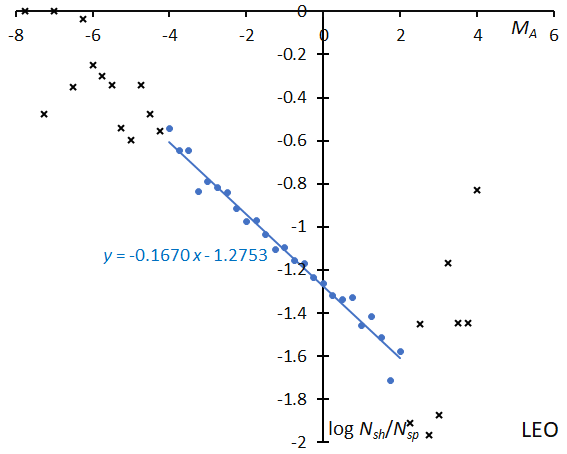
Figure 46 – The solid line indicates the result of the linear regression analysis for the Leonids, between MA = –4~+2, crosses on both sides are excluded from the analysis because of the scarcity of the data.
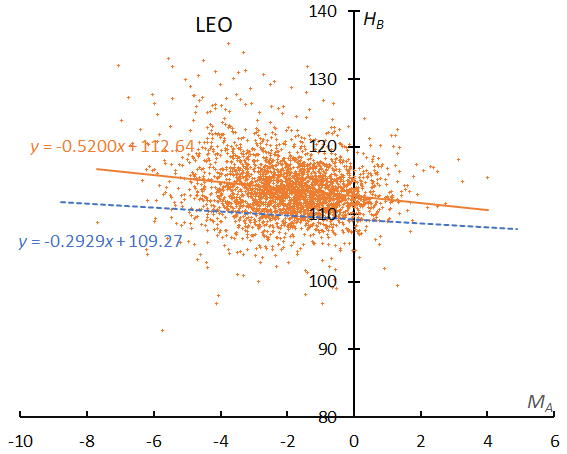
Figure 47 – The result of the linear regression for sporadic meteors is shown as a dashed line, that of Leonids as a solid line.
5.12 Sigma Hydrids (HYD#016)
The activity covers nearly a month. Meteor rates peak around λʘ = 255° but the mean magnitude does not show significant changes (Figure 48). The σ-Hydrids seem richer in bright meteors than GEM. The slope is more gentle than in the cases of GEM and COM, although HYD has a Halley-type orbit (Figure 49). The beginning height is slightly above the sporadic ones (Figure 50). The perihelion distance is closer to the Sun than for STA and NTA, and meteoroids of HYD might have lost their fragility.
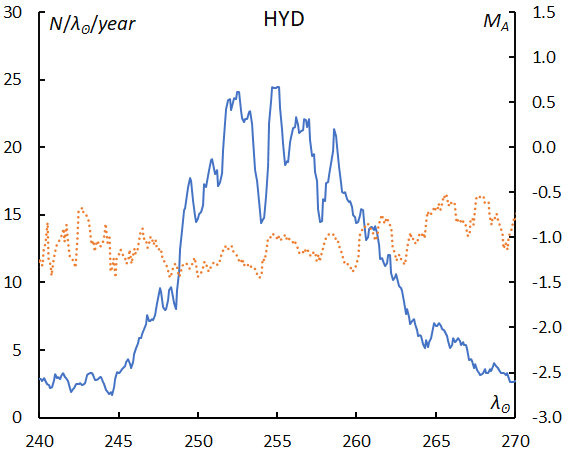
Figure 48 – The sliding mean of the number of sigma Hydrids (solid line, blue) and of the absolute magnitude (dotted line, orange) using with 1 solar longitude bin; the number is divided by the number of years of the observations.
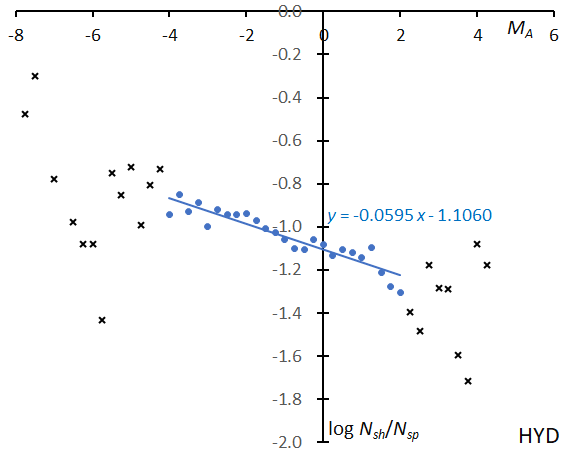
Figure 49 – The solid line indicates the result of the linear regression analysis for the sigma Hydrids, between MA = –4~+2, crosses on both sides are excluded from the analysis because of the scarcity of the data.
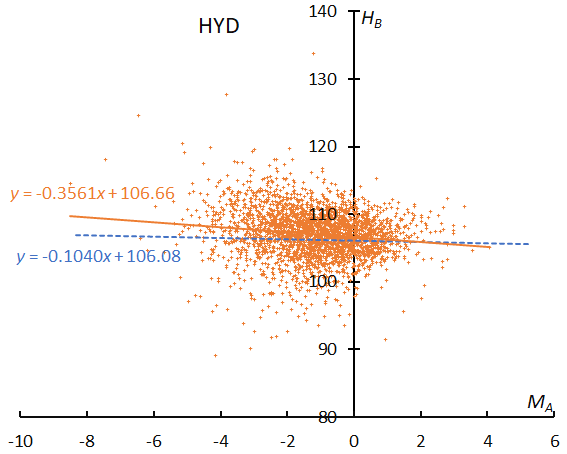
Figure 50 – The result of the linear regression for sporadic meteors is shown as a dashed line, that of the sigma Hydrids as a solid line.
5.13 Geminids (GEM#004)
It is well known that the peak of brighter Geminids appears later than that of fainter ones. The mean magnitude reaches the minimum after the maximum of the meteor rates (Figure 51). Geminids have other interesting properties, and we study them in Section 6. The magnitude distribution of GEM is unique and suggests that the number of meteors brighter than MA < –2 sharply drops (Figure 52). We will study this in detail in the next section comparing with the Perseids. The regression line of GEM is almost the same as the sporadic one (Figure 53); meteoroids of GEM are not porous like those of cometary origin. The perihelion distance of GEM is the second smallest of the 14 major showers and makes GEM similar in appearance to SDA.
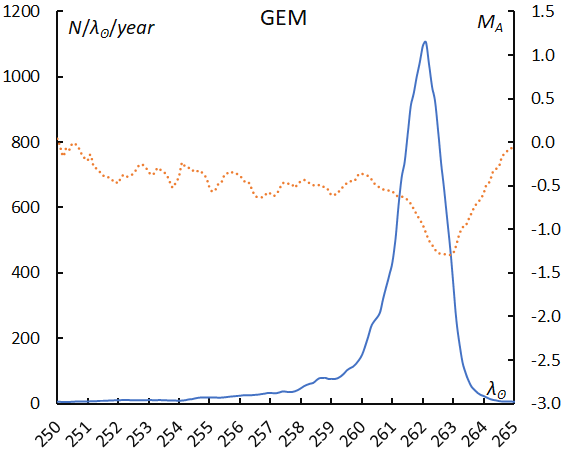
Figure 51 – The sliding mean of the number of Geminids (solid line, blue) and of the absolute magnitude (dotted line, orange) using with 1 solar longitude bin; the number is divided by the number of years of the observations.
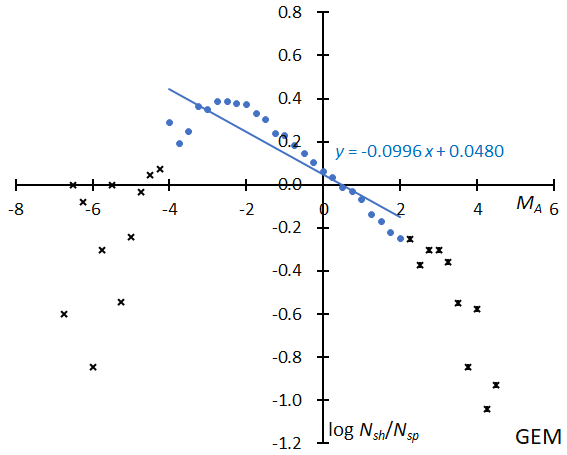
Figure 52 – The solid line indicates the result of the linear regression analysis for the Geminids, between MA = –4~+2, crosses on both sides are excluded from the analysis because of the scarcity of the data.
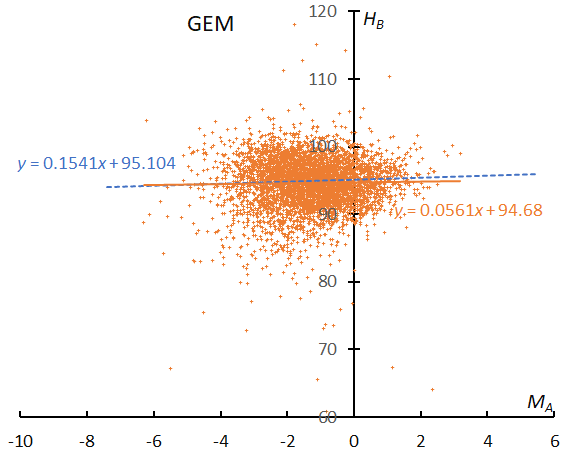
Figure 53 – The result of the linear regression for sporadic meteors is shown as a dashed line, that of the Geminids as a solid line.
5.14 Comae Berenicids (COM#020)
Meteor rates reach their maximum around λʘ = 268° and the radiant locates in Leo Minor then. The mean magnitude reaches its brightest level at the peak of the activity (Figure 54). COM produces bright meteors like the Perseids do when meteor rates are high, but COM is not so familiar to visual observers because the meteor rates of COM are much lower than for the Perseids.
COM was detected by photographic observations and is one of the major targets in video observations. Comae Berenicids are richer in bright meteors than sigma Hydrids because the slope is steeper than in the case of sigma Hydrids (Figure 55). COM seems to be a more difficult target for visual observers than HYD.
The regression line for COM is not so high and steeper than the sporadic one, compared to the Perseids and the Leonids (Figure 56). These meteoroids may have lost their fragility because of an old age.
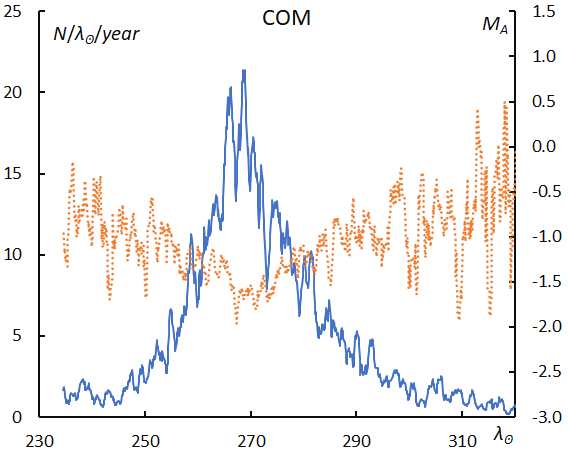
Figure 54 – The sliding mean of the number of Comae Berenicids (solid line, blue) and of the absolute magnitude (dotted line, orange) using with 1 solar longitude bin; the number is divided by the number of years of the observations.
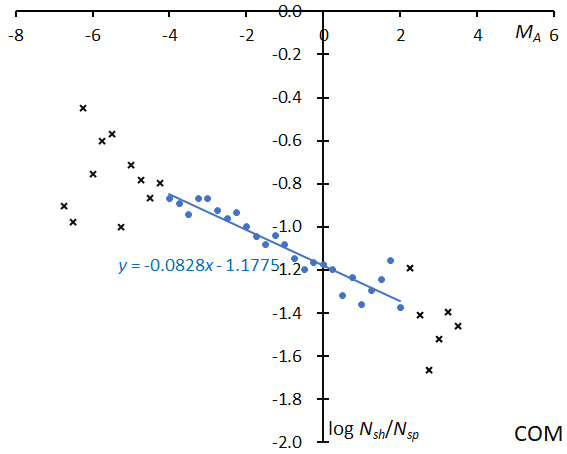
Figure 55 – The solid line indicates the result of the linear regression analysis for the Comae Berenicids, between MA = –4~+2, crosses on both sides are excluded from the analysis because of the scarcity of the data.
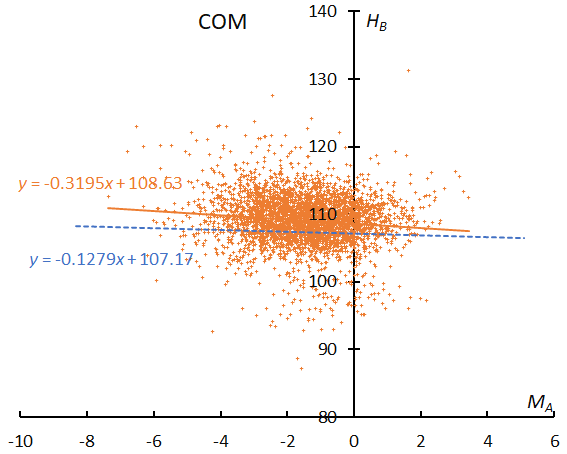
Figure 56 – The result of the linear regression for sporadic meteors is shown as a dashed line, that of the Comae Berenicids as a solid line.
6 The peculiarity of Geminids: comparison with Perseids
The magnitude distribution of the Geminids is unique as pointed out above (see Figure 51). It is not represented as a line but as a smooth curve even if we use the ratio between shower meteors and sporadic meteors (see Figure 52). We study the magnitude distribution of the Geminids in detail in function of the solar longitude compared to the Perseids.
6.1. Magnitude distribution of the Perseids in function of solar longitude
We divide the data into 24 groups with 1000 meteors each in function of the solar longitude and show the magnitude distributions of 24 groups in Figures 58–63. The first graph represents the first four groups: λʘ = 124.51°, λʘ = 129.59°, λʘ = 131.49°, and λʘ = 132.59°, each given as the mean solar longitude of the meteors within the interval with 1000 meteors (Figure 58). These four plots are in good agreement with each other. The following five graphs are similar. We calculate the slopes of the range between MA = –4~+2 to study the change of the slopes in function of the solar longitude; the range could be extended to a brighter magnitude of MA < –4, however the numbers of meteors are small. It is unclear why these lines seem to bend and increase after MA > +2, the trains left by Perseid meteors may make them easier to record than sporadic meteors, anyway the number of meteors is rather low.
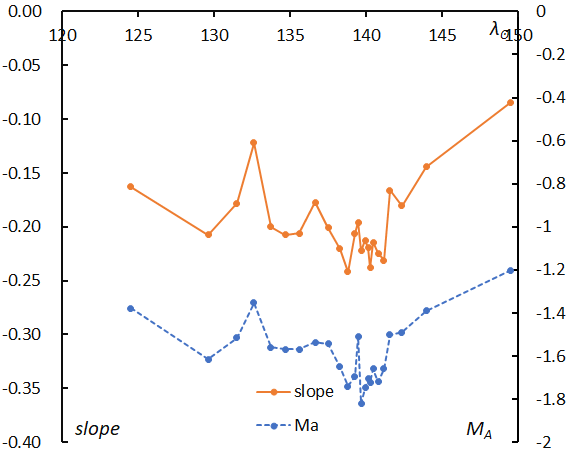
Figure 57 – The change of the magnitude distribution slopes of the Perseids in function of solar longitude compared with the mean magnitude shift. The slope (solid line) changes synchronously with the mean magnitude (dashed line).
The slopes change with time and reach the deepest point during the maximum (Figure 57); we can calculate the magnitude ratio easily as mentioned above and the summary results are given in Table 5. We also realize that this change coincides with the shift of the mean absolute magnitude calculated for the same solar longitude period using the slope. This is the explanation for the bulging seen with the Perseids in Figure 27. Almost all meteor showers show the smallest mean absolute magnitude at their maximum activity (see Figures 11, 14, 17, 20, 23, 26, 29, 30, 34, 37, 38, 42, 45, 48, 51 and 54). It is difficult to confirm the universal correlation of the mean absolute magnitude with the slope of the logarithm distribution of the ratio of shower meteors to the sporadic ones because dividing the data into enough sizes to analyze the change of the slopes is difficult for other meteor showers, except for Geminids and Perseids. We may assume that the change of the slope with time as seen in the Perseids is similar for other showers.
5.2. Magnitude distribution of the Geminids in function of solar longitude
We divide the data into 35 groups with 1000 meteors each in function of the solar longitude and show the magnitude distribution in Figures 64–72. The first graph represents the first four groups: λʘ = 249.71, λʘ =256.35, λʘ =258.28, and λʘ =259.20 given as the mean solar longitude for each time bin with 1000 meteors (Figure 64). We calculate the slopes of the range between MA = –2~+2 to study the change of the slope in function of the solar longitude; the lines clearly change with time and the curved profiles do not permit us to use a wider magnitude range like we did for the Perseids. The summary results for the Geminids are given in Table 6. We focus on the two differences between Perseids and Geminids: the large fluctuation range of the slopes and the mean magnitude, and the curved profiles brighter than MA < –2.
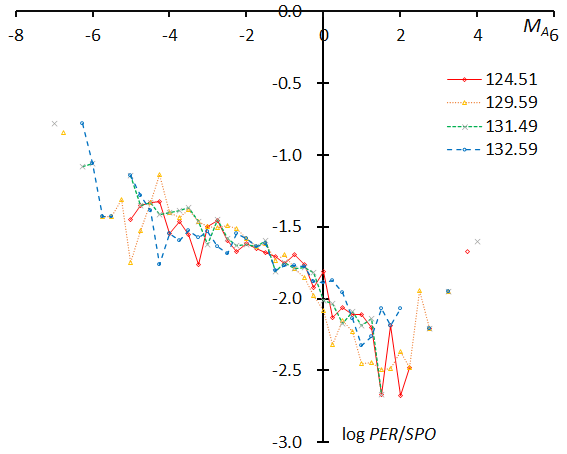
Figure 58 – The magnitude distributions of the Perseids for the time bins with 1000 meteors at λʘ = 124.51°, λʘ = 129.59°, λʘ = 131.49°, and λʘ = 132.59°.
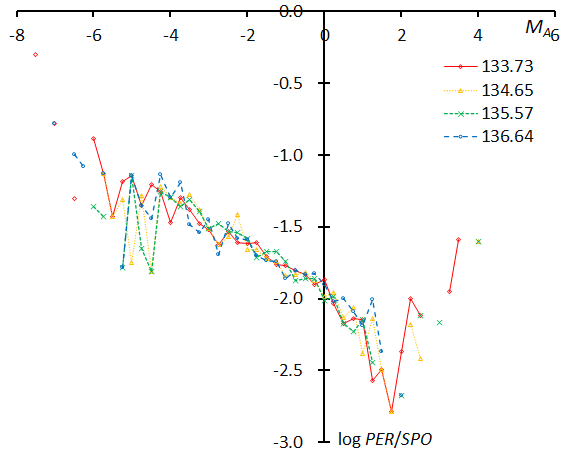
Figure 59 – The magnitude distributions of the Perseids for the time bins with 1000 meteors at λʘ = 133.73°, λʘ = 134.65°, λʘ = 135.57°, and λʘ = 136.64°.
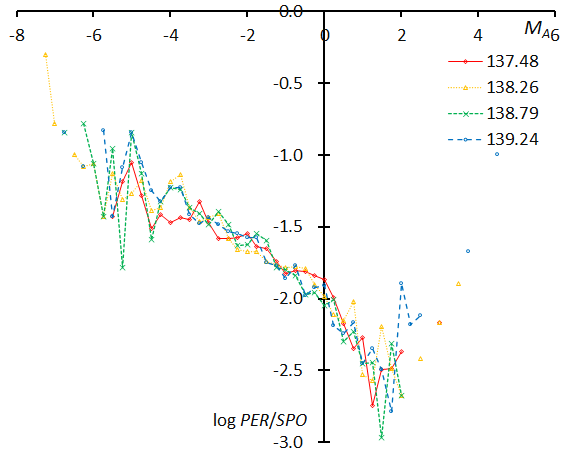
Figure 60 – The magnitude distributions of the Perseids for the time bins with 1000 meteors at λʘ = 137.48°, λʘ = 138.26°, λʘ = 138.79°, and λʘ = 139.24°.
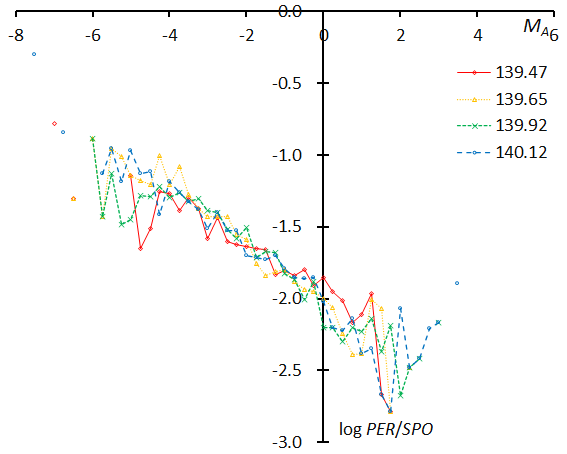
Figure 61 – The magnitude distributions of the Perseids for the time bins with 1000 meteors at λʘ = 139.47°, λʘ = 139.65°, λʘ = 139.92°, and λʘ = 140.12°.
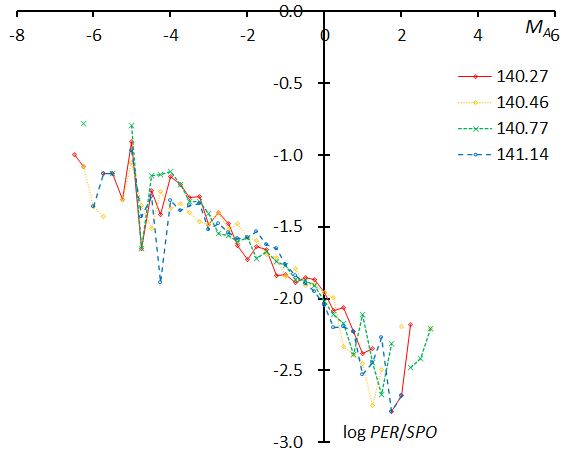
Figure 62 – The magnitude distributions of the Perseids for the time bins with 1000 meteors at λʘ = 140.27°, λʘ = 140.46°, λʘ = 140.77°, and λʘ = 141.14°.
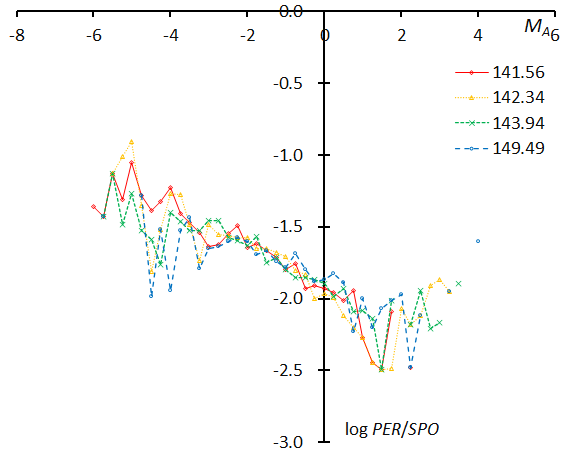
Figure 63 – The magnitude distributions of the Perseids for the time bins with 1000 meteors at λʘ = 141.56°, λʘ = 142.34°, λʘ = 143.94°, and λʘ = 149.49°.
Table 5 – The changes for the Perseids in the slope, the magnitude ratio (r), and the mean absolute magnitude (MA) along with solar longitude (λʘ).
| λʘ (°) | 124.51 | 129.59 | 131.49 | 132.59 | 133.73 | 134.65 | 135.57 | 136.64 | 137.48 | 138.26 | 138.79 | 139.24 |
| slope | –0.163 | –0.208 | –0.178 | –0.122 | –0.2 | –0.207 | –0.206 | –0.177 | –0.201 | –0.22 | –0.242 | –0.206 |
| r | 2.68 | 2.42 | 2.59 | 2.95 | 2.46 | 2.42 | 2.43 | 2.6 | 2.46 | 2.35 | 2.24 | 2.43 |
| MA | –1.38 | –1.62 | –1.51 | –1.35 | –1.56 | –1.57 | –1.57 | –1.54 | –1.54 | –1.65 | –1.74 | –1.69 |
| λʘ (°) | 139.47 | 139.65 | 139.92 | 140.12 | 140.27 | 140.46 | 140.77 | 141.14 | 141.56 | 142.34 | 143.94 | 149.49 |
| slope | –0.196 | –0.222 | –0.212 | –0.22 | –0.238 | –0.214 | –0.225 | –0.231 | –0.166 | –0.18 | –0.144 | –0.084 |
| r | 2.49 | 2.34 | 2.39 | 2.35 | 2.26 | 2.38 | 2.33 | 2.29 | 2.66 | 2.58 | 2.8 | 3.22 |
| MA | –1.51 | –1.82 | –1.75 | –1.7 | –1.72 | –1.66 | –1.72 | –1.66 | –1.5 | –1.49 | –1.39 | –1.2 |
Table 6 – The changes for the Geminids in the slope, the magnitude ratio (r), and the mean absolute magnitude (MA) along with solar longitude (λʘ).
| λʘ (°) | 249.71 | 256.35 | 258.28 | 259.2 | 259.89 | 260.32 | 260.6 | 260.76 | 260.95 | 261.13 | 261.26 | 261.39 |
| slope | –0.008 | –0.092 | –0.09 | –0.122 | –0.04 | –0.003 | –0.047 | –0.06 | –0.142 | –0.137 | –0.089 | –0.102 |
| r | 3.31 | 2.73 | 2.74 | 2.54 | 3.08 | 3.35 | 3.02 | 2.94 | 2.43 | 2.46 | 2.74 | 2.67 |
| MA | –0.23 | –0.52 | –0.44 | –0.6 | –0.37 | –0.34 | –0.44 | –0.53 | –0.72 | –0.63 | –0.46 | –0.55 |
| λʘ (°) | 261.5 | 261.57 | 261.62 | 261.67 | 261.71 | 261.76 | 261.83 | 261.91 | 261.97 | 262.02 | 262.08 | 262.14 |
| slope | –0.142 | –0.181 | –0.171 | –0.079 | –0.119 | –0.133 | –0.232 | –0.194 | –0.173 | –0.203 | –0.244 | –0.326 |
| r | 2.43 | 2.22 | 2.28 | 2.81 | 2.57 | 2.48 | 1.97 | 2.16 | 2.26 | 2.11 | 1.92 | 1.59 |
| MA | –0.57 | –0.73 | –0.7 | –0.58 | –0.65 | –0.67 | –0.82 | –0.74 | –0.81 | –0.91 | –0.93 | –1.12 |
| λʘ (°) | 262.21 | 262.28 | 262.35 | 262.41 | 262.47 | 262.53 | 262.59 | 262.67 | 262.78 | 262.97 | 264.77 | |
| slope | –0.367 | –0.298 | –0.273 | –0.295 | –0.237 | –0.294 | –0.361 | –0.348 | –0.267 | –0.253 | –0.129 | |
| r | 1.45 | 1.7 | 1.8 | 1.71 | 1.95 | 1.71 | 1.47 | 1.51 | 1.82 | 1.88 | 2.51 | |
| MA | –1.27 | –1.24 | –1.23 | –1.2 | –1.3 | –1.25 | –1.44 | –1.47 | –1.34 | –1.3 | –0.75 |
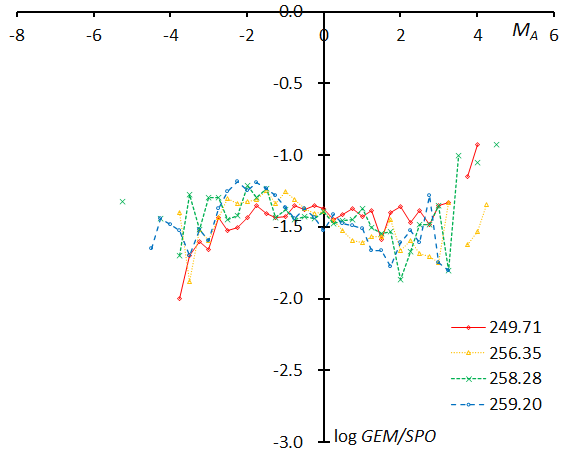
Figure 64 – The magnitude distributions of the Geminids for the time bins with 1000 meteors at λʘ = 249.71°, λʘ = 256.35°, λʘ = 258.28°, and λʘ = 259.20°.
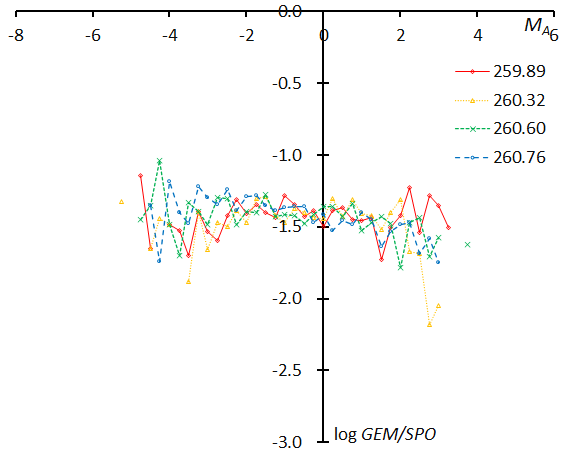
Figure 65 – The magnitude distributions of the Geminids for the time bins with 1000 meteors at λʘ = 259.89°, λʘ = 260.32°, λʘ = 260.60°, and λʘ = 260.76°.
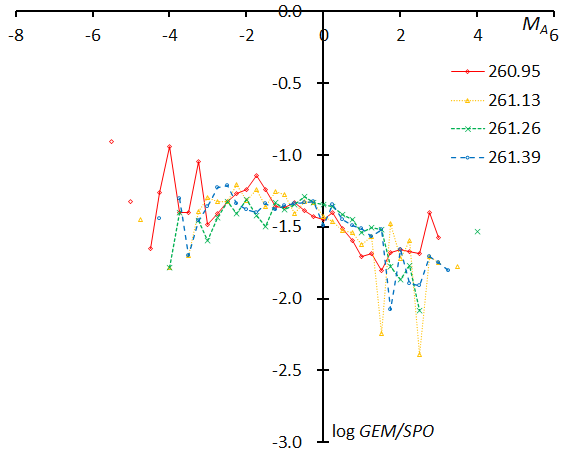
Figure 66 – The magnitude distributions of the Geminids for the time bins with 1000 meteors at λʘ = 260.95°, λʘ = 261.13°, λʘ = 261.26°, and λʘ = 261.39°.
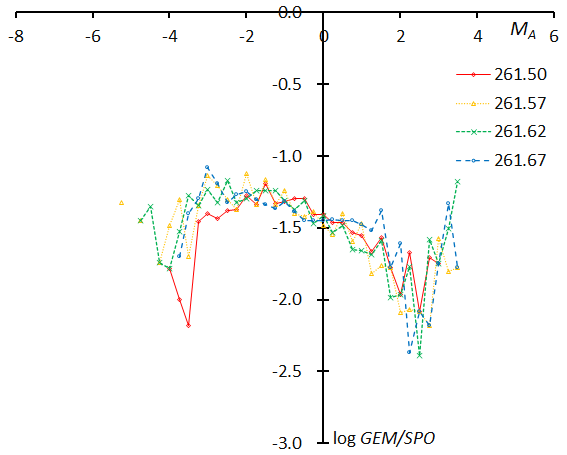
Figure 67 – The magnitude distributions of the Geminids for the time bins with 1000 meteors at λʘ = 261.50°, λʘ = 261.57°, λʘ = 261.62°, and λʘ = 261.67°.
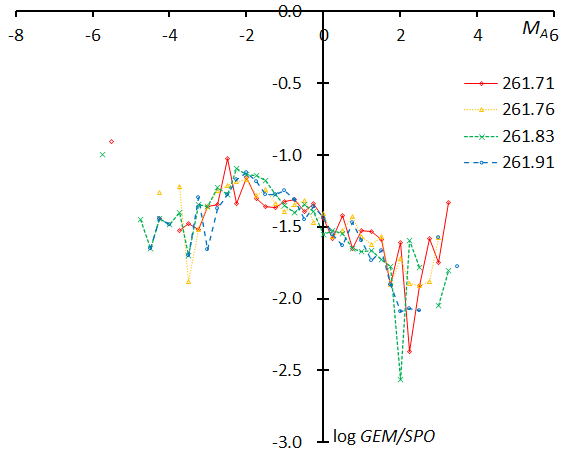
Figure 68 – The magnitude distributions of the Geminids for the time bins with 1000 meteors at λʘ = 261.71°, λʘ = 261.76°, λʘ = 261.83°, and λʘ = 261.91°.
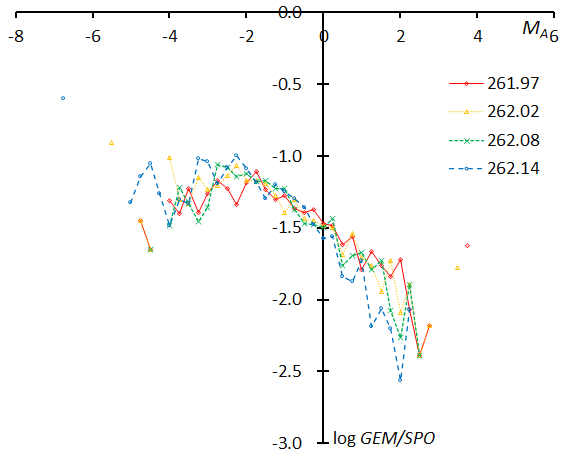
Figure 69 – The magnitude distributions of the Geminids for the time bins with 1000 meteors at λʘ = 261.97°, λʘ = 262.02°, λʘ = 262.08°, and λʘ = 262.14°.
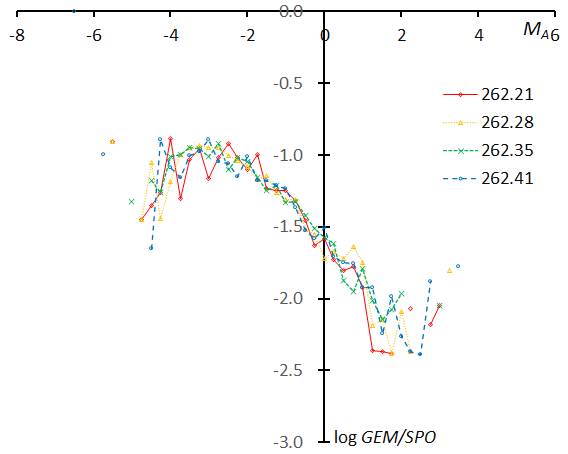
Figure 70 – The magnitude distributions of the Geminids for the time bins with 1000 meteors at λʘ = 262.21°, λʘ = 262.28°, λʘ = 262.35°, and λʘ = 262.41°.
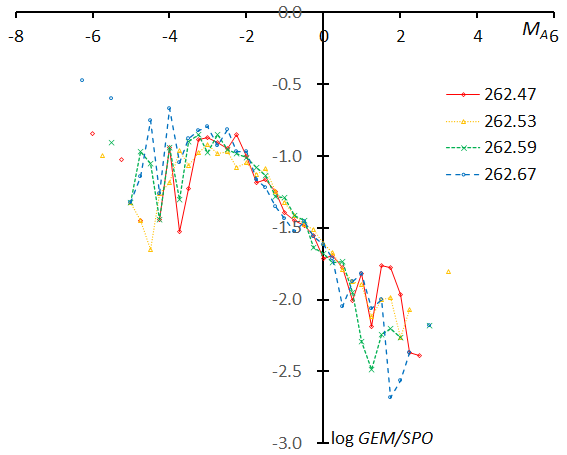
Figure 71 – The magnitude distributions of the Geminids for the time bins with 1000 meteors at λʘ = 262.47°, λʘ = 262.53°, λʘ = 262.59°, and λʘ = 262.67°.
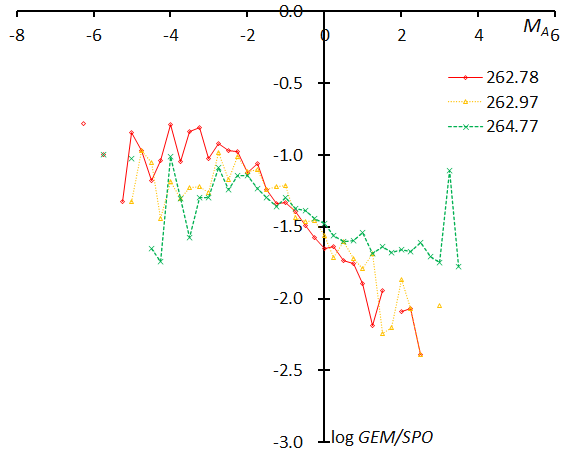
Figure 72 – The magnitude distributions of the Geminids for the time bins with 1000 meteors at λʘ = 262.78°, λʘ = 262.97°, and λʘ = 264.77°.
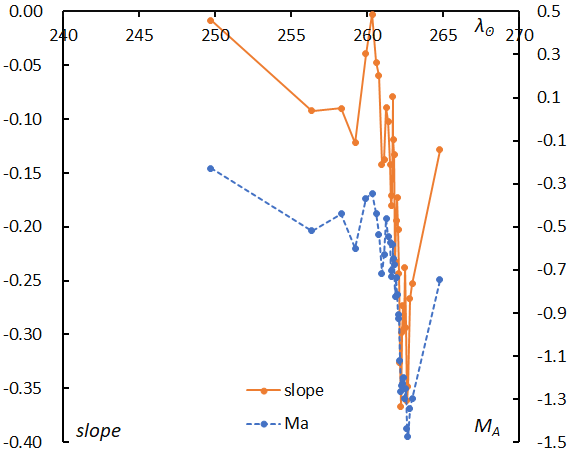
Figure 73 – The change of the magnitude distribution slopes of the Geminids in function of solar longitude compared with the mean magnitude shift. The slope (solid line) changes synchronous with the mean magnitude (dashed line).
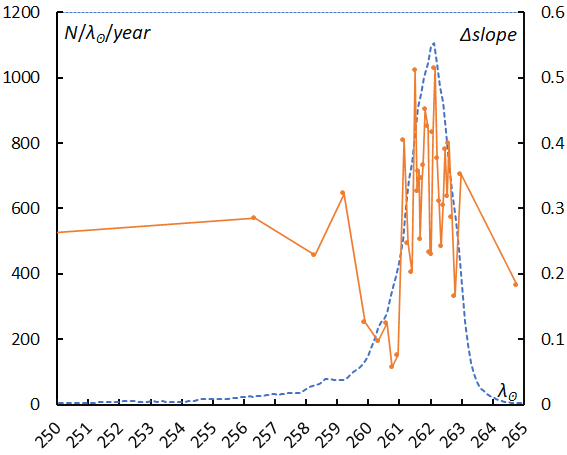
Figure 74 – The change of the difference in the slopes
(MA = –2~+2 and MA = –4~–2) along with solar longitude compared with the activity profile of Geminids.
The changes in the slopes of the magnitude distribution are related to the change in the mean absolute magnitude, and the slope reaches the lowest value a little while after the activity maximum the same way the mean absolute magnitude does (Figure 73). Both curves show a larger and more drastically fluctuation than in the case of the Perseids. We can compare Figure 73 with Figure 57 visually as both are drawn on the same scale. This is the first point; the plot appears narrow and steep.
The second point is the inflection of the graph around MA = –2 (see Figures 64–72). Though we can recognize this in figures, the changes in the slope between MA = –4~–2 represent the peculiarity of Geminids more clearly. We calculate the difference between the two slopes, the reference slope for the Geminids (MA = –2~+2) and the targeted slope (MA = –4~–2). Both are positive over the entire period, that is, the graph is always convex. Figure 74 compares this difference in the slope with the activity profile. The fluctuations occur around the activity maximum, the difference of over 0.4 means that the bending angle is about 20 degrees. It is noteworthy to point out that brighter meteors MA < –2 in the Geminids decrease in number instead of increasing and, moreover, this tendency is remarkable at the activity maximum.
7 Discussions
Video observations have problems not only with their photometric techniques but also with the perception depending on the magnitude and the geocentric velocity of meteors. It should be stressed that this research is based on SonotaCo net data and that the magnitude distributions of sporadic meteors differ depending on observational techniques (Koseki, 2015). Therefore, the slopes shown in Table 2 and the relation drawn in Figure 8 should not be applied to other video observation data.
However, we confirm that we can assume that the perception coefficients for shower meteors are equal to the sporadic ones if we choose the same magnitude range and the same velocity range. We can show that the magnitude distribution compensated by the sporadic ones works well for determining the magnitude ratio of shower meteors. The beginning height of meteors also offers clues to get information about the property of the meteoroids by comparing them with sporadic ones. It is suggested that we can get useful information in this way from any video observation groups.
We established interesting information about 14 major meteor showers, especially for the Perseids and the Geminids.
The magnitude ratio represents the mass distribution in the meteoroid streams, and we can obtain it by video data to compare 14 major showers with each other. We can establish the difference between Perseids and Geminids in the magnitude ratio of the meteoroids, and the changes in the magnitude ratio in function of the solar longitude in the case of the Perseids and the Geminids.
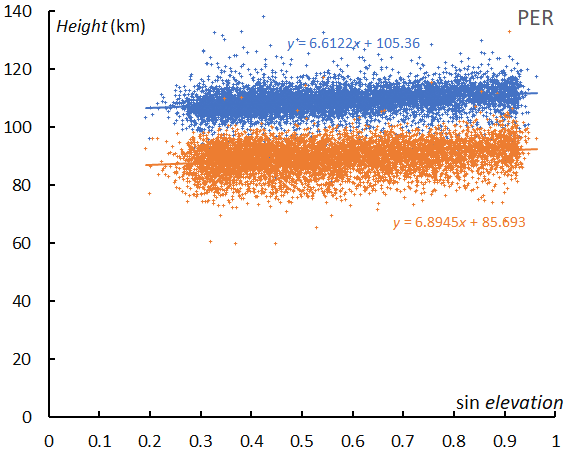
Figure 75 – The beginning height (blue) and ending (orange) of the Perseids in function of the radiant elevation.
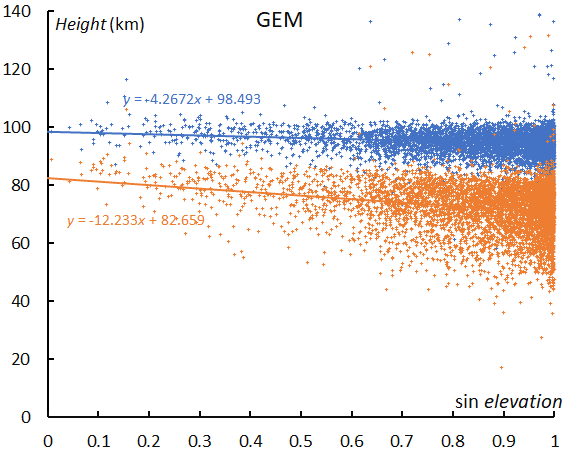
Figure 76 – The beginning height (blue) and ending (orange) of the Geminids in function of the radiant elevation.
The beginning height of meteors is an indicator for the meteoroid’s property; a porous meteoroid emits light at a higher altitude than a sporadic one. We can add one more example; the beginning height and the ending height show the singularity of Geminids. Perseid meteors ablate at lower altitudes with a lower radiant elevation angle, but Geminids display an opposite situation (Figures 75 and 76).
The magnitude and the beginning height data obtained from video observations offer very useful clues to investigate the structure of meteoroid streams.
Acknowledgments
We use all published video data by SonotaCo net from 2007 to 2021. The completion of this research owes very much to all the observers who participated in the SonotaCo network.
References
Ceplecha Z. (1968). “Discrete Levels of Meteor Beginning Height”. Smithsonian Astrophysical Observatory Special Reports, No. 279, 54 pages.
Cook A. F. (1973). “Discrete Levels of Beginning Height of Meteors in Streams”. Smithsonian Contributions to Astrophysics, 14, 1–10.
Koseki M. (2015). “What do we see as ANT, Apex and Toroidal sources? — What meteors are, where meteors came from, where meteoroids are going.”. WGN, Journal of the IMO, 43, 127–146.
Koseki M. (2019). “Profiles of meteor shower activities inferred from the radiant Density Ratios (DR)”. WGN, Journal of the IMO, 47, 168–179.
Koseki M. (2020). “Three components of ‘Taurids’ II”. WGN, Journal of the IMO, 48, 36–46.
Koseki M. (2022). “Global Meteor Network: Outburst produced by dust from 73P/Schwassmann-Wachmann3”. eMetN, 7, 369–378.
Koseki M. (2023). “An Attempt to estimate magnitude ratio using video observations: In the case of eight minor showers listed in 2023 Meteor Shower Calendar of IMO”. submitted to WGN.
SonotaCo (2009). “A meteor shower catalog based on video observations in 2007–2008”. WGN, Journal of the IMO, 37, 55–62.
SonotaCo, Uehara S., Sekiguchi T., Fujiwara Y., Maeda K., and Ueda M. (2021). “J14: A Meteor Shower and Cluster Catalog”. WGN, Journal of the IMO, 49, 76–97.


