As seen from the Northern Hemisphere, March is the slowest month of the year for meteor activity. No major annual showers are active and only a few very weak minor showers produce activity this month. The sporadic rates are also near their annual minimum so there is not much to look forward to this month except for the evening fireballs that seem to peak this time of year. This could be due to the fact the Antapex radiant lies highest above the horizon this time of year during the evening hours as seen from the Northern Hemisphere. From the Southern Hemisphere, activity from the Centaurid complex begins to wane with only the weak activity visible from Norma and perhaps others nearby areas. At least southern sporadic rates are still strong to make the late summer viewing a bit more pleasurable.
During this period, the moon reaches its first quarter phase on Monday February 27th. At that time the moon will lie 90 degrees east of the sun and will set near 0200 local standard time (LST). As the week progresses the moon will encroach upon the morning sky limiting the window of dark sky to a few hours prior to dawn. The estimated total hourly rates for evening observers this week should be near 2 as seen from mid-northern latitudes (45N) and 3 as seen from tropical southern locations (25S) For morning observers, the estimated total hourly rates should be near 6 as seen from mid-northern latitudes (45N) and 12 as seen from tropical southern locations (25S). The actual rates seen will also depend on factors such as personal light and motion perception, local weather conditions, alertness, and experience in watching meteor activity. Evening rates are reduced during this period due to moonlight. Note that the hourly rates listed below are estimates as viewed from dark sky sites away from urban light sources. Observers viewing from urban areas will see less activity as only the brighter meteors will be visible from such locations.
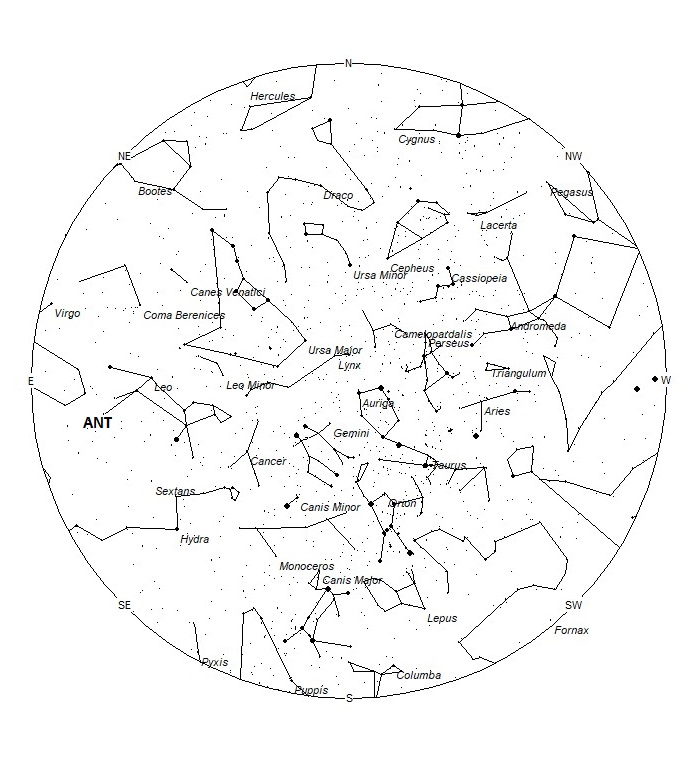
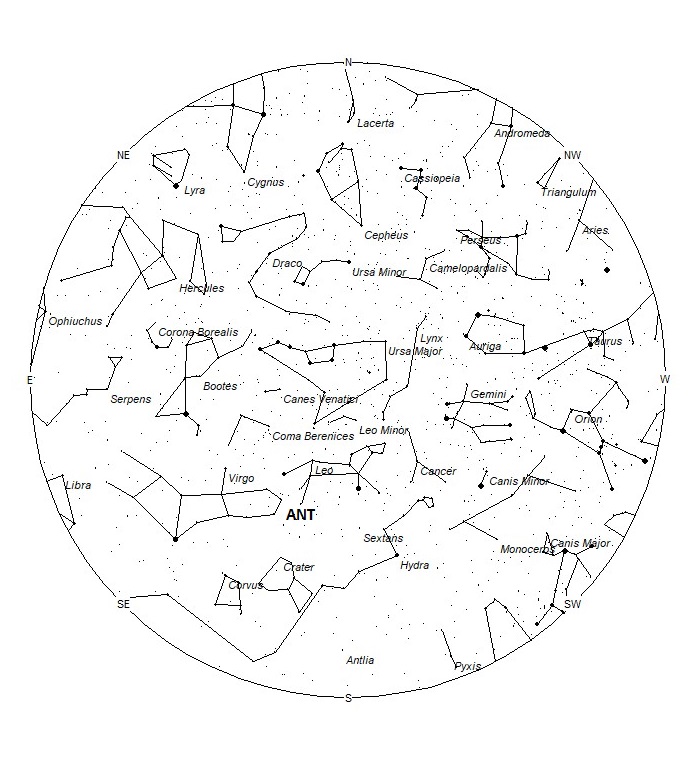
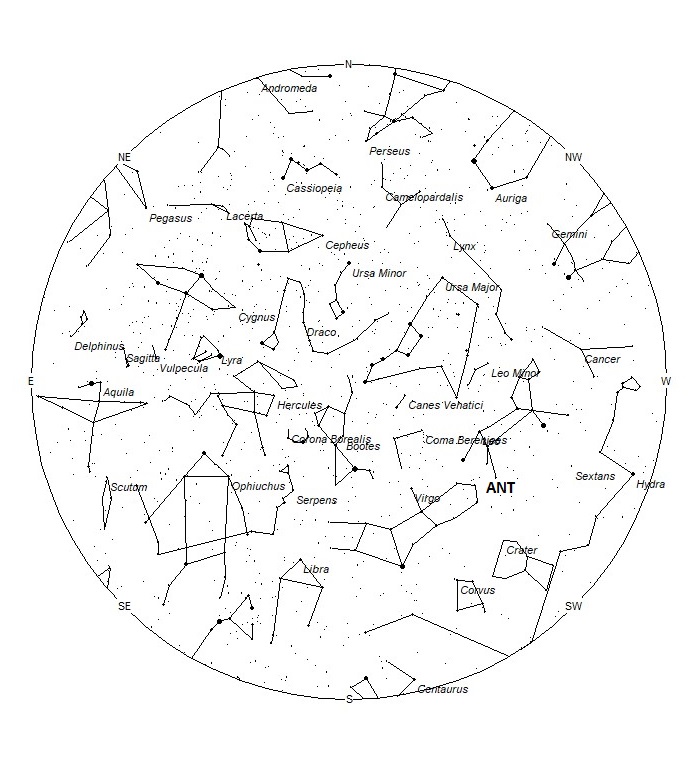
The radiant (the area of the sky where meteors appear to shoot from) positions and rates listed below are exact for Saturday night/Sunday morning February 25/26. These positions do not change greatly day to day so the listed coordinates may be used during this entire period. Most star atlases (available at science stores and planetariums) will provide maps with grid lines of the celestial coordinates so that you may find out exactly where these positions are located in the sky. I have also included charts of the sky that display the radiant positions for evening, midnight, and morning. The center of each chart is the sky directly overhead at the appropriate hour. These charts are oriented for facing south but can be used for any direction by rotating the charts to the desired direction. A planisphere or computer planetarium program is also useful in showing the sky at any time of night on any date of the year. Activity from each radiant is best seen when it is positioned highest in the sky, either due north or south along the meridian, depending on your latitude. It must be remembered that meteor activity is rarely seen at the radiant position. Rather they shoot outwards from the radiant, so it is best to center your field of view so that the radiant lies at the edge and not the center. Viewing there will allow you to easily trace the path of each meteor back to the radiant (if it is a shower member) or in another direction if it is sporadic. Meteor activity is not seen from radiants that are located far below the horizon. The positions below are listed in a west to east manner in order of right ascension (celestial longitude). The positions listed first are located further west therefore are accessible earlier in the night while those listed further down the list rise later in the night.
These sources of meteoric activity are expected to be active this week.
The beta Tucanids (BTU) produced outbursts in 2020 and 2021. This was unexpected as activity of around one per night is more common for this display. If the outburst re-occurs again in 2023, it should occur on a 20-hour time frame centered on 12:00 Universal Time on March 13. Early members of this shower may appear as early as 2 March, but rates would be extremely low at that time. On the night of March 12/13, the radiant is located at 04:07 (062) -77. The current location should not be much different due to the high southern declination. This area of the sky is located in western Mensa, two degrees southeast of the 3rd magnitude star known as gamma Hydri. These meteors are best seen as soon as it becomes dark in the deep Southern Hemisphere. They are not visible from the Northern Hemisphere. With an entry velocity of 31 km/sec., these meteors would be of slow velocity. These meteors are synonymous with the delta Mensids.
The large Anthelion (ANT) radiant is currently centered at 11:20 (170) +04. This position lies in southeastern Leo, 2 degrees south of the 4th magnitude star known as sigma Leonis. Due to the large size of this radiant, these meteors may also be seen from eastern Sextans and western Virgo as well as Leo. This radiant is best placed near 01:00 local standard time (LST) when it lies on the meridian and is highest in the northern sky. Rates at this time should be near 2 per hour no matter your location. With an entry velocity of 30 km/sec., the average Anthelion meteor would be of slow velocity.
As seen from the mid-northern hemisphere (45N) one would expect to see approximately 5 sporadic meteors per hour during the last hour before dawn as seen from rural observing sites. Evening rates would be near 1 per hour. As seen from the tropical southern latitudes (25S), morning rates would be near 10 per hour as seen from rural observing sites and 2 per hour during the evening hours.
You can keep track of the activity of these meteor showers as well as those beyond the limits of visual observing by visiting the NASA Meteor Shower Portal. You can move the sky globe to see different areas of the sky. Colored dots indicate shower meteors while white dots indicate sporadic (random) activity. The large orange disk indicates the position of the sun so little activity will be seen in that area of the sky.
The list below offers the information in tabular form of the showers that I feel are within reach of the visual observer to discern. Hourly rates are often less than 1 but noting parameters such as the radiant distance and the elevation of each meteor, one can compute the probability of shower association. Most showers discovered by video means have rates less than 1 per night away from maximum, so the showers listed in these outlooks are not as weak as they seem. Rates and positions are exact for Saturday night/Sunday morning except where noted in the shower descriptions.
| SHOWER | DATE OF MAXIMUM ACTIVITY | CELESTIAL POSITION | ENTRY VELOCITY | CULMINATION | HOURLY RATE | CLASS |
| RA (RA in Deg.) DEC | Km/Sec | Local Standard Time | North-South | |||
| beta Tucanids (BTU) | Mar 13 | 04:07 (062) -77 | 31 | 18:00 | <1 – <1 | III |
| Anthelions (ANT) | – | 11:20 (170) +04 | 30 | 01:00 | 2 – 2 | II |
Class Explanation: A scale to group meteor showers by their intensity:
- Class I: the strongest annual showers with Zenith Hourly Rates normally ten or better.
- Class II: reliable minor showers with ZHR’s normally two to ten.
- Class III: showers that do not provide annual activity. These showers are rarely active yet have the potential to produce a major display on occasion.
- Class IV: weak minor showers with ZHR’s rarely exceeding two. The study of these showers is best left to experienced observers who use plotting and angular velocity estimates to determine shower association. These weak showers are also good targets for video and photographic work. Observers with less experience are urged to limit their shower associations to showers with a rating of I to III.



It seemed to be more active than usual this period as I just saw one here 2/28/23 8 pm in Columbus, Ohio and that caused me to look and find a few other reported sightings recently. It seems from looking on the internet that the past few weeks have been active?
Chuck and All,
What is more active are the evening fireballs that seem to peak this time of year. These get much more press compared to the weak showers currently active. What also attracted headlines was the fact that three meteorites were discovered on the ground from these fireballs during three consecutive days in February.