Abstract: We confirmed the 5-year periodicity of the χ-Cygnids (CCY#0757) and find an increasing trend in the activity; the next return might be expected in 2025. The chi Cygnid meteor shower displays activity mainly in the photographic range; very similar as in the case of the tau Herculids (TAH) and the outburst of meteors from 73P/Schwassmann-Wachmann3. The chi Cygnid activity in photographic meteors might be related to 2020RF as suggested by Jenniskens (2020).
We have four video meteor databases and compare them in this study of the chi Cygnids. Each dataset has its unique characteristics, and we use them carefully in accordance with their properties. The SonotaCo net database is the longest database in the time, and we can estimate the long-term changes in activities. CAMS and EDMOND stopped publishing their data after 2016, although that their data for each year became larger than that of SonotaCo net. GMN is developing and, therefore, it is necessary to compare the changes in meteor activity; we can get a most reliable activity profile of a meteor shower for a single year because the data is stable and abundant.
1 Introduction
The chi Cygnids (CCY#0757) were first observed unexpectedly (Jenniskens, 2015) but their periodicity was soon established from the former apparition (Shiba, 2015). Jenniskens used data from CAMS and Shiba from SonotaCo net. Adding to these two datasets, the detailed report from EDMOND confirmed its apparition in 2010 and its 5-year periodicity. Unfortunately, EDMOND ceased its observations after 2016 and also CAMS has not published new data after 2016. The expected return of the chi Cygnids was observed well by SonotaCo net, GMN, and CAMS, but raw data have been only published by SonotaCo net and GMN, but not by CAMS. Now, we have observational evidence for three returns of the chi Cygnids, in 2010, 2015, and 2020 from 4 different data sources. It seems a nice case to study the differences in the observational situations of the shower in these 4 datasets.
2 Data analysis
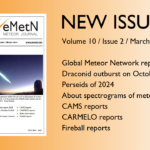
We analyze data using the same method given in our latest work (Koseki, 2022). For example, we present the raw data and the final results for the period of (161.33° < λʘ < 181.33°) in the case of SonotaCo net data (Figure 1). The chi Cygnids have a long elongated radiant distribution visible in raw data (Figure 1A), but they converge into a narrow radiant within only 3 degrees diameter after the regression analysis (Figure 1B). We analyzed the three other datasets and get similar results. We will compare the results in the next section.
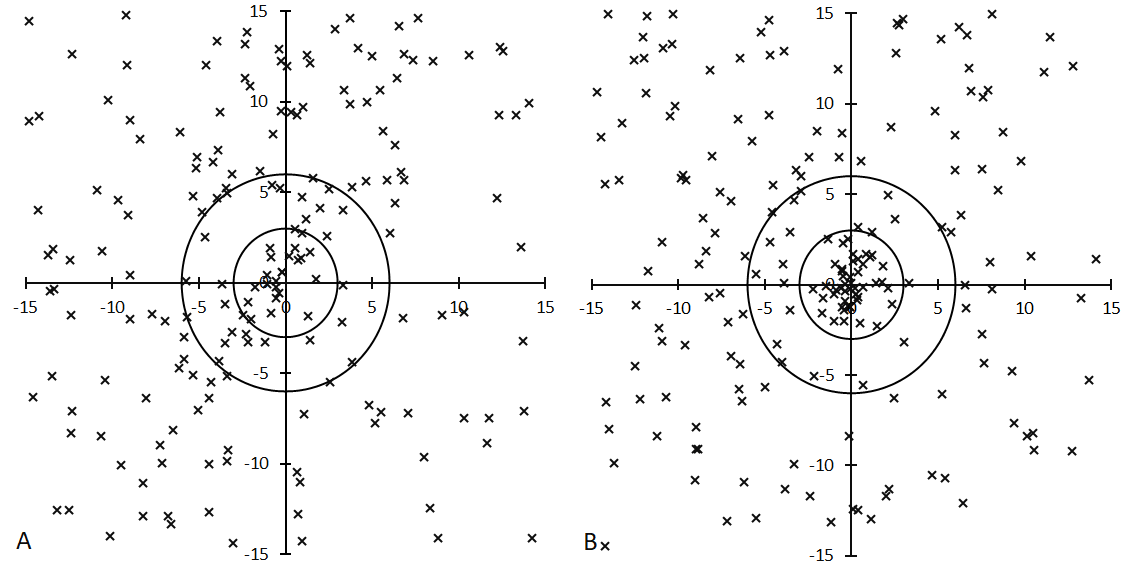
Figure 1 – Radiant distributions centered at CCY01 (λ – λʘ, β) = (141.3°, 50.2°) around λʘ = 161.33° with 10 degrees width. A (left): raw distribution, B (right): converged distribution after regression analysis.
Table 1 – Observational periods of each dataset. NCCY is the number of CCY members defined in this study as the distance from the estimated radiant center is less than 3 degrees. Nall is the total number of meteors within the analyzed period (161.33° < λʘ < 181.33°). PCCY is the proportion of CCY within the total number of observed meteors. Years in bold are the years with enhanced activity.
| SonotaCo | ||||||||||||||||
| Year | 2007 | 2008 | 2009 | 2010 | 2011 | 2012 | 2013 | 2014 | 2015 | 2016 | 2017 | 2018 | 2019 | 2020 | 2021 | Total |
| NCCY | 0 | 0 | 2 | 11 | 0 | 0 | 1 | 0 | 7 | 0 | 0 | 0 | 1 | 23 | 2 | 47 |
| Nall | 804 | 899 | 1473 | 1157 | 1708 | 1301 | 1239 | 795 | 539 | 292 | 666 | 375 | 1401 | 1078 | 1295 | 15022 |
| PCCY | 0 | 0 | 0.14 | 0.95 | 0 | 0 | 0.08 | 0 | 1.3 | 0 | 0 | 0 | 0.07 | 2.13 | 0.15 | 0.31 |
| CAMS | ||||||||||||||||
| Year | 2010 | 2011 | 2012 | 2013 | 2014 | 2015 | 2016 | Total | ||||||||
| NCCY | 0 | 1 | 3 | 2 | 6 | 132 | 2 | 146 | ||||||||
| Nall | 0 | 2672 | 2715 | 4794 | 5875 | 7349 | 5763 | 29168 | ||||||||
| PCCY | – | 0.04 | 0.11 | 0.04 | 0.1 | 1.8 | 0.03 | 0.5 | ||||||||
| EDMOND | ||||||||||||||||
| Year | 2004 | 2005 | 2006 | 2007 | 2008 | 2009 | 2010 | 2011 | 2012 | 2013 | 2014 | 2015 | 2016 | Total | ||
| NCCY | 0 | 0 | 0 | 0 | 0 | 0 | 19 | 2 | 0 | 0 | 2 | 53 | 0 | 76 | ||
| Nall | 0 | 0 | 17 | 178 | 175 | 472 | 1236 | 2182 | 2341 | 3228 | 2389 | 8549 | 672 | 21439 | ||
| PCCY | – | – | 0 | 0 | 0 | 0 | 1.54 | 0.09 | 0 | 0 | 0.08 | 0.62 | 0 | 0.35 | ||
| GMN | ||||||||||||||||
| Year | 2018 | 2019 | 2020 | 2021 | 2022 | Total | ||||||||||
| NCCY | 0 | 5 | 318 | 16 | 16 | 355 | ||||||||||
| Nall | 0 | 3529 | 11498 | 15669 | 17913 | 48609 | ||||||||||
| PCCY | – | 0.14 | 2.77 | 0.1 | 0.09 | 0.77 | ||||||||||
3 Comparison between four datasets
We have four datasets to study the chi Cygnids but each of them has different characteristics (Koseki, 2018; 2019). It seems that the difference in the observational period is very important for the chi Cygnids studies (see Table 1). And more, the periodicity of the chi Cygnids affects the apparent activity profile because the observing conditions during the year with enhanced activity are very different (see Figures 3 and 6).
3.1. Radiant drift
Figure 2 shows the radiant drift estimated from the four datasets and it is clear that they are consistent with each other. The radiant moves fast northward across Cygnus. The elongated radiant distribution in Figure 1A is caused by this fast radiant drift. Of course, the difference in position becomes larger apart from the maximum (λʘ ~173°). The estimated radiants for CAMS and GMN almost overlap because they got a large amount of chi Cygnid meteors.
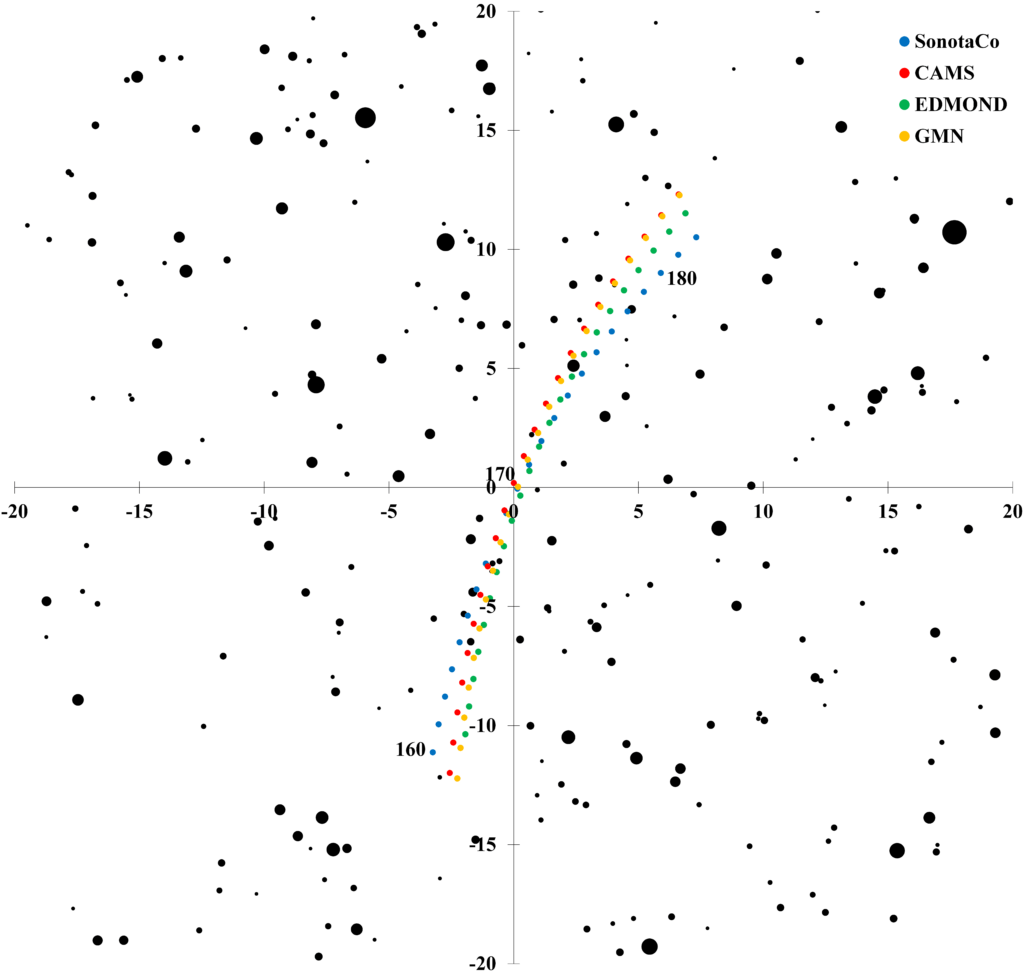
Figure 2 – Comparison of estimated radiant drift of the chi Cygnids between 160° < λʘ < 182° centered at (α, δ) = (302°, +30°). The radiant moves from the lower center upward crossing Cygnus.
3.2. Activity profile
We compare the activity profiles by the daily number of chi Cygnid meteors (Nr < =3) and by the moving mean of the 3-day bin of radiant density ratio (DR20) in Figure 3; DR20 expresses the ratio of the radiant density within 3 degrees from the center to one between 15 degrees and 20 degrees from the center.
Figure 3 – Activity profiles by daily number of chi Cygnid meteors (Nr <= 3) and by the radiant density ratio (DR20); DR20 is the ratio of the radiant density within 3 degrees from the center to one between 15 degrees and 20 degrees from the center.
September is a rainy season in Japan and, therefore, SonotaCo net got the lowest number of chi Cygnid meteors, and the profile is undulating. The maximum lies around λʘ = 172° and the raw meteor number reaches 8; suggesting that the visual hourly meteor rates (HR) would be less than 1 at the most. SonotaCo net caught the enhanced activity of the chi Cygnids three times, but the weather conditions obstructed the observations around the maximum except for 2020 (see Figure 6).
The activity profile obtained for CAMS depends on 2015 observations only and the result is affected by observational conditions (see Figure 6). The deep gap before the maximum is caused by the absence of observations. Raw data suggests that the maximum is located around λʘ = 172° but after λʘ > 175° from the radiant density ratio (DR20). The raw number at the maximum is larger than that for SonotaCo net but the DR20 is smaller.
EDMOND was organized in 2004 but the possible apparition of CCY in 2005 was missed by the scarce observations. EDMOND developed observations rapidly and, therefore, the number of the obtained CCY meteors is of course larger in 2015 than in 2010. The activity profile by EDMOND depends on 2015 observations mainly and the raw data fluctuate largely. Contrary to the results of CAMS, the supposed maximum by EDMOND locates around λʘ = 173° in DR20 but after λʘ = 175° in the raw data.
GMN observed the chi Cygnids only in 2020 but both raw and DR20 profiles are in good agreement. The two profiles reveal that the chi Cygnid maximum lies around λʘ = 173°. GMN got the most chi Cygnids of all four datasets and, therefore, the maximum raw data is of course the highest among them. The DR20 maximum reaches about 20 at the maximum and seems moderate in all four networks. This ratio means that the chi Cygnid shower is a typical minor meteor shower but not weak at its apparition.
3.3. Tendency of activity level change
We know that the first report of the chi Cygnids was made by observations of CAMS in 2015 (Jenniskens, 2015) and the detection of the apparition in 2010 was soon pointed out based on Japanese video observations (Shiba, 2015); followed by the report of the observations of EDMOND (Koukal et al., 2016). It is supposed that the shower became active in 2015 compared to 2010 because both SonotaCo net and EDMOND did not notice the apparition in 2010. We can expect that the chi Cygnid activity will be more and more active thenceforth. Unfortunately, EDMOND stopped its activity after 2016 and CAMS has not shared any results after 2016.
It may be useful to compare the different data sources using the records of the total number of obtained meteors in the period of the survey (161.33° < λʘ < 181.33°) as the reference. Table 1 gives the number of the chi Cygnid meteors classified in this study, the total number of meteors in the same period, and the ratio of the former to the latter.
We can assume that the activity of the chi Cygnids might become stronger based on SonotaCo net observations, though EDMOND suggests the apparition in 2015 might be weakened. This uncertainty comes from the small amount of data in both data sources in 2010 and in 2015. It is interesting that the proportion of the chi Cygnids observed by CAMS is about three times larger than that of EDMOND; CAMS started its observations after the chi Cygnid activity in 2010. If we take the observational conditions into consideration, the proportion could become larger because observations by CAMS around the maximum are scarce (Figure 6).
A comparison of the two apparitions in 2015 and in 2020 seems easier than the above case and the apparition in 2020 is stronger than in 2015. SonotaCo net data indicate an increase of chi Cygnid meteors. CAMS and GMN are missing the data for one of both apparitions, but both have sufficient amount of data. Even if we considered the observational condition for CAMS in 2015, its proportion (1.80) might not exceed that of GMN in 2020 (2.77). It seems clear that the apparition of 2020 was stronger than that of 2015.
We may conclude that the activity of the chi Cygnids is increasing with some uncertainty before 2015. If so, we can expect a more active chi Cygnid meteor shower in 2025.
3.4. Magnitude distribution
Four observation systems use different devices and a different data management. SonotaCo net and EDMOND use small CCD cameras that have a wide field of view and analyze meteor trails using SonotaCo software. CAMS and GMN use CCD cameras that have larger lenses and a rather narrow view and analyze data by their own software. Figure 4 compares the absolute magnitude distribution of chi Cygnid meteors compared with other meteors, excluding chi Cygnid meteors. The ordinate represents the portion in the groups; for example, 0 absolute magnitude meteors occupy about 40% of the chi Cygnids and 22% of the other meteors in the case of EDMOND. The magnitude distribution of other meteors shows the difference in the four systems.
It is clear that CAMS and GMN can catch about 1 magnitude fainter meteors than SonotaCo net and EDMOND. Both magnitude distributions in EDMOND seem curiously narrow. Photometry of meteor figures on CCD chips is difficult and its result differs by more than 1 magnitude case by case even for the same meteors. We should be careful to study the magnitude distribution of EDMOND.
We know SonotaCo net system catches fast meteors mainly but misses slower meteors compared to CAMS (Koseki, 2018). Therefore, the magnitude distribution of other meteors in Figure 4 for SonotaCo net shows mainly fast meteors. The magnitude distributions of CAMS represent the chi Cygnid apparition in 2015 and those of GMN the return in 2020.
We should be careful to draw a conclusion from Figure 4, but the peaks of the magnitude distributions suggest the chi Cygnid meteors might be fainter than the sporadic background; the GMN distribution which has the largest number of chi Cygnid meteors among the four datasets indicates this tendency strongly.
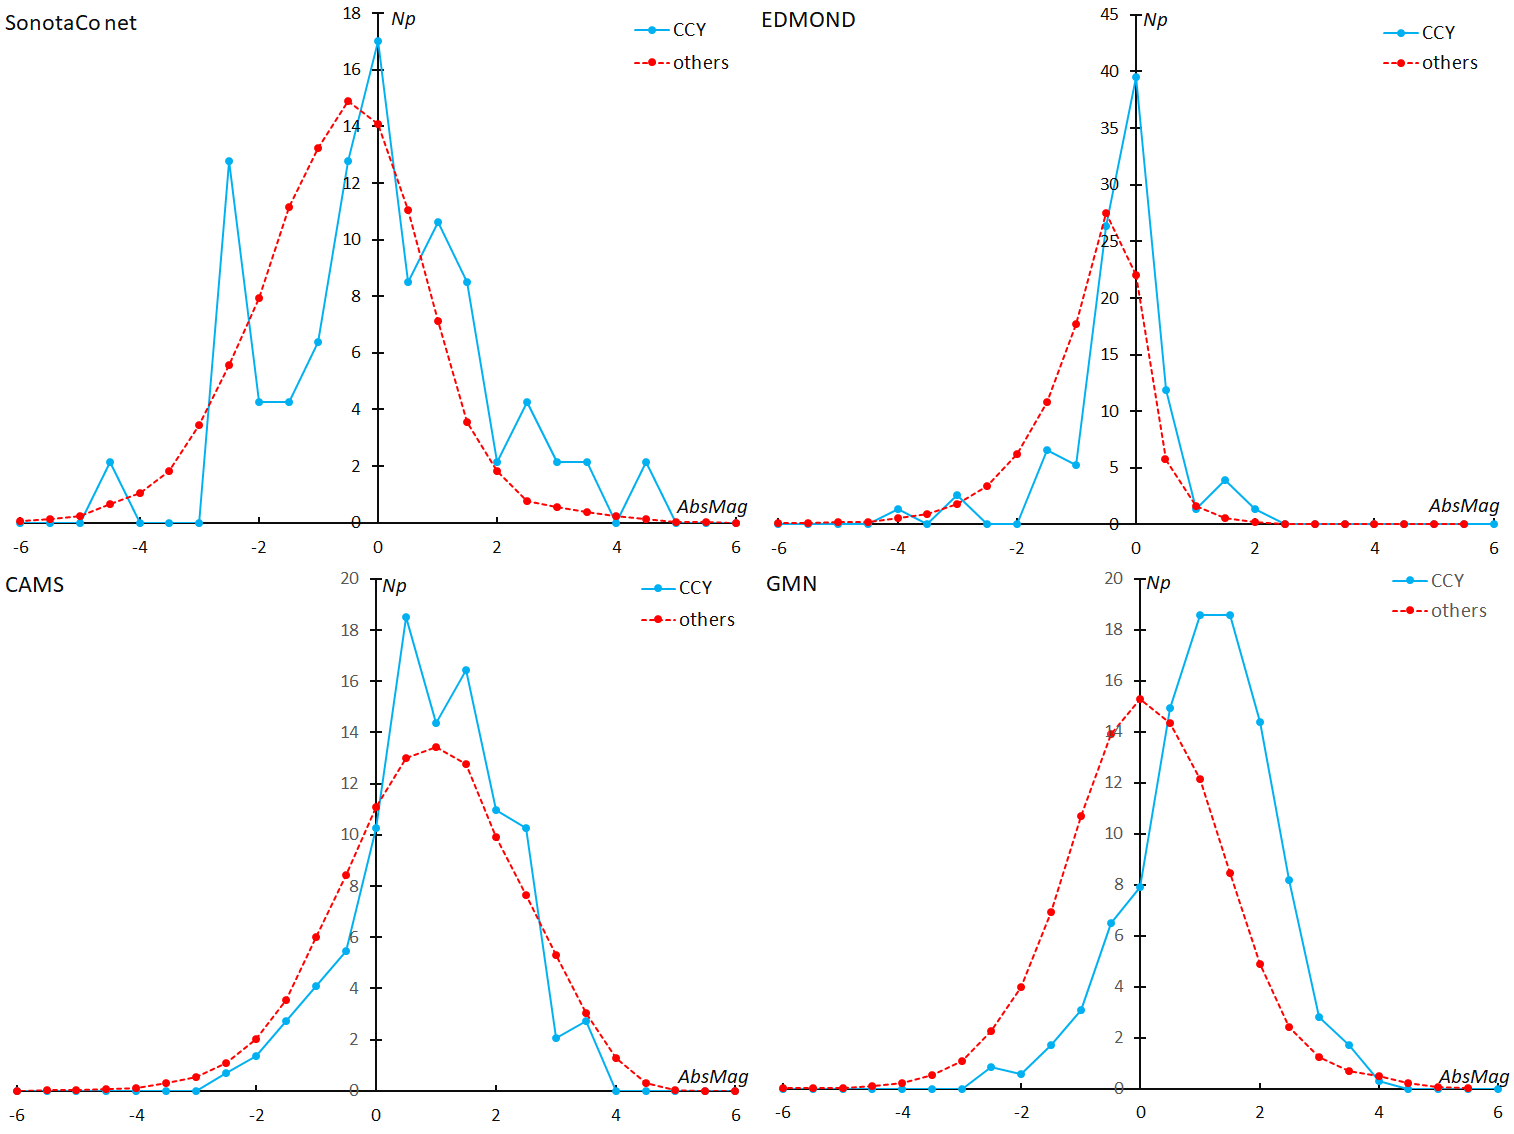
Figure 4 – Absolute magnitude distribution of chi Cygnid meteors compared with other meteors. The ordinate represents the portion in each group.
3.5. Beginning height
Meteors produced by comet 73P/Schwassmann-Wachmann3 tend to ablate higher in the atmosphere than sporadic meteors (Koseki, 2022). It is interesting to study the chi Cygnid shower which has a recurrent nature with a 5-year period. Bold lines in Figure 5 show the mean height of the beginning heights of other meteors excluding the chi Cygnid shower members.
The beginning heights of the chi Cygnid meteors in the larger part are above the bold line except for the SonotaCo net data. This exception might be caused by a tendency in SonotaCo net data, as there are less slow meteors in it.
Chi Cygnid meteors are classified as C-type by Ceplecha’s (1968) graph, though SW3 meteors are above C (Koseki, 2022). The type C meteors seem to be cometary particles and not asteroidal ones.
It is noteworthy to mention that faster meteors in the chi Cygnid shower tend to ablate higher; dots in Figure 5 distribute lower left to the upper right. The meteoroid density of the chi Cygnid meteors has been dispersed wider compared to 73P/Schwassmann-Wachmann3 meteoroids. It might be suggested that the chi Cygnid meteoroids are a mixture of young and old particles released from the parent body over a long period.
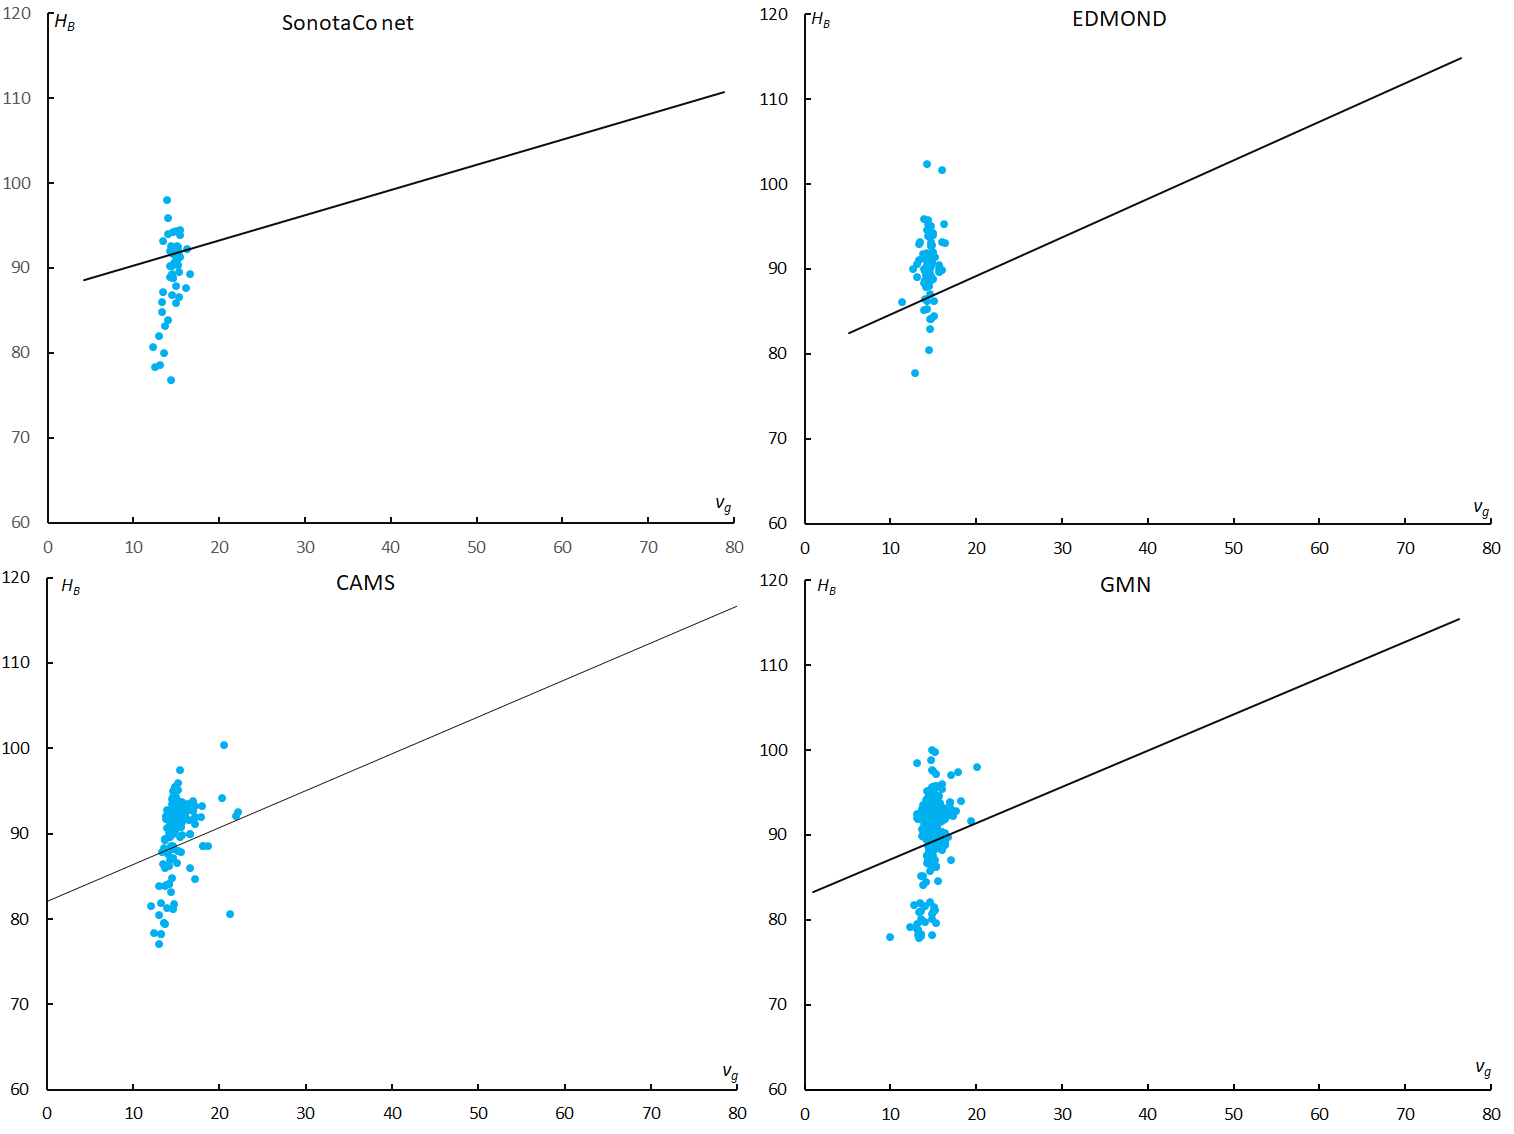
Figure 5 – Distribution of beginning height HB of chi Cygnid meteors; the bold line is the mean height of other meteors.
3.6. Conditions of observations
We cannot compare these four datasets as they are, because their devices and analyzing software are different as described above. There are additional reasons why we must be careful; observational periods in different years and its tendency, weather and technical problems which cause interruptions of observations.
Figure 6 compares the observed meteor number in a 0.1-degree bin of λʘ around the maximum (165° < λʘ < 175°). Graphs look like saw blades; observational stations are not deployed in the world evenly. The peaks of meteor numbers also change day by day as well as year to year. These changes are caused not only by natural fluctuations but also by observational conditions, such as the weather.
Figure 6 (SonotaCo net) reveals how Japanese weather conditions in September hinder optical meteor observations; the graph for 2015 is lower than in other years and this makes the chi Cygnid meteors in 2015 less numerous than in 2010 (Table 1). Figure 6 (CAMS) shows that the observed meteor number drops around the maximum and this explains the deep gap before the maximum in Figure 2 (CAMS).
Figure 6 (EDMOND) shows that the number of observations increased more in 2015 than in 2010. The observations in 2010 were limited around the maximum and, therefore, the calculated proportion of the chi Cygnids in 2010 by EDMOND in Table 1 might be exaggerated.
Figure 6 (GMN) shows stable observational conditions and the activity profile of the chi Cygnids in 2020 could be best reproduced using GMN observations (Figure 2).
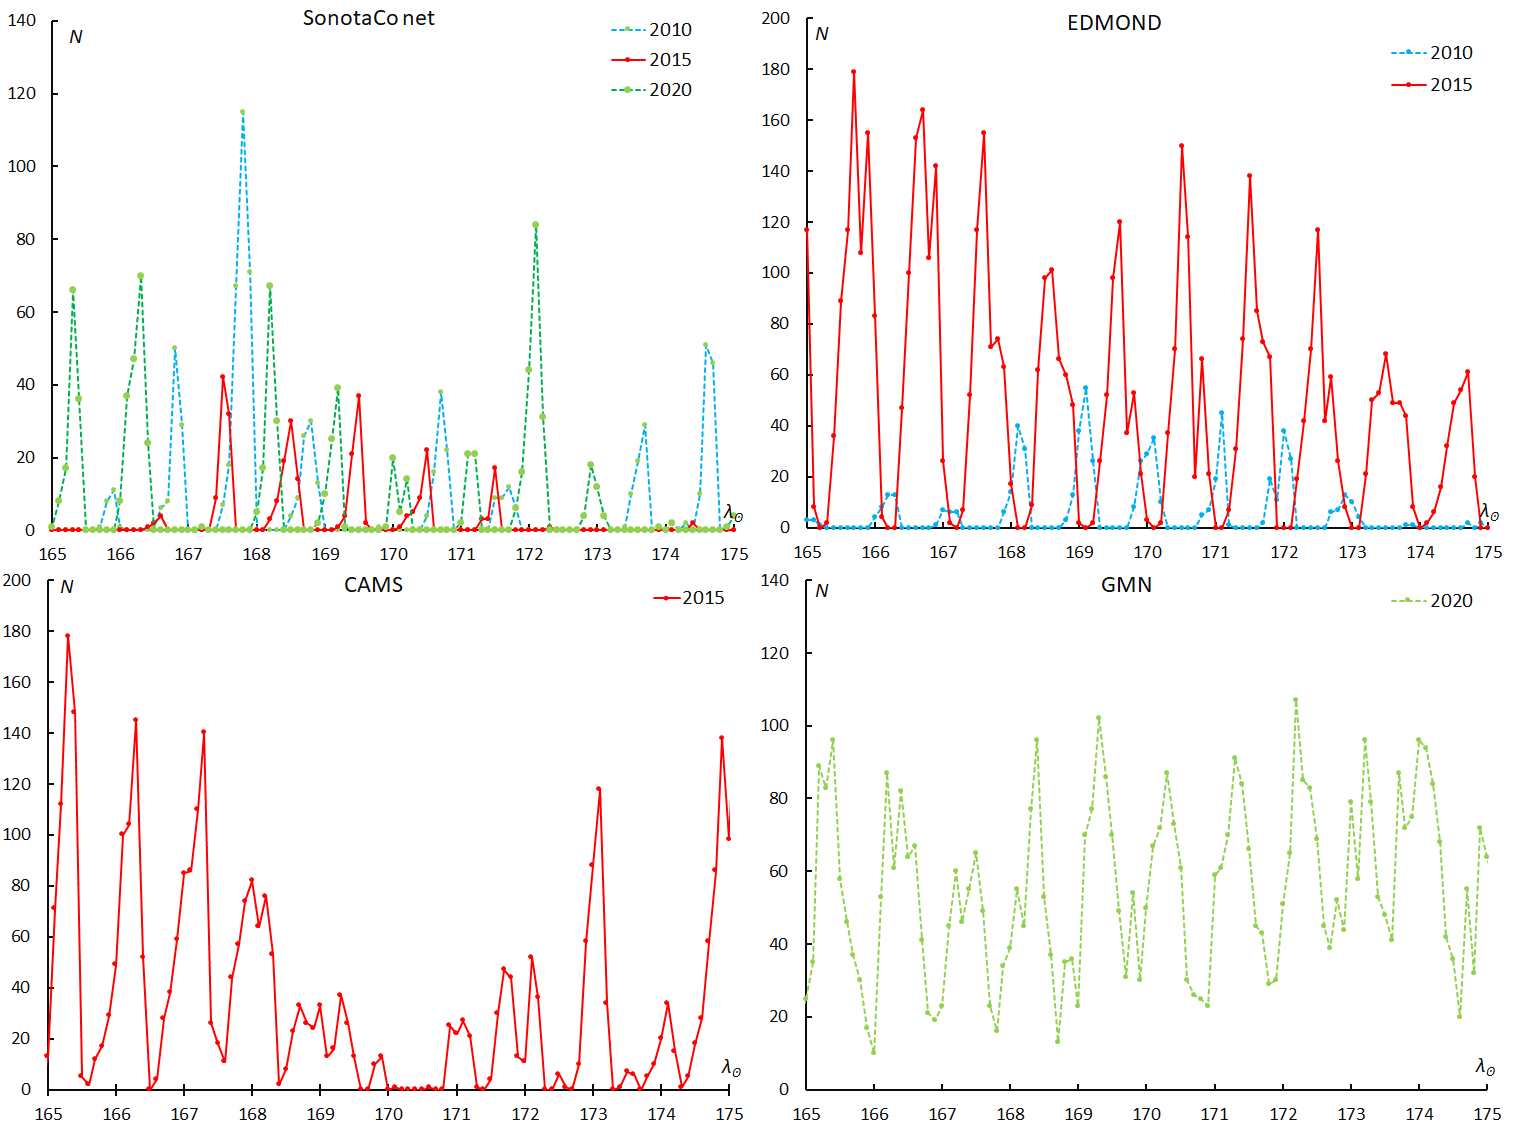
Figure 6 – All numbers of observed meteor totals in a 0.1-degree bin of λʘ around the maximum (165° < λʘ < 175°); given for enhanced years only.
4 Photographic observations of the chi Cygnids
There is no meteor shower related to the chi Cygnids in the published meteor shower catalogs though MK-92 might correspond to the chi Cygnids; the author searched meteor showers among photographic meteor orbits using the centroid method of cluster analysis DSH (Southworth and Hawkins, 1963) as a scale (Koseki, 1982); Figure 7 shows the radiant distribution of photographic meteors; the positions are compensated, the radiant drift has been estimated from GMN observations and the radii are inversely proportional to DSH calculated relative to the orbit estimated for λʘ = 173° by GMN data.
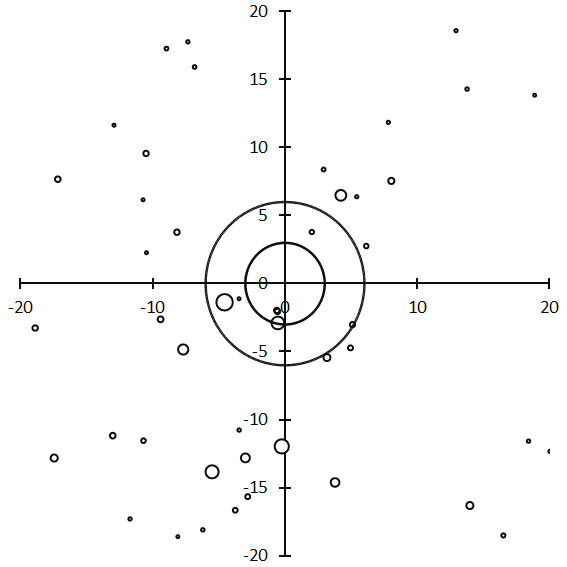
Figure 7 – The photographic radiant distribution. Centered at the estimated chi Cygnid radiant by GMN observations, the radii of the circles are inversely proportional to DSH calculated to the estimated chi Cygnids orbit at λʘ = 173° by GMN data.
We can find 16 photographic meteors within DSH < 0.20 from the estimated orbital elements from GMN at λʘ = 173° (Table 2); the 7 meteors in Table 2 in bold italic are members of MK-92, though H1-4335 has DSH > 0.20. We add K2-104 at the end of Table 2. The radiant point of K2-104 is near the estimated center (x, y) = (–6.0, 0.7), though its geocentric velocity is extremely high (vg = 35.0 km/s) and, therefore, its orbit is very different from the chi Cygnids (DSH = 1.346). Its geocentric velocity might be in error; the measurement or treatment of the data was mistaken, unfortunately, this happened sometimes in former Soviet data.
If we include two candidates, H1-4335 and K2-104, there would be enough meteors to certify a meteor shower activity. Some meteor activity related to the chi Cygnids is confirmed by photographic observations, though the radiants are much more dispersed than video observations (Figure 1B). This situation is very similar to the tau Herculids; the traditional tau Herculid radiants are wider dispersed than the radiant distribution of the outburst in 2022 (Koseki, 2022).
Table 2 – Possible members of the chi Cygnids among photographic meteors. Selected for DSH < 0.20 using the estimated orbit data from GMN at λʘ = 173°. H1-4335 is included although it has DSH > 0.20 because it is a member of MK-92; MK-92 has been found by Koseki (1982) and seems to relate to the chi Cygnids. Members of MK-92 are shown in bold italic.
| Code | Year | λʘ (°) |
λ– λʘ (°) |
β (°) |
vg (km/s) |
e | q (AU) |
i (°) |
ω (°) |
Ω (°) |
DSH | x | y |
| CCY | Ref. | 173 | 140.6 | 52.3 | 0.659 | 0.956 | 18.4 | 208.7 | 173 | ||||
| H4-10849 | 1957 | 171.7 | 148.7 | 51.3 | 16.3 | 0.685 | 0.935 | 20 | 214.3 | 171.7 | 0.068 | –4.6 | –1.4 |
| H4-10877 | 1957 | 174.6 | 138.2 | 44.3 | 13 | 0.634 | 0.955 | 14.3 | 209.3 | 174.6 | 0.08 | –0.2 | –12 |
| O4-424 | 1965 | 181 | 135.7 | 49.1 | 14.4 | 0.69 | 0.96 | 16.7 | 206.5 | 181 | 0.088 | –5.5 | –13.8 |
| O4-425 | 1965 | 183 | 124 | 62.5 | 14.3 | 0.607 | 0.986 | 19.9 | 196.9 | 183 | 0.09 | –0.5 | –2.9 |
| H2-4304 | 1952 | 169.9 | 135.6 | 57 | 15.8 | 0.701 | 0.97 | 20.4 | 204 | 169.9 | 0.108 | 4.2 | 6.5 |
| H1-4307 | 1952 | 170.7 | 153.6 | 46.3 | 16.1 | 0.66 | 0.91 | 19 | 220 | 170.7 | 0.116 | –7.7 | –4.8 |
| H6-39766 | 1967 | 189.7 | 108.3 | 57.8 | 12.1 | 0.58 | 0.995 | 15.9 | 190.4 | 189.7 | 0.133 | –3 | –12.8 |
| H1-4286 | 1952 | 167.7 | 141 | 33.3 | 12.1 | 0.62 | 0.94 | 11 | 213 | 167.7 | 0.138 | 3.8 | –14.6 |
| H6-42312 | 1974 | 179.7 | 140.8 | 40 | 13.9 | 0.69 | 0.94 | 13.7 | 212.3 | 179.7 | 0.151 | –8.6 | –21.4 |
| H6-39755A | 1967 | 178.7 | 112.7 | 42.7 | 11.3 | 0.66 | 0.992 | 11.6 | 193.7 | 178.7 | 0.167 | 14 | –16.3 |
| H6-39764C | 1967 | 187.7 | 139 | 52.5 | 14.9 | 0.67 | 0.956 | 18.1 | 207.4 | 187.7 | 0.167 | –17.4 | –12.8 |
| O3-426 | 1965 | 183 | 116.7 | 59.7 | 16.3 | 0.795 | 0.99 | 20.8 | 193.6 | 183 | 0.173 | 3.2 | –5.4 |
| H3-4313 | 1952 | 171.1 | 132.4 | 27.6 | 11.1 | 0.643 | 0.961 | 7.9 | 207.6 | 171.1 | 0.187 | 8.8 | –24.1 |
| H6-42341 | 1974 | 207.7 | 78.4 | 57.2 | 12.1 | 0.6 | 0.995 | 15.6 | 176.5 | 207.7 | 0.194 | –23.3 | –0.3 |
| H1-3802 | 1952 | 152.7 | 145.9 | 36.2 | 14.3 | 0.7 | 0.93 | 13 | 217 | 152.7 | 0.195 | 8 | 7.6 |
| H3-4964 | 1952 | 208.4 | 79.4 | 47.3 | 11.8 | 0.693 | 0.994 | 13 | 176.4 | 208.4 | 0.195 | –31.3 | –6.1 |
| H1-4335 | 1952 | 171.7 | 158.4 | 40.2 | 16.4 | 0.67 | 0.88 | 17 | 227 | 171.7 | 0.213 | –13 | –11.2 |
| Average | 179.4 | 128.8 | 47.4 | 13.9 | 0.665 | 0.958 | 15.7 | 203.9 | 179.4 | ||||
| K2-104 | 1964 | 172.6 | 150.6 | 54.3 | 35 | 1.97 | 0.912 | 35.6 | 210.8 | 172.6 | 1.346 | –6 | 0.7 |
5 Discussions
Jenniskens (2020) indicates 2020RF might be the parent body of the chi Cygnids. Figure 8 shows the perihelion distribution of chi Cygnid meteors for GMN data with the orbital plane of 2020RF and the above-mentioned photographic meteors, except for K2-104. The perihelion distribution of photographic meteors appears to be along the orbital plane of 2020RF and might suggest that these photographic meteors are descendants of asteroid 2020RF.
However, whether the chi Cygnid activity observed by video is related to it is uncertain. The video chi Cygnid meteors might be too fragile (see 3.5. Beginning height) for an asteroidal origin and their perihelion distribution appears inclined to the orbital plane of 2020RF (Figure 8).
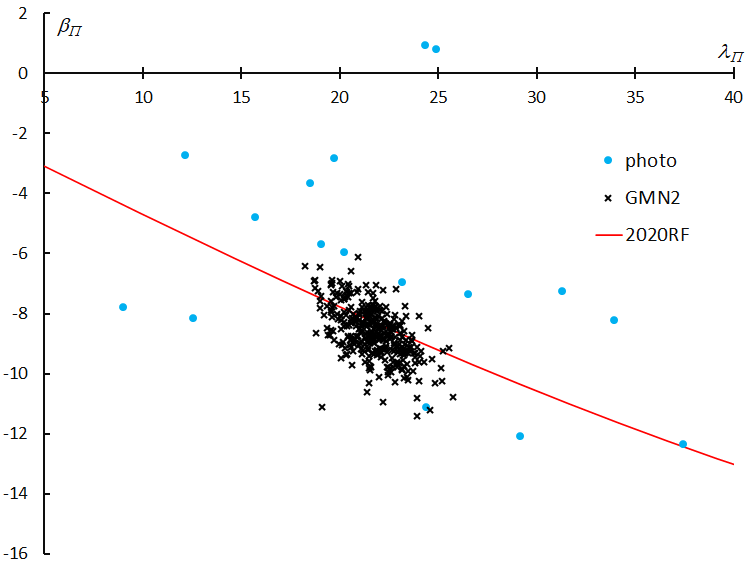
Figure 8 – Perihelion distribution of the perihelia of video and photographic meteors with the orbital plane of 2020RF. λΠ and βΠ are the ecliptic coordinates.
Four video chi Cygnid datasets indicate that the perihelion of the chi Cygnid orbit is stable and does not rotate (Figure 8 and Appendix). We estimate the activity profile of the chi Cygnids assuming a stationary perihelion and we compare DR20 obtained from GMN (Figure 9). The two graphs are in very good agreement and suggest that the chi Cygnids are under strong perturbation from Jupiter; the exact periodicity of 5 years supports this hypothesis.
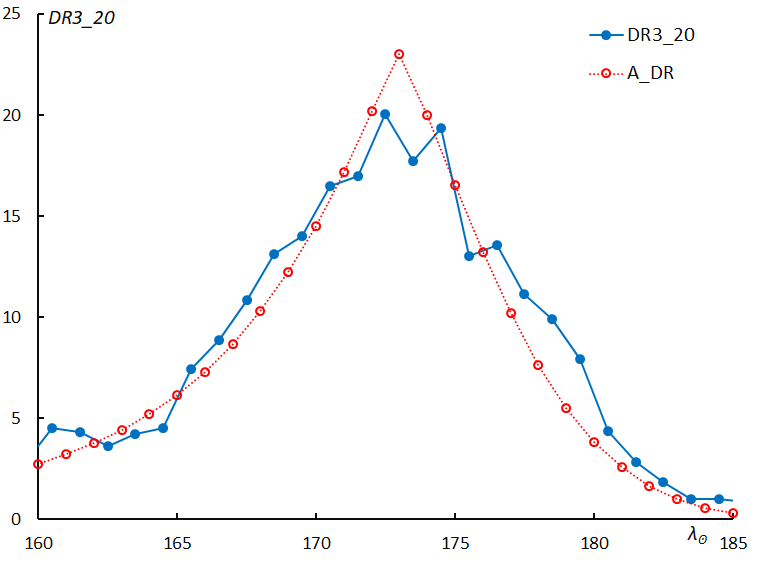
Figure 9 – Comparison of chi Cygnid activity (DR20 for GMN) and the estimated activity profile assuming a stationary perihelion (A_DR).
Acknowledgment
We appreciate the daily efforts by all camera operators of the SonotaCo net, EDMOND, CAMS and the Global Meteor Network. This analysis owes to their work. This analysis relied upon the publicly available data from the GMN group under license (Vida et al., 2019; 2020; 2021).
References
Ceplecha Z. (1968). “Discrete Levels of Meteor Beginning Height”. Smithsonian Astrophysical Observatory Special Report, 279, 54 pages.
Jenniskens P. (2015). “New Chi Cygnids meteor shower”. CBET 4144. IAU Central Bureau for Astronomical Telegrams. D.W.E. Green (ed.).
Jenniskens P., Baggaley J., Crumpton I., Aldous P., Pokorny P., Janches D., Gural P. S., Samuels D., Albers J., Howell A., Johannink C., Breukers M., Odeh M., Moskovitz N., Collison J., Ganju S. (2018). “A survey of southern hemisphere meteor showers”. Planetary Space Science, 154, 21–29.
Jenniskens P. (2020). “The 2020 chi-Cygnids”, WGN, Journal of the IMO, 48, 146–149.
Kornoš L., Koukal J., Piffl R., and Tóth J. (2014a). “EDMOND Meteor Database”. In Proceedings of the International Meteor Conference, Poznań, Poland, Aug. 22-25, 2013, Eds.: Gyssens M., Roggemans P., Zoladek, P. International Meteor Organization, pages 23–25.
Kornoš L., Matlovič P., Rudawska R., Tóth J., Hajduková M. Jr., Koukal J., and Piffl R. (2014b). “Confirmation and characterization of IAU temporary meteor showers in EDMOND database”. In Proceedings of the Meteoroids 2013 Conference, A.M. University, Poznań, Poland, Aug. 26-30, 2013, Eds.: Jopek T.J., Rietmeijer F.J.M., Watanabe J., Williams I.P. Pages 225–233.
Koseki M. (1982). “Meteor Shower Research on Photographic Meteors by Cluster analysis”. 23rd Japanese Meteor Conference. (In Japanese).
Koseki M. (2018). “Different definitions make a meteor shower distorted. The views from SonotaCo net and CAMS”. WGN, Journal of the International Meteor Organization, 46, 119–135.
Koseki M. (2019). “EDMOND and SonotaCo net”. eMetN, 4, 220–224.
Koseki M. (2022). “Global Meteor Network: Outburst produced by dust from 73P/Schwassmann-Wachmann3”. eMetN, 7, xxx–xxx.
Koukal J., Srba J., Toth J. (2016). “Confirmation of the chi Cygnids (CCY, IAU#757)”. WGN, Journal of the IMO, 44, 5–9.
Shiba Y. (2015). “χ Cygnids observation in Japan”. WGN, the Journal of the IMO, 43, 179–180.
SonotaCo (2009). “A meteor shower catalog based on video observations in 2007–2008”. WGN, Journal of the IMO, 37, 55–62.
SonotaCo, Uehara S., Sekiguchi T., Fujiwara Y., Maeda K., and Ueda M. (2021). “J14: A Meteor Shower and Cluster Catalog”. WGN, Journal of the IMO, 49,
76–97.
Southworth R. B. and Hawkins G. S. (1963). “Statistics of meteor streams”. Smithsonian Contributions to Astrophysics, 7, 261–285.
Vida D., Gural P., Brown P., Campbell-Brown M., Wiegert P. (2019). “Estimating trajectories of meteors: an observational Monte Carlo approach – I. Theory”. Monthly Notices of the Royal Astronomical Society, 491, 2688–2705.
Vida D., Gural P., Brown P., Campbell-Brown M., Wiegert P. (2020). “Estimating trajectories of meteors: an observational Monte Carlo approach – II. Results”. Monthly Notices of the Royal Astronomical Society, 491, 3996–4011.
Vida D., Šegon D., Gural P. S., Brown P. G., McIntyre M. J. M., Dijkema T. J., Pavletić L., Kukić P., Mazur M. J., Eschman P., Roggemans P., Merlak A., Zubrović D. (2021). “The Global Meteor Network – Methodology and first results”. Monthly Notices of the Royal Astronomical Society, 506, 5046–5074.