Abstract: The Andromedids’ outburst surprised meteor observers in 2021. The Andromedids were recovered by photographic observations and observed annually by video observations before λʘ < 240°. We compare former observations with the outburst and recognize this event has a unique maximum later than λʘ > 245°. This outburst is near the Great Andromedids in the 19th century but is clearly distinct from #0446DPC.
Introduction
Lovell classified the Andromedids as a lost stream (1954) and visual observers have not observed aby activity except occasionally by chance. Video observations can catch them annually now, but their daily rates are under 2 at their maximum. The Andromedids are called also Bielids by the name of their parent comet. 3D/Biela is the official name, it was broken up as ‘D’ means dead, and it had many close encounters to Jupiter. The prediction of the activity of the Andromedids is difficult because of Biela’s history and, therefore, we were surprised by their sudden outburst in 2021. In this analysis, we study the unique character of this outburst using video observations.
Recovery of the Andromedids
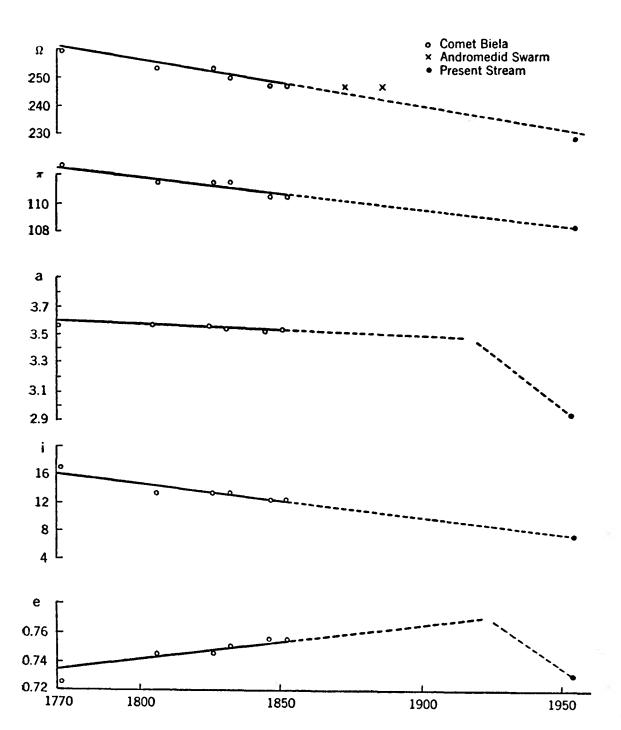
Figure 1 – ’The recovery of the Andromedids’, Hawkins et al. (1958).
Hawkins et al. (1958) reported the Andromedids were recovered by photographic observations and suggested that their radiant moved southward; the inclination of the stream decreased (Figure 1). But we had to wait to certify the recovery until video observations had enough developed. SonotaCo found the Andromedids in Japanese video observations (2009, See also “SonotaCo Network Simultaneously Observed Meteor Data Sets”, http://sonotaco.jp/doc/SNM/).
Koseki published the meteor shower catalog by using SonotaCo net results 2007–2018 observations (2021). Figure 2 shows the result for the Andromedid activity and this shower is active for a full month. The meteor activity could be better expressed by the radiant density ratios (Koseki, 2019). The activity profiles indicate their maximum differently: Nr ≤ 3 and DR10 suggest the maximum around λʘ = 224°~226°, DR = 3 and DR15 show their peak around λʘ = 230°, but there seems to be another one around λʘ = 240° (see Table 1 for the meaning of the abbreviations).
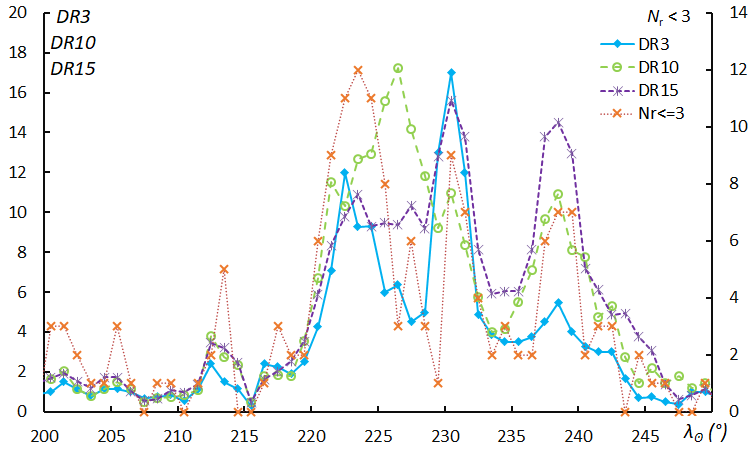
Figure 2 – The activity profiles of video Andromedids.
Figure 3 represents the radiant shift of the Andromedids (dotted line) and their path reaches the radiant of the Great Andromedids (left circle in Figure 3 is for 1872 and the right circle is for 1885). The asterisk and the plus in Figure 3 show the radiant of December psi Cassiopeiids (#0446DPC) by CMOR and CAMS respectively in 2011.
Table 1 – The abbreviations used in the activity profiles; r is the distance from the center in degrees, S is the area in which radiants are counted, in square degrees, DR3~DR15 are calculated as N1/S1/(N2/S2) = R*N1/N2 using the sliding mean in 3 degrees λʘ bins.
| Abbriation | Base limit | Radiants | Area (S1) | Reference limit | Radiants | Area (S2) | S2/S1 = R |
| N ≤ 3 | r ≤ 3 | N1 | – | ||||
| DR3 | r ≤ 3 | N1 | 28.3 | 3 < r ≤ 6 | N2 | 84.7 | 2.997 |
| DR10 | r ≤ 3 | N1 | 28.3 | 6 < r ≤ 10 | N2 | 200.4 | 7.088 |
| DR15 | r ≤ 3 | N1 | 28.3 | 10 < r ≤ 15 | N2 | 389.5 | 13.778 |
Table 2 – Yearly number of the classified AND and DPC meteors during the period 2007–2018.
| Year | 2007 | 2008 | 2009 | 2010 | 2011 | 2012 | 2013 | 2014 | 2015 | 2016 | 2017 | 2018 | Total |
| AND | 7 | 12 | 20 | 23 | 6 | 12 | 6 | 11 | 17 | 20 | 17 | 16 | 167 |
| DPC | 0 | 1 | 0 | 0 | 20 | 1 | 2 | 1 | 1 | 2 | 1 | 1 | 30 |
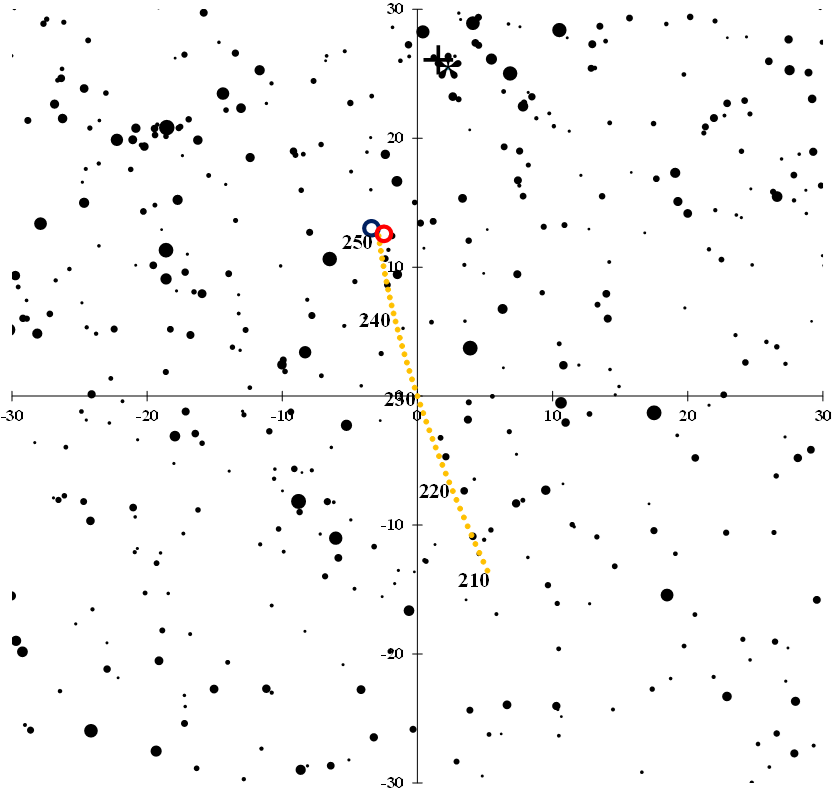
Figure 3 – The radiant shift derived by video observations.
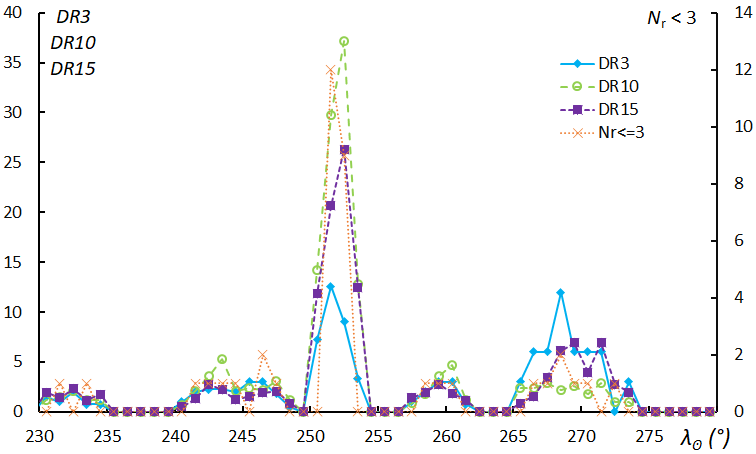
Figure 4 – The activity profiles of the December psi Cassiopeiids (0446DPC00) by Japanese video observations.
The December psi Cassiopeiids (#0446DPC) is listed in the IAUMDC meteor shower database (SD) with as its parent body 3D/Biela (the version of 2018 January 13, 20h35m17s of the SD has been used (IAUMDC SD, https://www.ta3.sk/IAUC22DB/MDC2007/index.php) but this shower is not a part of the annual Andromedid activity. Japanese video observations observed the 2011 outburst of the December psi Cassiopeiids (#0446DPC) (Figure 4 and 5). Both figures are not corrected for the radiant shift because the activity is quite short as Figure 4 shows; #446DPC is not the late Andromedid activity because the latter seems to cease before the spike of the former activity occurs (Figure 1).
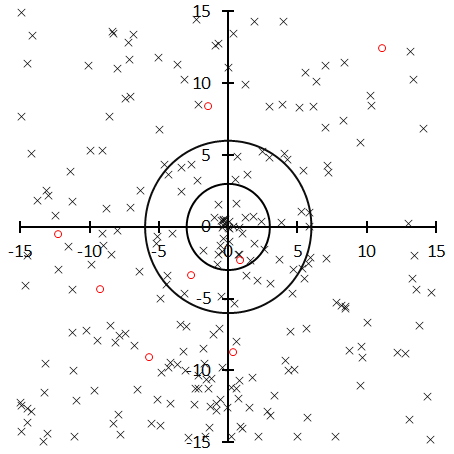
Figure 5 – The radiant distributions of the December psi Cassiopeiids (0446DPC00) by Japanese video observations.
The radiant of the December psi Cassiopeiids (#0446DPC) is very compact as shown in Figure 5 and does not match the prolonged path of the annual Andromedids. We can add one more suggestion on the separation of #446DPC from the Andromedids by the yearly change in the observed number of meteors (Table 2). #446DPC has not been observed except for 2011 practically. But a photographic radiant (red circle) in Figure 5 within the most inner circle is H4-9596 observed in 1956. It hits the maximum of #446DPC and suggests #446DPC has an annual or a recurrent nature.
We know now the Andromedids are not dead but can still produce meteor activity related to 3D/Biela.
Observations of Global Meteor Network (GMN) 2021
The Andromedids displayed a sudden outburst on November 28, 2021. The peak occurred around 5h (UT) and favored observers in Europe and America. The Global Meteor Network collected many useful data (Roggemans et al., 2022). The data in GMN is increasing rapidly and it is not necessary to exclude observations before 2021 to investigate the Andromedids. We, therefore, used all GMN data (as available, downloaded on 2022-07-04 00h51m26.021001s UTC) and applied #0018AND00 (λʘ = 232°, λ – λʘ = 162.6°, β = +20.8°, Δλʘ = 25°) as the startup data. We changed the startup because this outburst occurred later than the latest limit of the former study where we adopted #0018AND01 (λʘ = 228.6°, λ – λʘ = 163.4°, β = +18.8°, Δλʘ = = 10°) as the startup (Figure 2). Figure 6a represents the radiant distributions centered at #0018AND00 and Figure 6b indicates the converged radiant distribution: the results of the iteration steps (see Figure 9a~c). The radiant distribution and the density from the center are shown in Table 3 and Figure 7.
The density decreases rapidly with the distance from the center (r) and might be constant for r > 10. We can accept Density = 3 is the sporadic background. We can, therefore, classify radiants in r = 3~4 as Andromedids with 50% probability. It is clear that the radiant area of the Andromedids is compact.
Table 3 – The final radiant distribution density from the center. r is the distance from the center, N is the number of radiants between r–1 to r, the Area is represented in square degrees between r–1 to r, Density is calculated from N by dividing N by the Area.
| r | N | Area | Density |
| 1 | 640 | 3.1 | 203.7 |
| 2 | 398 | 9.4 | 42.2 |
| 3 | 202 | 15.7 | 12.9 |
| 4 | 121 | 22 | 5.5 |
| 5 | 135 | 28.2 | 4.8 |
| 6 | 140 | 34.5 | 4.1 |
| 7 | 144 | 40.8 | 3.5 |
| 8 | 183 | 47 | 3.9 |
| 9 | 181 | 53.2 | 3.4 |
| 10 | 160 | 59.4 | 2.7 |
| 11 | 233 | 65.6 | 3.6 |
| 12 | 237 | 71.8 | 3.3 |
| 13 | 216 | 77.9 | 2.8 |
| 14 | 260 | 84 | 3.1 |
| 15 | 270 | 90.1 | 3 |
| 16 | 261 | 96.2 | 2.7 |
| 17 | 317 | 102.2 | 3.1 |
| 18 | 300 | 108.3 | 2.8 |
| 19 | 345 | 114.2 | 3 |
| 20 | 344 | 120.2 | 2.9 |
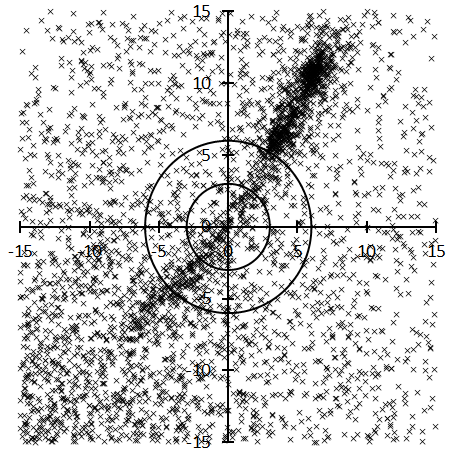
Figure 6a– The initial radiant distribution of the Andromedids (0018AND00).
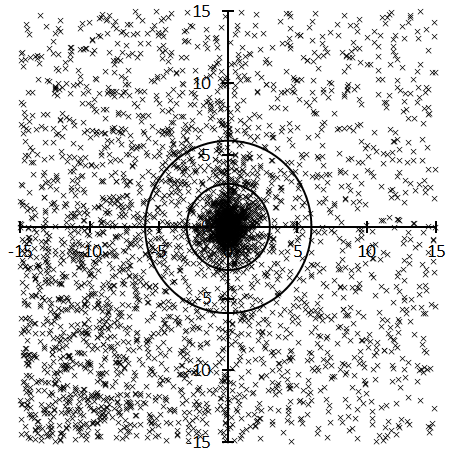
Figure 6b – The final radiant distribution through the iteration processes of the Andromedids (0018AND00).
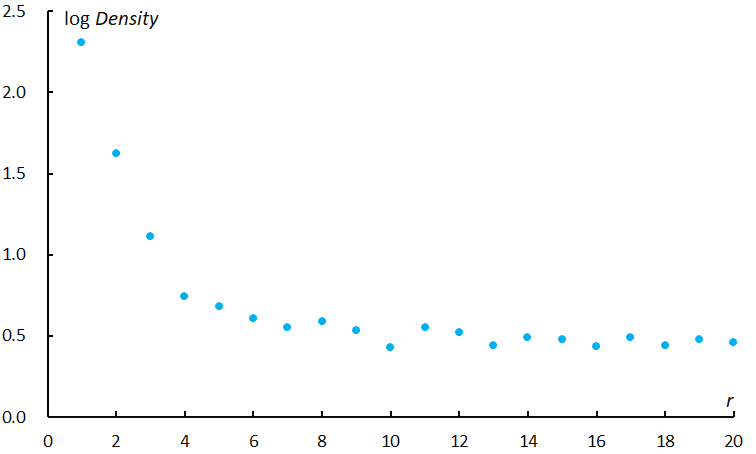
Figure 7 – The radiant density distribution from the center.
It is reasonable that we define the radiants within 3 degrees of the center as members of the Andromedids. The yearly number of the observed number of Andromedids is shown in Table 4. The Andromedids in 2021 are dominant because of the outburst of the Andromedids but also the rapid increase of the observations naturally. The following activity graphs are including 2019 and 2020 observations but this inclusion does not affect the conclusion. It is better to note that this regression study ignores the original classification in the GMN data. We omitted 113 Andromedids from the GMN data and included 98 sporadics and 34 DPC meteors from GMN (see Table 5); most of the omitted radiants were distributed between 3 to 6 degrees from the center of the figure or outside of the activity period considered in the GMN research.
Table 4 – Yearly number of the Andromedids observed by GMN.
| Year | 2018 | 2019 | 2020 | 2021 | Total |
| N | 0 | 64 | 114 | 1062 | 1240 |
Table 5 – The number of meteors classified as AND and DPC in GMN.
| AND | DPC | sporadic | Total |
| 1108 | 34 | 98 | 1240 |
Figure 8a shows the activity profiles of the Andromedids in the same manner as Figures 2 and 4. It is impressive that the 2021 outburst occurred after the annual activity of the Andromedids represented by Japanese 2007–2018 observations (Figure 2). Figure 8b gives the detailed graph by the moving mean with a 1-degree bin sliding with 0.1-degree steps. We can draw the transition more precisely by counting the periods between each 30 radiants on a time scale. We can calculate the number of radiants per 1 solar longitude easily by 30/(a time span of 30 radiants). Figure 8c clearly shows the condition; GMN catched meteors well between λʘ = 245.5~245.9°. It is very clear that the outburst is a short-lived one; the activity drops rapidly after λʘ > 245.9°. But we are uncertain whether the decrease occurred by the activity change itself or if the approaching twilight over Europe caused this. We will check this drop by using Japanese observations later.
Former Japanese observations suggest the Andromedids have several sub-maxima as shown in Figure 2. This indicates the annual Andromedids are composed of several segments including this outburst.
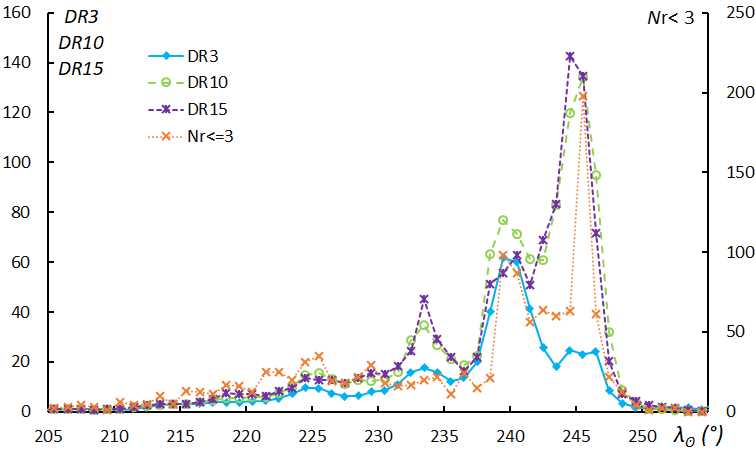
Figure 8a – The activity profiles of the Andromedids (0018AND00).
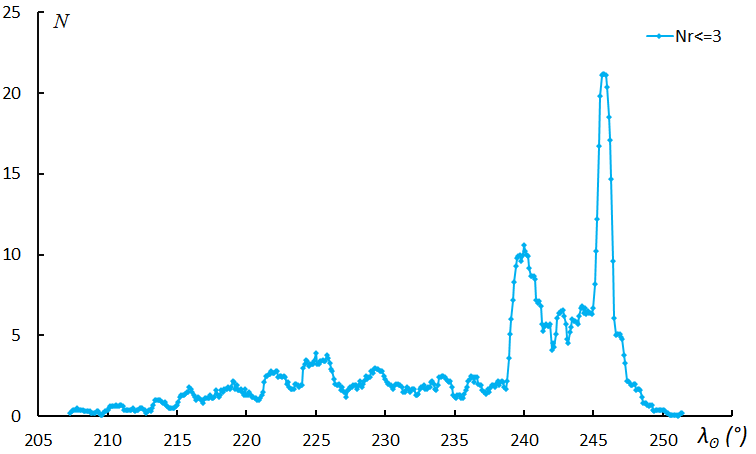
Figure 8b – The sliding mean of the radiants classified as Andromdids using 1 degree bins with 0.1-degree steps in λʘ.
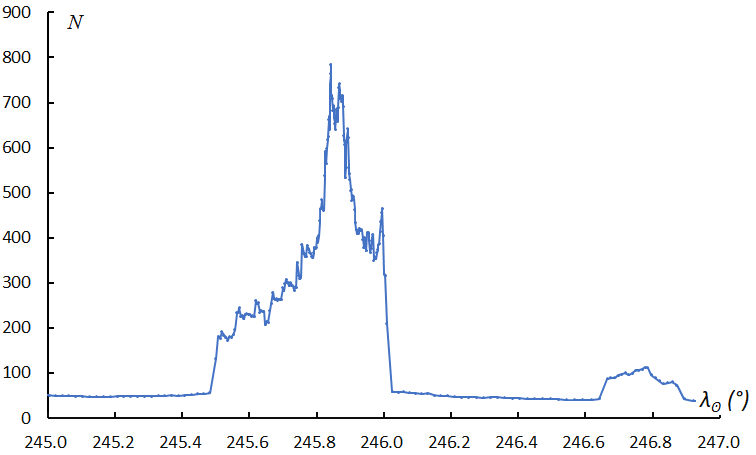
Figure 8c – The estimated activity progress using each time span of 30 Andromedids meteors.
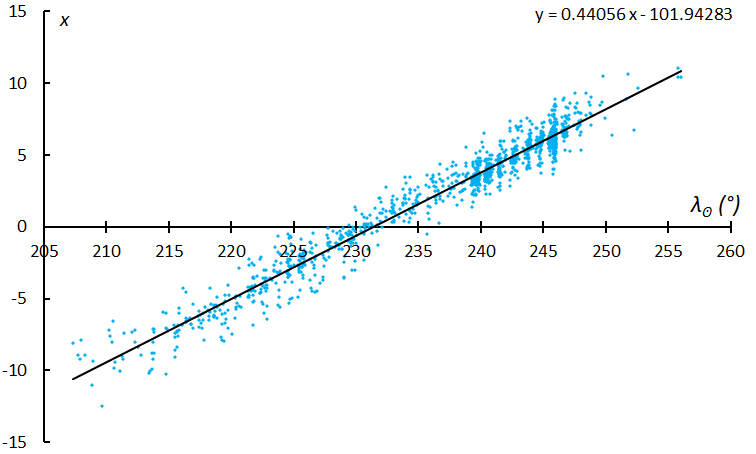
Figure 9a – The final regression results on x in the radiant distribution.
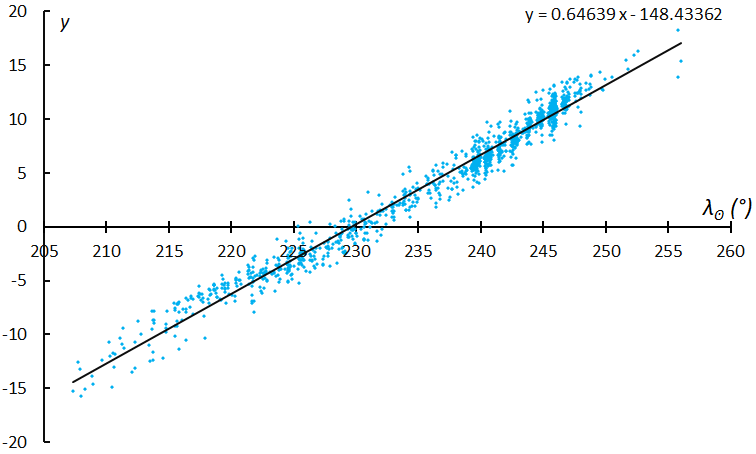
Figure 9b – The final regression results on y in the radiant distribution.
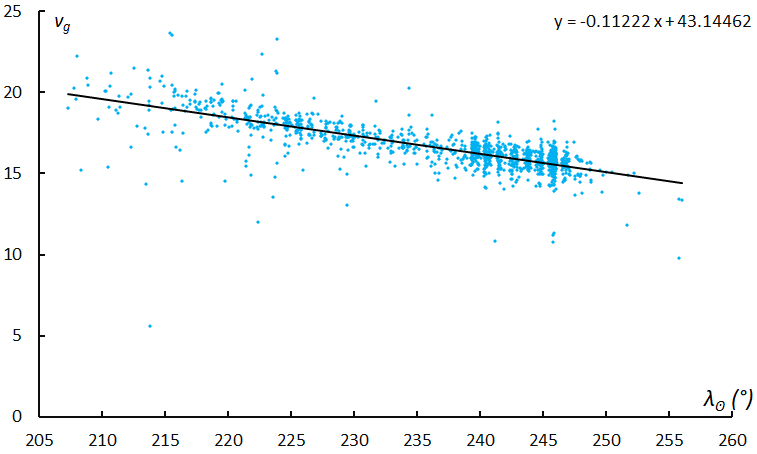
Figure 9c – The final regression results on the geocentric velocity (vg) for the selected meteors in Figure 9a and 9b.
We used linear regression to get the conversion (Figure 9a~c); the dots in the graph express the radiants within the estimated center. The radiant shift in the x-axis (Figure 9a) might suggest the distribution bends around λʘ = 230°. Also, the radiant shift in the y-axis (Figure 9b) shows a rather clear bending around λʘ = 230° and around λʘ = 220°. The geocentric velocity (vg) does not indicate the bending around λʘ = 230° but suggests the deviation from the line before λʘ < 220°. We will come back to this problem in the next section (concerning Table 7b).
Note on #0446DPC in GMN
The December psi Cassiopeiids (#0446DPC) were observed as a short-lived and compact activity (see Figure 4 and 5). According to the GMN classification #0446DPC have a longer activity period and a larger radiant area. Figure 10 and 11a are plotted based on the GMN’s classification. The radiant distributions are shown centered at #0446DPC00, λʘ = 252°, λ – λʘ = 152.8, β = +44.8°, Δλʘ = 10°, DPC shower members are indicated with red circles. The crowd below the center represents the Andromedids. GMN’s DPC radiants overlap with the Andromedids, and they are too elongated compared with the Andromedids’ area. This classification distorts the activity graph (Figure 11a); the false peak appears before λʘ < 245° because of the contamination by the Andromedids.
If we count the radiants within 3 degrees from the center, DPC’s maximum would become clearer (Figure 11b). Radiants between the DPC and the Andromedids might be caused by sporadic activity; it would be a future work to investigate the relation between them.
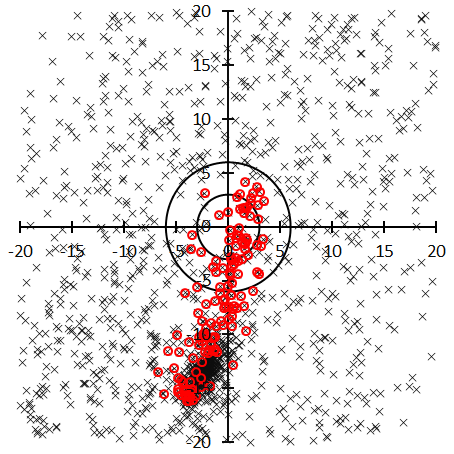
Figure 10 – The radiant distributions centered at DPC (0446DPC00) in λʘ = 242~262°. Red circles are classified as DPC in GMN.
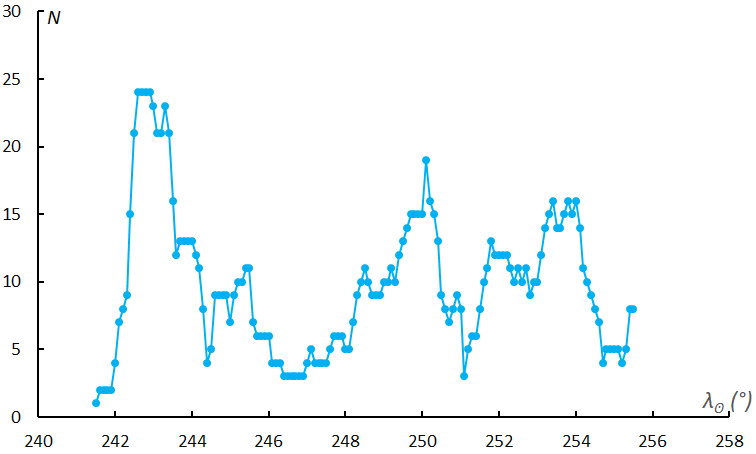
Figure 11a – The sliding mean of the radiants classified as DPC in GMN using 1 degree bins with 0.1-degree steps in λʘ.
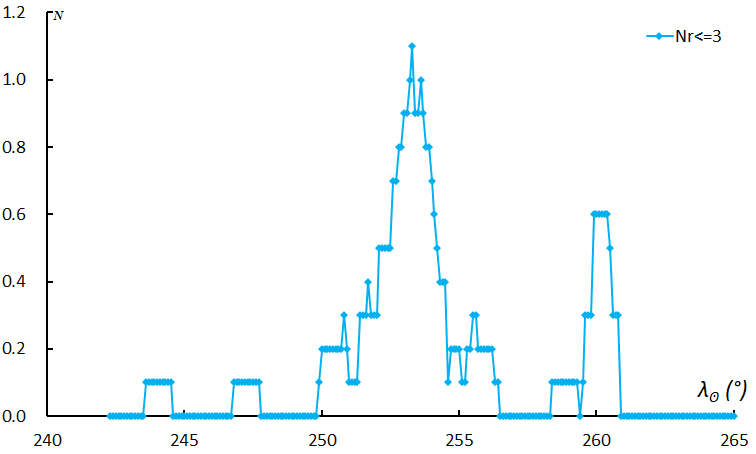
Figure 11b – The sliding mean of the number of radiants within 3 degrees from the center of Figure 10 using 1 degree bins with 0.1-degree steps in λʘ.
Observations of SonotaCo net extending to 2021
We analyzed the annual Andromedids using SonotaCo net data 2007–18 (Figure 2 and Koseki, 2021). It seems to be better to extend the data to 2021 and rather not study 2021 data individually. We ignored the original classification as used in the former analysis but changed the startup because this outburst occurred later than the latest limit of the former study where we adopted #0018AND01 (λʘ = 228.6°, λ – λʘ = 163.4°, β = +18.8°, Δλʘ = 10°) as the startup (Figure 2). The data shown here are the results of #0018AND00 (λʘ = 232°, λ – λʘ = 162.6°, β = +20.8°, Δλʘ = 25°) as the startup data.
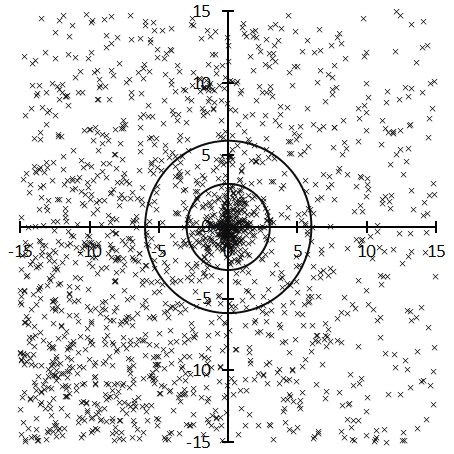
Figure 12 – The final regression results of the Andromedids (0018AND00) in SonotaCo net data.
The radiant distribution (Figure 12) resembles that of the GMN results (Figure 6b) though the December psi Cassiopeiids (#0446DPC) radiants can be recognized close to the 10°-mark on the y-axis because this figure is including 2011 observations. We can confirm here also that it is proper to use radiants within r < 3° as Andromedids. Table 6 gives the yearly number of the Andromedids and it is clear that the 2021 outburst was about ten times more active than the activity in regular years.
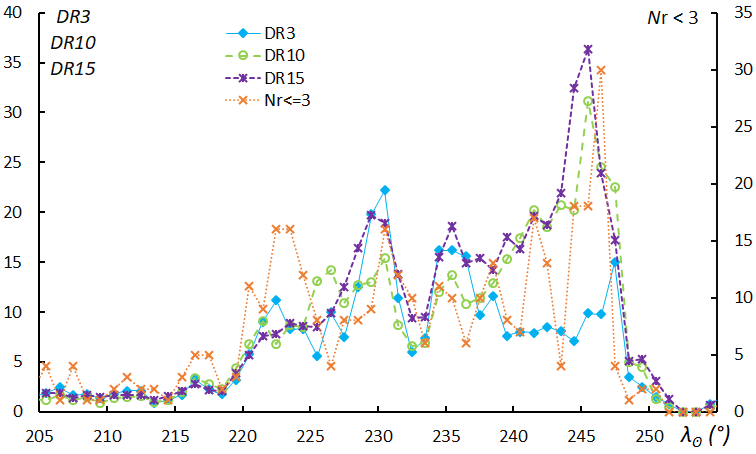
Figure 13a – The activity profiles of the Andromedids in 2007–2021 (0018AND00) by SonotaCo net.
The activity profiles represented in Figure 13a differ from GMN results (Figure 8a) because the profiles in Figure 13a are influenced by observations from before 2021. We can easily indicate the multi peaks of the activity like in Figure 2 but the most intense peak is around λʘ = 245° as GMN shows.
Figure 13b gives the detailed graph by the sliding mean with a 1-degree bin sliding by 0.1-degree steps. Japanese video observations started from λʘ > 246.0° but the activity did not increase after the evening twilight ended. We can confirm the results of GMN; the outburst was a short-lived one and the activity dropped rapidly after λʘ > 245.9°.
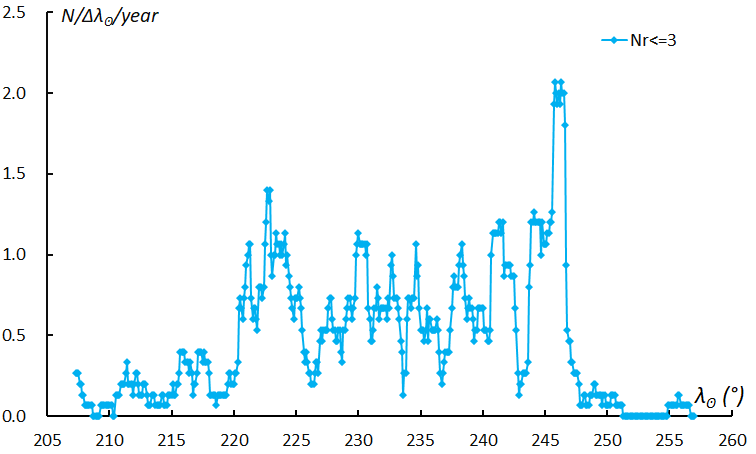
Figure 13b – The sliding mean of the classified radiants as Andromdids usng a 1 degree bin with 0.1-degree steps in λʘ.
The y-axis in Figure 13b gives the mean number of observed radiants per day but it is necessary to note that these profiles represent the mean values for 15 years while Figure 8b is based on almost 2021 data only. If the difference in number of observational years is considered, the observed number per day would be almost the same.
Figure 14 represents the distribution of the radiants taken from several interesting lists; background (cross): the showers in the SD, target (red box): the Andromedids showers in the SD, photo (circle): photographic observations, LIST (triangle: excluded meteor shower lists of the SD).
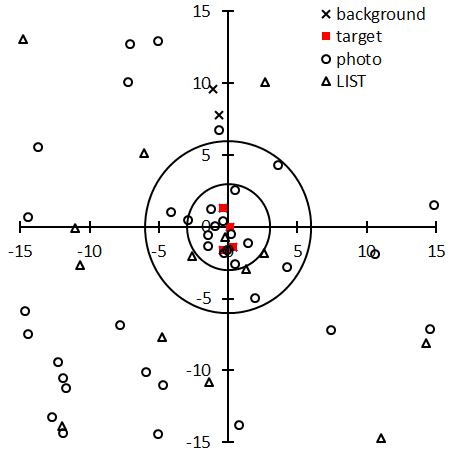
Figure 14 – The radiant distributions of several meteor shower sources.
Table 6 – The revised yearly number of the Andromedids extending to 2021.
| Year | 2007 | 2008 | 2009 | 2010 | 2011 | 2012 | 2013 | 2014 | 2015 | 2016 | 2017 | 2018 | 2019 | 2020 | 2021 | Tot. |
| N | 7 | 16 | 22 | 17 | 6 | 14 | 5 | 12 | 18 | 20 | 15 | 13 | 14 | 33 | 143 | 355 |
Table 7a – The SD showers in Figure 14: background (cross) and target (red box) in Figure 14.
| Code | λʘ | λ – λʘ | β | vg | Distance | Angle | x | y |
| 0018AND02 | 223 | 166.8 | 17.9 | 18.2 | 1.4 | 16 | –0.4 | 1.3 |
| 0018AND01 | 228.6 | 163.4 | 18.8 | 17 | 1.5 | 194 | 0.4 | –1.4 |
| 0018AND03 | 230.4 | 162.8 | 21.4 | 17.5 | 0.2 | 254 | 0.1 | 0 |
| 0018AND00 | 232 | 162.6 | 20.8 | 17.2 | 1.7 | 166 | –0.4 | –1.7 |
| 0446DPC01 | 250.4 | 153.1 | 42 | 16.5 | 7.8 | 5 | –0.7 | 7.8 |
| 0446DPC00 | 252 | 152.8 | 44.8 | 16.5 | 9.7 | 7 | –1.1 | 9.6 |
Table 7b – Possible Andromedids in photographic observations (within 6 degrees from the center of Figure 14).
| Code | λʘ | λ – λʘ | β | vg | Distance | Angle | x | y |
| D1-66 | 208.3 | 170.9 | 1.7 | 19.77 | 5.3 | 202 | 2 | –5 |
| H1-4977 | 208.7 | 175.6 | 7.4 | 22.4 | 2.9 | 81 | –2.9 | 0.5 |
| H1-4967 | 208.7 | 176.9 | 7.9 | 20.1 | 4.3 | 76 | –4.2 | 1 |
| H3-9172 | 221.1 | 166.8 | 12.6 | 22.46 | 2.7 | 190 | 0.5 | –2.6 |
| H4-11093b | 211.2 | 172.9 | 9.8 | 20.68 | 1.7 | 45 | –1.2 | 1.2 |
| H4-12336 | 223.8 | 166.4 | 17.4 | 19.18 | 0.5 | 44 | –0.4 | 0.4 |
| H5-2622 | 225.1 | 165.5 | 16.3 | 18.8 | 1.6 | 178 | –0.1 | –1.6 |
| H2-5337 | 225.3 | 166.9 | 16.7 | 17.4 | 2 | 133 | –1.5 | –1.4 |
| H1-5335 | 225.7 | 165.5 | 16.5 | 17.7 | 1.9 | 170 | –0.3 | –1.8 |
| H1-5339 | 225.7 | 161.3 | 22.6 | 17.3 | 5.6 | 320 | 3.6 | 4.3 |
| K1-31 | 228.7 | 159.3 | 17.5 | 13.4 | 5.1 | 237 | 4.3 | –2.8 |
| H1-5392 | 230.7 | 162.6 | 21.1 | 18.1 | 0.6 | 203 | 0.2 | –0.5 |
| H1-5384 | 230.7 | 163.8 | 21.7 | 2.7 | 0.9 | 86 | –0.9 | 0.1 |
| H1-5382 | 230.7 | 161.3 | 20.5 | 17.4 | 1.8 | 232 | 1.4 | –1.1 |
| H4-11182 | 232.2 | 163.6 | 22.1 | 17.55 | 1.5 | 110 | –1.4 | –0.5 |
| H3-9379 | 249.3 | 152.3 | 36.1 | 16.14 | 2.6 | 350 | 0.5 | 2.5 |
Table 7c – Meteor showers not listed in the SD (within 6 degrees from the center of Figure 14).
| Code | λʘ | λ – λʘ | β | vg | Distance | Angle | x | y |
| LE-512 | 211.7 | 168.8 | 7.1 | 20.8 | 3.2 | 235 | 2.6 | –1.8 |
| L1-129 | 228.2 | 164.2 | 19.3 | 21 | 0.8 | 164 | –0.2 | –0.7 |
| LE-565 | 234.3 | 163.8 | 21.9 | 21.2 | 3.3 | 129 | –2.6 | –2.1 |
| LE-630 | 243.2 | 154.9 | 26.8 | 19.9 | 3.2 | 204 | 1.3 | –2.9 |
The Andromedids in the SD distribute well within 3 degrees from the center and the December psi Cassiopeiids are located about 10 degrees above the center as indicated in Figure 12.
We found 16 photographic meteors within 6 degrees from the center and confirm ‘the recovery of the Andromedids’. It should be noted that photographic data suggest that the annual Andromedids reach their maximum around λʘ = 225° as shown in Figure 2 with Japanese video observations. The geocentric velocity of H1-5384 is extremely low but this is because of the graphical reduction. We note there are three small camera observations; one is H5-2622 and two are former Soviet records (D1-66 and K1-31). This means that the annual Andromedids do not consist of faint, but rather bright meteors. We suggested that the regression graphs might bend at about λʘ = 220° and λʘ = 230° in the GMN observations (Figure 9a~c). The photographic meteors before λʘ = 220° are faster than the later ones and seem to coincide with the GMN results (Figure 9c). The photographic maximum before λʘ = 230° might indicate this activity comes from the different segments of the Andromedids after the λʘ = 230° ones as Figures 2 and 13b suggest.
It is interesting that although one is a photographic survey (L1-129, Lindblad) the three others are radar observations (LE-512, LE-565, LE-630). The latter three are not independent observations because the radar operations at that time needed some maintenance period and the observations were interrupted; it seems that the three entries express one continual activity.
Acknowledgment
We appreciate the daily efforts of all meteor observers of the Global Meteor Network and SonotaCo net.
The author would like to give special thanks to Paul Roggemans. Though the database of GMN is open, the author failed to download it due to problems of Windows10; Windows says ‘memory over’ every time not because of the PC’s memory. Paul kindly downloaded the GMN-dataset and sent it to me. The author is now free to use GMN data up to July 4, 2022. This offers a very nice opportunity to investigate other minor shower activities. Thank you very much Paul.
References
Hawkins G. S., Southworth R. B., and Stienon F. (1959). “Recovery of the Andromedids”. Astron. J., 64, 183–188.
Koseki M. (2019). “Profiles of meteor shower activities inferred from the radiant Density Ratios (DR)”, WGN, Journal of the IMO, 47, 168–179.
Koseki M. (2021). “The activity of meteor showers recorded by SonotaCo Net video observations 2007–2018”. eMetN, 6, 91–246.
Lovell A.C.B. (1954). Meteor Astronomy, Oxford, Clarendon Press.
SonotaCo (2009). “A meteor shower catalog based on video observations in 2007–2008”. WGN, Journal of the IMO, 37, 55–62.


