Abstract: The Brazilian Meteor Observation Network (BRAMON) is a meteor detection network that has been implemented in Brazil since 2014. BRAMON recorded about 27000 paired meteors with double or multiple stations between 2014 and 2021. A comparison between population indexes r obtained from visual observations and BRAMON data for the alpha Capricornid (CAP #00001), the eta Aquariid (ETA #00031), and the Geminid (GEM #00004) meteor showers suggests that this parameter is probably influenced by the difference in detection probability between visual and TV observational procedures, as well as by the zenith distance of the radiant of these meteor showers.
Introduction
One of the largest meteor monitoring networks regarding the number of stations (130) and covered surface area (1.3 × 10^6 km^2) in the southern hemisphere is the Brazilian Meteor Observation Network (BRAMON). The idea for the creation of BRAMON occurred in 2007 during a regional meeting of Brazilian amateur astronomers (Amaral et al., 2018). In 2013, some of these citizen scientists contacted members of the European networks UKMON (“United Kingdom Meteor Observation Network”), CEMeNt (“Central European video Meteor Network”), and EDMONd (“European viDeo Meteor Observation Network”) to obtaining technical support for network implementation. BRAMON started operating with nine stations in the following year, and 23 cameras in 2015. Most stations are located in south-central Brazil, where the largest urban centers Rio de Janeiro and Sao Paulo are located, and the rest in the central, northeastern, and western regions of the country. The geographical disposition of the stations allowed the detection of meteors within a declination range between –90 and +70 degrees.
The stations are equipped with a TV camera capable of recording astrometric and photometric data from meteors, allowing the study of the dynamic and physical properties of the meteors. BRAMON recorded 26697 individual meteors registered at double or multiple stations, between August 2014 and February 2021, which could be identified with either 392 different meteor showers from the list of the International Astronomical Union Meteor Data Center (IAU MDC) or which were sporadic meteors.
I performed a comparison between the population index r of the alpha Capricornid (CAP #00001), eta Aquariid (ETA #00031), and Geminid (GEM #00004) meteor showers derived from this homogenous dynamic and photometric dataset obtained by BRAMON and from the Visual Meteor Database (VMDB) of the International Meteor Organization (IMO).
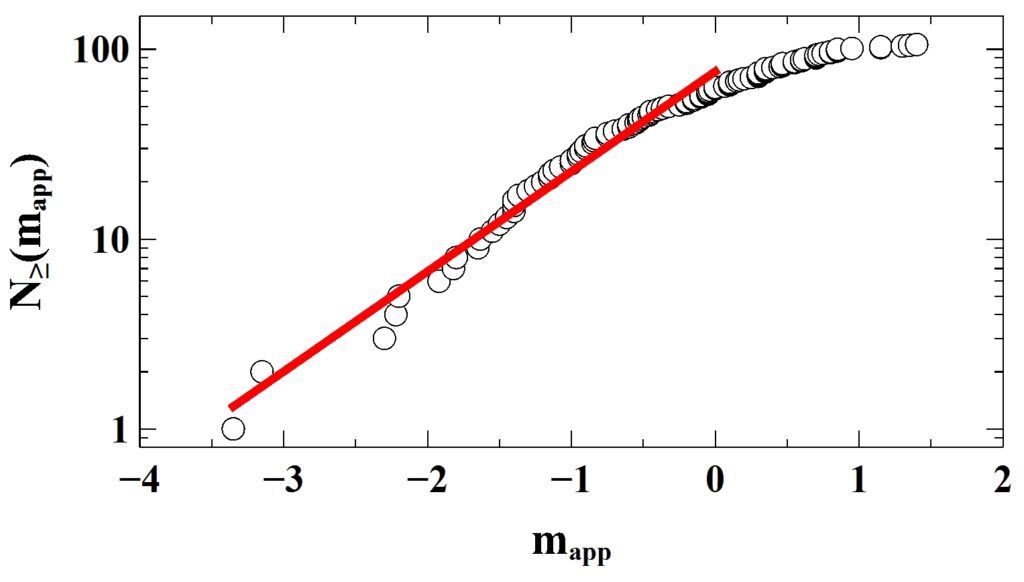
Figure 1 – Inverse cumulative distribution of the number of meteors as a function of the BRAMON apparent magnitude m_app of the eta Aquariid meteor shower observed in 2016. The observed distribution (circles) is modeled with Equation (1) (red line), with C = 76 ± 2 and r = 3.39 ± 0.08 for m_app ≤ 0.
Meteor magnitude distribution
The statistical analysis of physical parameters is a relevant source of knowledge about objects of the solar system. The observational bias introduced by instrumental limitations (telescope plus detector), data collection, or analysis methods can influence the observed distributions. The origin of some of these distributions is associated with long-range gravitational interactions, fragmentation, among other complex phenomena.
The cumulative distribution of meteor magnitudes M is usually modeled by an exponential function (Baggaley, 1977) as
where NM is the cumulative flux of meteors brighter than magnitudes M, C is a constant, and r is the population index. The population index r is the ratio between the total number of meteors observed with magnitude M to those seen with magnitude M + 1. Equation (1) asymptotically models the observed meteor magnitude distribution (Figure 1).
Table 1 – Population indexes for the alpha Capricornid (CAP #00001) meteor shower. ΔT (UT) = observational period, rBR = BRAMON population index, and rv = visual VMDB population index.
| Year | ΔT | rBR | rv |
| 2015 | Jul. 21.1–Aug. 04.2 | 3.24 ± 0.07 | 1.5 ± 0.1 |
| 2016 | Jul. 22.4–Aug. 07.3 | 2.07 ± 0.04 | 3.4 ± 0.5 |
| 2017 | Jul. 23.2–Aug. 06.3 | 1.95 ± 0.04 | 1.95 ± 0.04 |
| 2019 | Jul. 23.2–Aug. 05.1 | 1.66 ± 0.08 | 1.66 ± 0.08 |
| 2020 | Jul. 17.1–Aug. 07.1 | 3.24 ± 0.07 | 1.9 ± 0.2 |
The data
The main component of a meteor observation station is its camera whose efficiency is limited by its sensor, sky brightness, and detection software. A typical BRAMON station was equipped with a Samsung SCB 2000 camera, which uses a Sony Super HAD 1/3 CCD sensor, and is capable of registering light sources up to 0.05 lux in intensity. These cameras were modified having the infrared (IR) filter removed and were equipped with a Varifocal Ai 3–8mm Dc F1.0 Ltvr-3 lens. This lens provided a field of view (FOV) of ∼70 × 60 degrees for the shortest focal length. Between 2014 and 2015, the 23 BRAMON operators had 27 stations, 60% of which were located in small urban centers, with a low level of light pollution.
Table 2 – Population indexes for the eta Aquariid (ETA #00031) meteor shower.
| Year | ΔT | rBR | rv |
| 2016 | May 02.3 – May 27.3 | 3.39 ± 0.08 | 2.1 ± 0.1 |
| 2017 | Apr. 26.3 – May 16.3 | 3.80 ± 0.09 | 2.2 ± 0.2 |
| 2019 | Apr. 29.4 – May 16.3 | 3.5 ± 0.2 | 2.29 ± 0.05 |
| 2020 | Apr. 28.3 – May 29.4 | 4.41 ± 0.08 | 2.40 ± 0.06 |
BRAMON uses the UFOCAPTURE software to detect meteors. The software records the detection in an AVI video, with a typical duration of 0.2 s. All phases of the temporal evolution of the apparent magnitude of each meteor are recorded in these videos, which may allow the composition of light curves. The UFOCAPTURE software works in conjunction with the UFOANALYSER and UFOORBIT that transfers the recorded image data into more suitable data for studying meteors.
Table 3 – Population indexes for the Geminid (GEM #00004) meteor shower.
| Year | ΔT | rBR | rv |
| 2015 | Dec. 14.1 – Dec. 15.2 | 3.1 ± 0.2 | 2.6 ± 0.1 |
| 2016 | Dec. 13.0 – Dec. 15.3 | 3.8 ± 0.4 | 2.3 ± 0.1 |
| 2017 | Dec. 10.2 – Dec. 15.3 | 3.55 ± 0.08 | 2.35 ± 0.04 |
| 2019 | Dec. 08.1 – Dec. 15.3 | 2.7 ± 0.2 | 2.5 ± 0.2 |
I modeled observed cumulative apparent magnitude distributions using Equation (1). The parameters C and r were obtained by optimization, using the non-linear generalized reduced gradient for the line search. The optimum values of distribution parameters minimize the Pearson chi-square coefficient.
The annual population indexes r have been calculated for the alpha Capricornid (CAP #00001), eta Aquariid (ETA #00031), and Geminid (GEM #00004) meteor showers, considering the same observational period in BRAMON and in the VMDB for each year.
I used independent sample t-tests to compare the means of the population indexes derived from BRAMON and VMDB databases as a criterion for testing their similarity (“null hypothesis”). A large p-value (greater than confidence level α = 5 × 10^−2) indicates weak evidence against the null hypothesis.
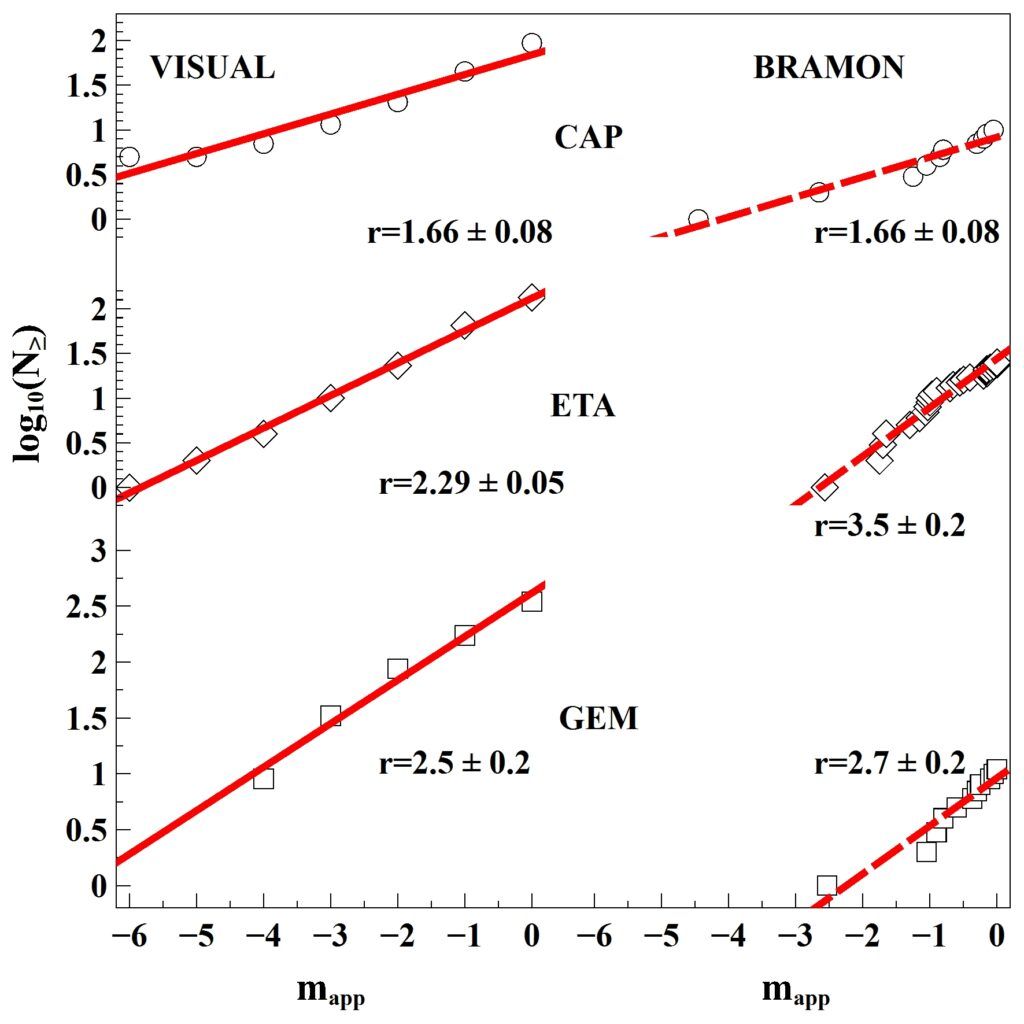
Figure 2 – Common logarithm of cumulative numerical distribution log10(N≥) of the apparent magnitudes m_app of the alpha Capricornid (CAP #00001), eta Aquariid (ETA #00031), and Geminid (GEM #00004) meteor showers observed by visual observers (VMDB) and BRAMON in 2019. The solid and dashed lines represent the adjustments of Equation (1) to the visual data and BRAMON for m_app ≤ 0. The population index r is indicated next to the corresponding meteor shower.
TV and visual derived population indexes r
The population indexes r have been estimated for the alpha Capricornid (CAP #00001), eta Aquariid (ETA #00031), and Geminid (GEM #00004) meteor showers, between 2015 and 2020, for the m_app ≤ 0 magnitude range (Figure 2). This magnitude range allows the detection of bright meteors, preventing limit magnitude lm restrictions between different observational sites.
The chi-square score suggests the same p-value ∼ 1 for the fitting of the Equation (1) to the observed cumulative distribution of apparent magnitudes.
I used the t-test to compare the mean visual and BRAMON population indexes of Tables 1 to 3. The mean visual r indexes of eta Aquariid (ETA #00031) and Geminid (GEM #00004) meteor showers are systematically lower than those obtained with BRAMON TV data (p-value = 3×10^−4 and 5×10^−3). However, the mean visual and TV population indexes of the alpha Capricornid (CAP #00001) meteors are similar (p-value=0.5). Brown et al. (1998) suggests that the visually determined flux is tilted towards brighter meteors due to differences between the detection probability of the visual and TV observational procedures, justifying the dissimilarity. Another hypothesis is the possible dependence of the observed rate of meteors on the zenith distance of the radiant at the different observational sites (Zvolankova, 1983).
The alpha Capricornid (CAP #00001), eta Aquariid (ETA #00031), and Geminid (GEM #00004) meteor showers had a median altitude of the radiant above the horizon hR of 65, 41 and 45 degrees respectively at the BRAMON observational sites in 2019.
The IMO VMDB observational campaign of the Geminid (GEM #00004) meteors in 2019 had 29 observers worldwide. From these, only five observers were from the southern hemisphere.
A similar zenith hourly rate (ZHR) could be presumably deducted by two distinctive observers with equal limiting magnitude lm, applying the correction F for obstructions in their field of view and the altitude of the radiant above the horizon sin(hR). An hourly rate (HR) between 0.5/h and 0.7/h for the alpha Capricornid meteor shower for BRAMON sites or for a typical observer in central Europe or in the USA, with latitude 40 degrees North, generates the same ZHR, and it is compatible with the mean population indexes, admitting F = 1 and lm = 0.
The eta Aquariid and Geminid meteor showers observed by BRAMON should have about 6% and 7% of the HR obtained by an observer from the northern hemisphere to generate the same ZHR. These estimates are reasonable compared to the HR estimated from the BRAMON and VMDB datasets for the eta Aquariid (0.06 × 0.8/h) and Geminid meteor showers (0.07 × 4.1/h) in 2019. The ratio between the observed BRAMON and VMDB hourly rate for the alpha Capricornid meteor shower is 10% lower than the initial estimate of 70%.
I conclude that population indexes r of alpha Capricornid (CAP #00001), eta Aquariid (ETA #00031), and Geminid (GEM #00004) meteor showers are influenced probably by a combination of the detection probability of the detector (human eye or CCD) and the zenith distance of the radiant of the meteor shower at the different observational sites.
Conclusions
The population indexes r of alpha Capricornid (CAP #00001), eta Aquariid (ETA #00031), and Geminid (GEM #00004) meteor showers are probably influenced by a combination of the detection probability between visual and TV observational procedures and the zenith distance of the radiant of the meteor showers at the different observational sites. These factors can imply that the mean activity indexes of eta Aquariid (ETA #00031) and Geminid (GEM #00004) meteor showers obtained from the BRAMON apparent magnitudes m_app ≤ 0 are systematically higher or equal to its equivalents obtained from IMO VMDB visual data.
Acknowledgment
The author thanks C. A. di Pietro and M. Zurita for kindly providing the BRAMON data.
References
Amaral L. S., Trindade L. S., Bella C. A. P. B., Zurita M. L. P. V., Poltronieri R. C., Silva G. G., Faria C. J. L., Jung C. F. and Koukal J. A. (2018). “Brazilian Meteor Observation Network: History of creation and first developments”. In, Marc Gyssens and Jean-Louis Rault, editors, Proceedings of the International Meteor Conference, Petnica, Serbia, 21–24 September, 2017. IMO, pages 171–175.
Baggaley W. J. (1977). “The mass distribution of large meteoroids”. Monthly Notices of the Royal Astronomical Society, 180, 89–93.
Brown P., Simek M., Jones J., Arlt R., Hocking W. and Beech M. (1998). “Observations of the 1996 Leonid meteor shower by radar, visual and video techniques”. Monthly Notices of the Royal Astronomical Society, 300, 244–250.
Zvolankova J. (1983). “Dependence of the observed rate of meteors on the zenith distance of the radiant”. Bulletin of the Astronomical Institutes of Czechoslovakia, 34, 122–128.
