Abstract: The meteor map is an online tool for visualizing meteor cameras and ground tracks of observed meteors. It has been online since January 2021. In this article, I introduce some of the lesser-known features.
Introduction
When I first built a meteor camera in December 2020, I was surprised that there was no easy way to visualize ground tracks of meteors, even though coordinates in the form of latitude/longitude pairs were readily available. So, I decided to build this visualization tool myself, using off-the-shelf software as much as possible, the main libraries used are Leaflet for the map, Leaflet-omnivore for KML files, Papa Parse for parsing data, and Tabulator for presenting, sorting and filtering data.
The meteor map was quickly adopted and is now featured on the front page of the websites of both the Global Meteor Network and CAMS. The URL of the meteor map is: https://tammojan.github.io/meteormap.
Main features
The meteor map can visualize data from both the CAMS network (Jenniskens et al., 2011) and the Global Meteor Network (GMN, Vida et al., 2021).
User interface
After the meteor map has loaded (this can take quite some time, as the datasets of GMN can be around 20 MB), a map with meteors is presented. The user interface of the meteor map is shown in Figure 1.
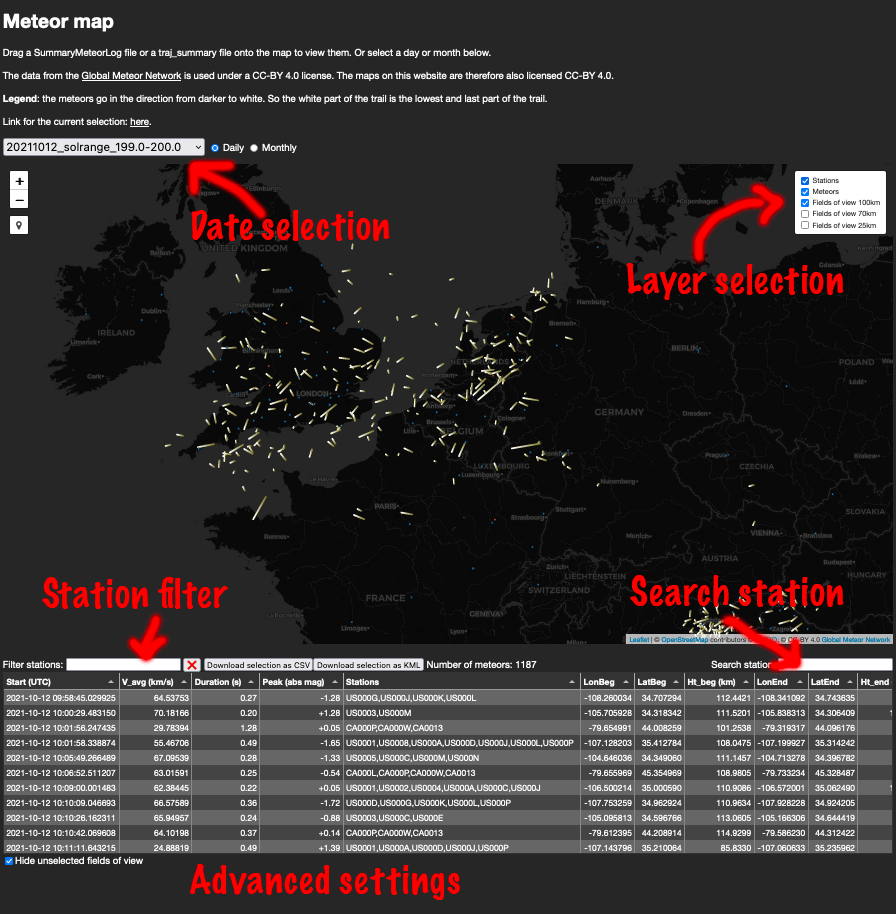
Figure 1 – Interface of the meteor map.
Stations and fields of view
Since the data of the GMN is online, the meteor map can readily access it, either in monthly or in daily batches. As a user, you only need to select a day or a month, and the data is automatically loaded from the GMN to the map. The same thing is possible for certain days of CAMS, and for monthly logs from the 2010–2016 CAMS data release (Jenniskens et al., 2018). To view the CAMS map, visit the URL tammojan.github.io/meteormap?cams, i.e. append “?cams” to the URL.
Finally, it is also possible to drag and drop a compatible local file with orbits onto the map. The file should be in the format of the SummaryMeteorLog.txt files produced by the CAMS tool ‘Coincidence’.
Station locations are shown in the map, where a random offset of about 2km is added to every station for privacy reasons. For the GMN, the stations are pulled from the central GMN sftp server, and the station names are pulled from IstraStream. For CAMS the station locations are obtained from the network coordinators (currently only in the CAMS BeNeLux). The same holds for field of view information.
To locate a certain station ID, type that ID in the ‘Search station’ box in the bottom right below the map. The map will then center on that station.
Right clicking on an RMS station shows links to data of that station on IstraStream.
Inspecting and filtering meteors
A typical use case for the meteor map is to see which meteors are detected by a certain station. This can be done in the station filter. E.g., filtering with NL000D will only show meteors detected (also) by my station.
Partial matches are accepted, so filtering on “NL” will show detections from all Dutch stations. Combining multiple stations can be done with a comma, e.g. “NL,BE,DE” will show detections with Dutch, Belgian or German stations. If instead of a comma a semicolon is used, only detections are selected in which all of the stations are involved. E.g. “NL;DE” will select meteors with at least one Dutch and at least one German station involved.
If a nice view is selected in the meteor map, the permanent link shown at the top of the page can be used to save that view or share it with others.
To look for interesting meteors, the table below the map can be sorted on for example the duration, peak magnitude or height of the meteor (to keep the table clear, only a subset of the available columns is shown). Sorting on the ‘stations’ column will sort on the number of stations involved in the detection.
When a meteor is selected in the table, it is highlighted on the map.
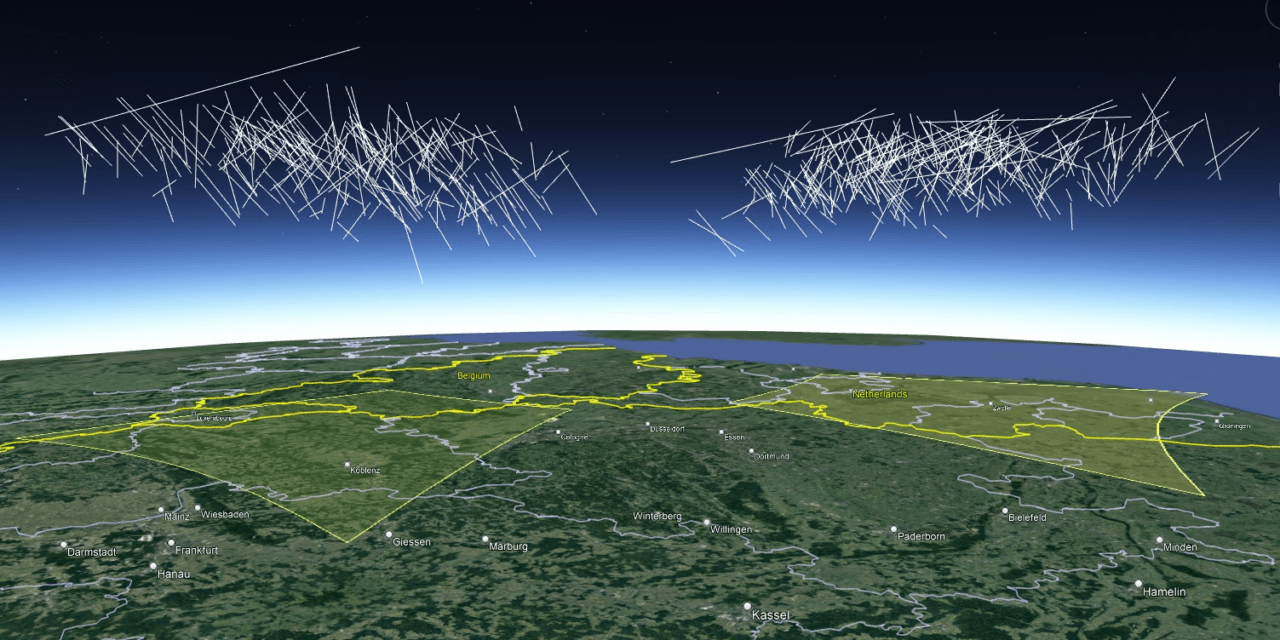
The (possibly filtered) table with meteor data can be downloaded as a comma-separated file for inspection in, for example, Excel. It can also be downloaded as a KML file, which can be opened in Google Earth Pro. When viewing meteors in Google Earth, also the height dimension can be inspected visually, see Figure 2. To show this 3D map in Google Earth, hold “Ctrl” (or Command on a Mac) and drag the mouse down.
Planning camera placement
The meteor map can be used to spot areas in the sky that are not well covered by existing cameras. With this knowledge, new cameras can be placed strategically. The meteor map for GMN now contains fields of view at 100km, 50km and 25km above the ground. Obviously, the coverage decreases at lower altitudes.
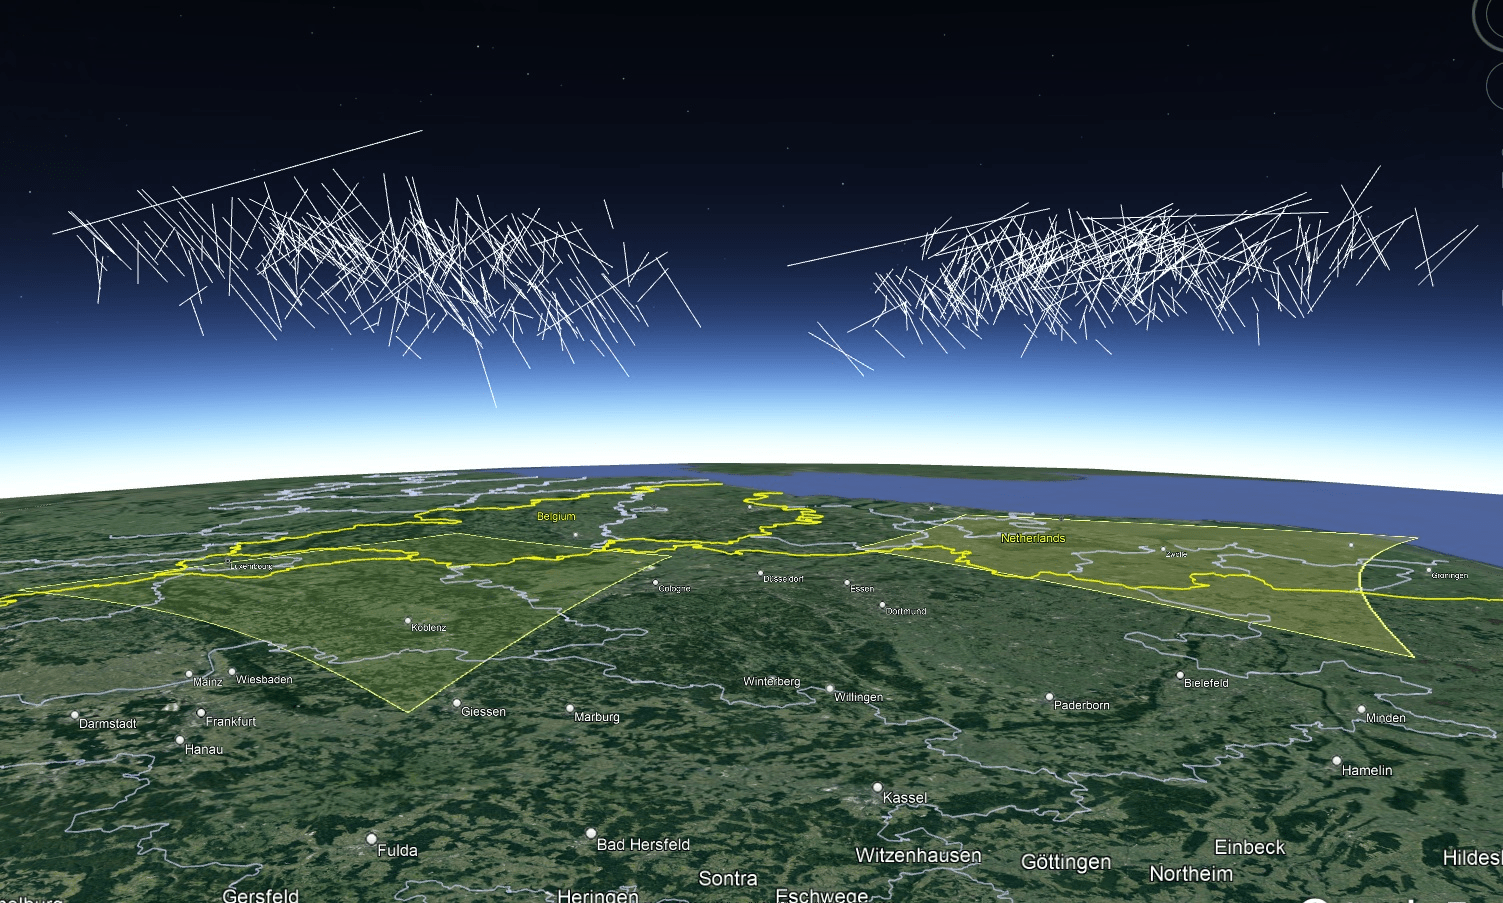
Figure 2 – Export from the meteor map shown in Google Earth. In this image all trajectories are shown, obtained by BE0002 (right) and BE0004 (left) during October 2021. The camerafields were added in Google Earth projected on the ground to locate the position.
When clicking on the meteor map (not on a meteor), the cameras whose field of view contains that point are selected. This can help to predict with which stations simultaneous detections can be expected.
It is also informative to view the field of view of a station, along with a lot of detections of this station. The example in Figure 3 shows that for station UK0029, almost the entire field of view at 100km is also covered by other cameras. These kinds of maps are best made with Perseids or Geminids data.
For making this map, I enabled the new option (in the advanced options, below the table) to hide the fields of view of stations that are not selected.
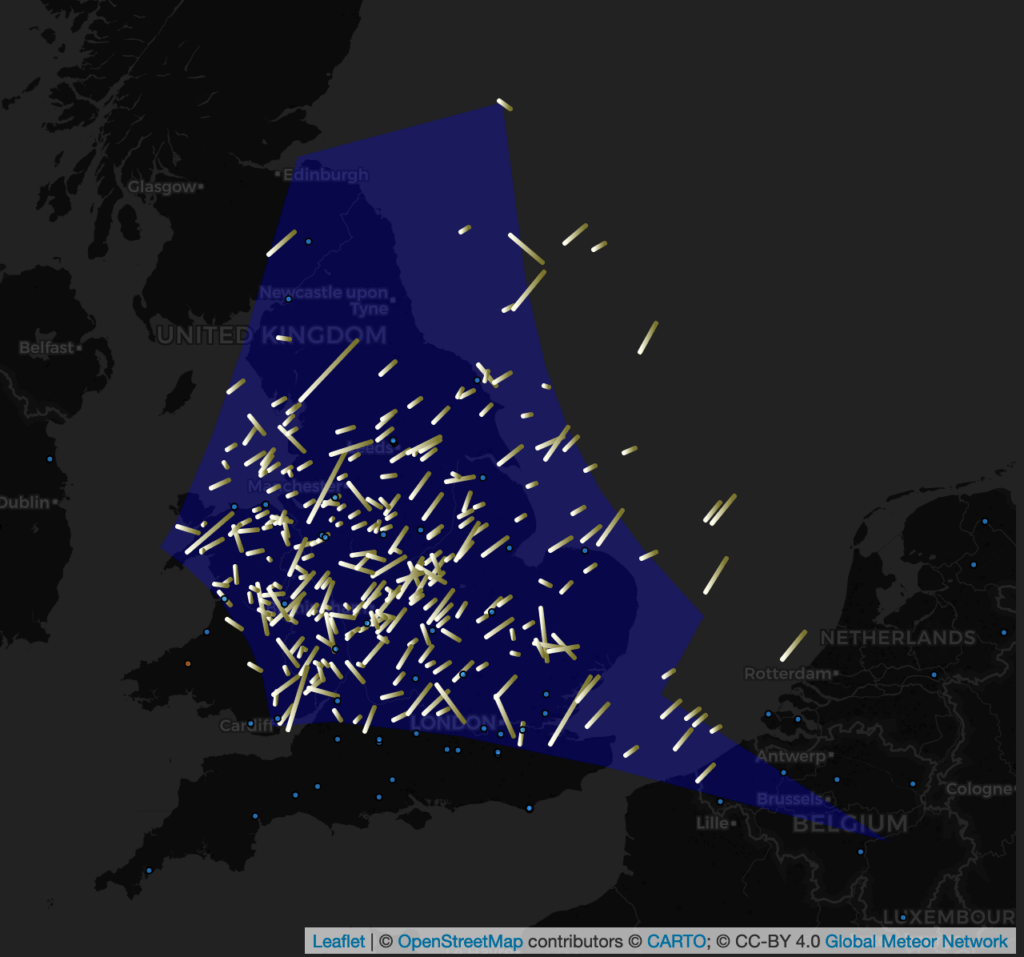
Figure 3 – Field of view of UK0029 with August 2021 meteors.
Creating a year overview
With the publicly available data from the GMN, it’s quite easy to make an overview of all meteors recorded from a certain station. To this extent, it is necessary to download all 2021 data files from the GMN data site to your local machine, and concatenating them into one file with the header and only the relevant orbits.
This can be done with a plain text editor like Notepad. On a Mac or Linux machine, it can be done by running the following few shell commands in the directory where the data files reside:
# Create header
head -n 4 traj_summary*_202101.txt > NL000D_2021.txt
# Add all lines containing my station NL000D
for traj in traj_summary_monthly_*.txt; do
grep NL000D ${traj} >> NL000D_2021.txt
done
Dragging the resulting file NL000D_2021.txt onto the meteor map created Figure 4.
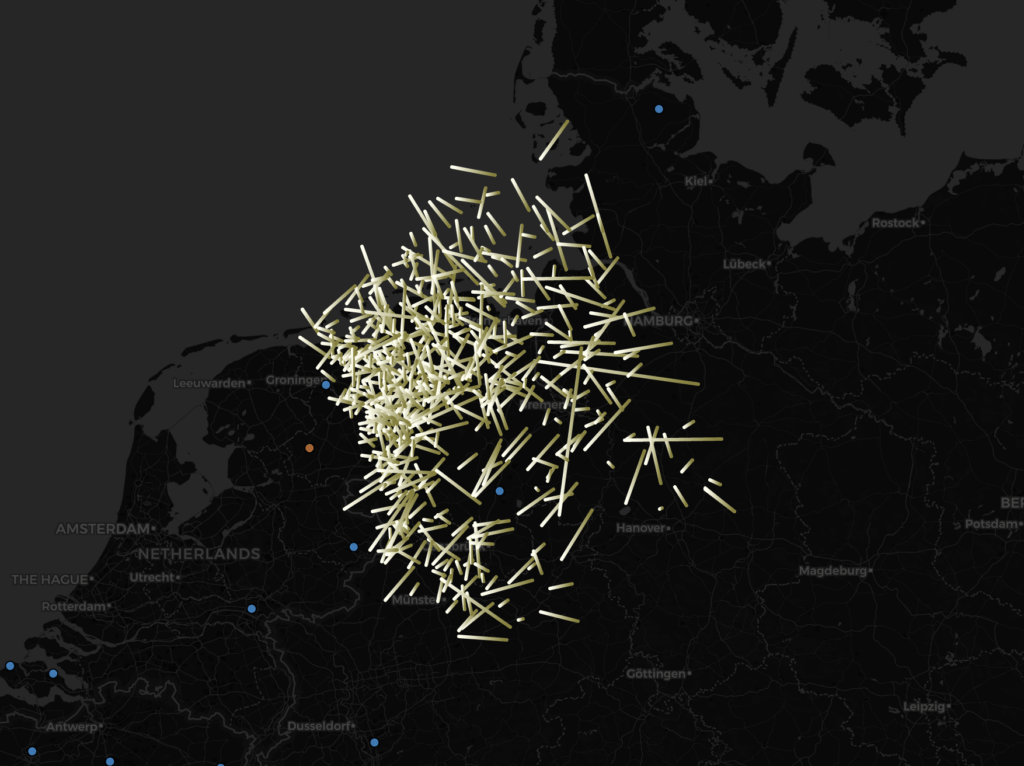
Figure 4 – All meteors that my station NL000D detected in 2021 as part of the Global Meteor Network.
Help welcome!
The source code of the meteor map is available at Github. The full code of the map itself is in one html file, but the repository also hosts the camera location files.
The meteor map started as (and still is) a side project, for which I do not have a lot of time available. But if you spot a bug or missing feature, please do report it at the issue tracker at Github. Or better even, implement the fix or feature, and create a pull request.
Features that are high on my wish list are an update to the style sheet, so that the table and map can be inspected more easily on mobile devices. Also, in the future it would be good to store the trajectories in a database with a spatial index, so that only the visible trajectories need to be loaded. This would make browsing meteors a lot faster.
Conclusion
The meteor map is a nice tool to visualize the Earth-facing view of the pipeline results of the Global Meteor Network and CAMS.
References
Jenniskens P., Baggaley J., Crumpton I., Aldous P., Pokorny P., Janches D., Gural P. S., Samuels D., Albers J., Howell A., Johannink C., Breukers M., Odeh M., Moskovitz N., Collison J., Ganju S. (2018). “A survey of southern hemisphere meteor showers”. Planetary Space Science, 154, 21–29.
Jenniskens P., Gural P. S., Grigsby B., Dynneson L., Koop M. and Holman D. (2011). “CAMS: Cameras for Allsky Meteor Surveillance to validate minor meteor showers”. Icarus, 216, 40–61.
Vida D., Šegon D., Gural P. S., Brown P. G., McIntyre M. J. M., Dijkema T. J., Pavletić L., Kukić P., Mazur M. J., Eschman P., Roggemans P., Merlak A., Zubrović D. (2021). (2021). “The Global Meteor Network – Methodology and first results”. Monthly Notices of the Royal Astronomical Society, 506, 5046–5074.


I’ve just discovered the information you provide for each station’s nightly observations by simply right clicking on the station in the meteor map. Fantastic! I’ve just now got to learn what it all means. Some I understand already, but I will gradually go through your descriptions and hopefully learn more. I’m planning to setup another station about 90 km away which will overlap with my current one.
Thanks,
Bob NZ0003
Hi Tammo Jan, I see there are no meteors depicted for the CAMS stations in Namibia and South Africa. Can they be included?
Hi, I have a camera on the GMN network in Spain and look at the Istrastream data each day. If I compare the meteor counts on this system with the ones you show for my camera on your site, they differ quite significantly. Do you do any further processing on the meteor data from GMN to get your figures? Can you shed any light as to why they figures are different?
At the Istrastream data you will see the number of detections, including false detections. On the Meteormap only those detections that are real meteors and which could be paired with data from other cameras for triangulation will be shown. Not all meteors get detected from another site and not all meteors that are registered at another site have suitable geometrics to allow a good triangulation. On MeteorMap you find only those meteor trails that produced a reliable trajectory. This is why for a science project like this many cameras are required at many sites in order to get enough good quality triangulations.
Thanks Paul, much appreciated.