Koen Miskotte (Dutch Meteor Society), Hirofumi Sugimoto (The Nippon Meteor Society) and Pierre Martin (Ottawa, Canada).
Abstract
An unexpected Perseid outburst was observed over the North American continent on August 14, 2021 (Jenniskens and Miskotte, 2021; Jenniskens, 2021). This event was observed by visual- and radio observers. Also, the North American CAMS and AllSky 7 networks recorded the outburst. In this article we present the results of the visual- and radio observations.
1 Past years observations
2018
During the night of 2018 August 13–14 meteor observers witnessed a rich Perseid display above Europe, 24 hours after the annual maximum of the Perseids (Vandeputte, 2019; Gaarder, 2018). An analysis based on European data received by the IMO shows that there was a peak in activity profile (Miskotte, 2019). The night started with normal ZHRs around 50 but gradually a maximum ZHR of 85 was reached around λʘ = 140.935° (August 14, 2021 at 00h14m UT), followed by a slow decline in ZHR to normal values at the end of the night (see Figure 1). This outburst featured a normal population index r of 2.1–2.2. The peak was less visible in the IMO on-the-fly graph, but relatively high ZHRs were achieved. This difference can be explained by the use of other parameters for the IMO on-the-fly graphs, such as, for example, limiting magnitude. Unfortunately, this peak could not be found in the radio data from RMOB (Figure 2).
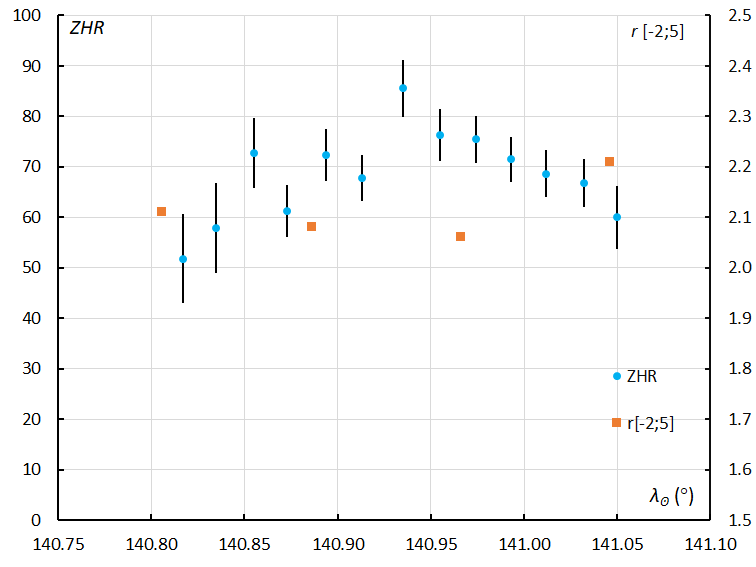
Figure 1 – The Perseid outburst of August 13–14, 2018 as observed visually above Europe.
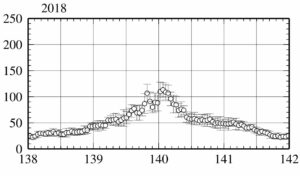
Figure 2 – The Perseid ZHRr in 2018, based on radio observations (RMOB). No additional activity observed after the annual Perseid maximum.
2019
Also in 2019, an unexpected peak in activity around λʘ = 141.02° has been reported (Miskotte and Vandeputte, 2020). Radio Meteor Observations captured this small outburst. The estimated ZHRr was 82 ± 13 at λʘ = 141.02° (August 14, 2019 8h30m UT), see also Figures 3 and 4. The 2019 peak was best visible over the Atlantic Ocean and eastern North America. Unfortunately, the peak was not well observed visually, only meteor observer Bruce McCurdy was able to make some observations around the time of maximum. His observations suffered a lot from smoke from the large wildfires that were raging at the time. Still, his observational data shows a peak at the same solar longitude as the radio observations. That peak is much lower than the radio peak, the difference is most likely caused by the large amount of smoke that caused lower limiting magnitudes and a greater atmospheric extinction (Figure 4). The start of the outburst might have been observed from Western Europe just at dusk by visual observers. This was mainly characterized by the appearance of relatively many bright Perseids. Radio observers also noticed this clearly with an increase in prolonged radio reflections around that period.
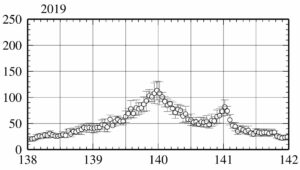
Figure 3 – The ZHRr curve of the Perseids 2019 based on radio data from RMOB.
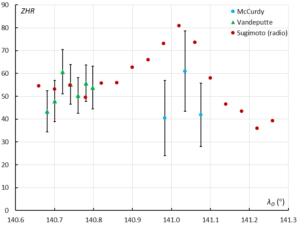
Figure 4 – Comparison of the visual ZHR and the radio estimated ZHRr during the August 14, 2019 Perseid outburst. At the last ZHR point obtained by Michel Vandeputte (VANMC) many bright Perseids appeared.
2020
It was the Belgian radio observer Felix Verbelen who first reported via the VVS mailing list that he recorded many long-lasting reflections of the Perseids on August 14. The unexpected peak occurred at λʘ = 140.77° (2021 August 13, 8h30m UT) with a ZHRr = 89 based on radio data from RMOB.
It was visual meteor observer Paul Jones of the ACAC in Florida who was able to visually confirm the outburst, he wrote: “WOW!!!! We had a very good Perseid display for an hour and a half for the ages this morning (8/13/20) from the Fairgrounds despite the clouds!! We had at least SIX Perseid fireballs and over twenty in all brighter than zero magnitude!”. Unfortunately, it was not possible for Paul Jones to make serious observations due to a rapidly changing cloud cover. An analysis by the first author appeared in Radiant and MeteorNews (Miskotte, 2020). Only much later it became clear that this outburst had been observed visually by the Canadian meteor observer Pierre Martin (Miskotte, 2021). He was the only one who observed this outburst visually under good conditions.
Pierre Martin observed multiple peaks at λʘ = 140.632° (2020 August 13, 05h00m UT), λʘ = 140.710° (2020 August 13, 07h00m UT and λʘ = 140.765° (2020 August 13, 08h20m UT), with maximum ZHRs between 80 and 90. The ZHR graph looked very different than the graphs of the 2018 and 2019 outbursts (see Figure 6). The outburst was characterized by a relatively large number of bright Perseids at the start of the observations, later on with increasing population index r values. It is also striking that these 3 peaks appeared much earlier in solar longitude than the peaks from 2018 and 2019.
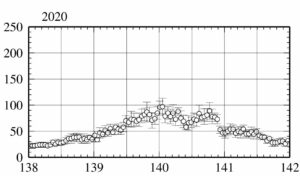
Figure 5 – The Perseid ZHRr in 2020 based on radio observations collected by RMOB.
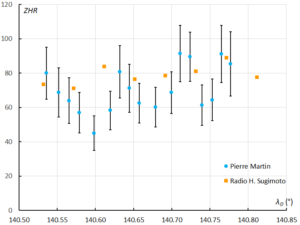
Figure 6 – Comparison between the visual ZHR and the radio estimated ZHRr based on radio observations during 13–14 August 2020.
2 The big Perseid outburst of 2021
Saturday afternoon, August 14, around 2 pm, the first author received a striking message from the Canadian meteor observer Pierre Martin. He wrote: “I just witnessed very strong Perseid activity August 13–14, 06h–09h UT. Multiples Perseids per minute with many bursts. Sometimes 3-4 in a second. Much busier than previous night but I had a great sky mag 6.7. Was this an unexpected outburst? I’ve never seen so many Perseids a full day after the normal peak. I think the rate might have been as high as 300/hr but I’ll know more when I listen to the tape. Average brightness, perhaps a bit below average. There was a very large number of mag 4 and 5 meteors but still good numbers of +1s and 0s. Brightest we’re –3”.
His highest 10-minute count was 42 Perseids with a radiant elevation of 61 degrees. Pierre made his observations from Westmeath Lookout, a dark site 80 km northwest of Ottawa, Canada. It appears to be the highest Perseid ZHR since the multiple outbursts during the night of 2016 August 11–12. On H. Sugimoto’s website there was a significant peak in activity around λʘ = 141.500° with a ZHR well above 200 An initial analysis of Pierre Martin’s data soon led to a publication in Meteornews (Jenniskens and Miskotte, 2021) and in CBET (Jenniskens, 2021).
CAMS
Based on data of the CAMS networks in Texas and California Peter Jenniskens found a maximum at λʘ = 141.474 ± 0.005° with a ZHR of 130 ± 20 on top of the annual activity (ZHR 45). The Full-Width-at-Half-Maximum of the fitted Lorentzian profile is 0.08 ± 0.01 degrees solar longitude. The peak occurred λʘ = 141.474 ± 0.005° (equinox J2000.0), corresponding to 8.2h UTC on August 14.
Radio observations: Estimated Zenithal Hourly Rate
Figure 7 shows the estimated Zenithal Hourly Rate (ZHRr) using data of 37 stations in nine countries (Sugimoto, 2017). The unexpected peak was recorded at λʘ = 141.49° (August 14, 8h UT) as ZHRr = 219 ± 24.
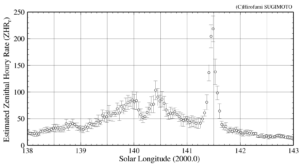
Figure 7 – The estimated ZHRr of Perseids 2021 based on radio observations collected by RMOB.
Table 1 – The estimated Zenithal Hourly Rate (ZHRr) around the outburst peak. λʘ is the Solar Longitude (2000.0), N is the number of analyzed data entries.
|
Time (UT) |
λʘ (°) |
N |
ZHRr |
|
|
August 14, 2h |
141.249 |
11 |
41 ± 9 |
|
|
August 14, 3h |
141.289 |
10 |
49 ± 5 |
|
|
August 14, 4h |
141.329 |
10 |
61 ± 6 |
|
|
August 14, 5h |
141.369 |
10 |
81 ± 14 |
|
|
August 14, 6h |
141.409 |
10 |
136 ± 15 |
|
|
August 14, 7h |
141.449 |
15 |
205 ± 22 |
|
|
August 14, 8h |
141.489 |
20 |
219 ± 24 |
|
|
August 14, 9h |
141.529 |
12 |
138 ± 24 |
|
|
August 14, 10h |
141.569 |
9 |
98 ± 13 |
|
|
August 14, 11h |
141.609 |
8 |
64 ± 14 |
|
|
August 14, 12h |
141.649 |
11 |
39 ± 6 |
|
|
August 14, 13h |
141.689 |
9 |
35 ± 6 |
|
|
August 14, 14h |
141.729 |
11 |
41 ± 9 |
|
Figure 8 shows the detailed activity for 10-minutes intervals by using four stations. The strong outburst began at λʘ = 141.3° (2021 August 14, 3h30m UT) and the strong increase was clearly over at λʘ = 141.42° (August 14, 6h40m). The peak was observed at λʘ = 141.479° (August 14, 8h15m UT) with an estimated ZHRr = 269 ± 6. The decreasing of the activity started after λʘ = 141.492° (August 14, 8h35m UT).
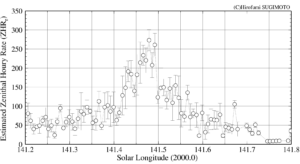
Figure 8 – A detailed estimated ZHRr curve for the Perseids 2021, based on radio observations from Jochen Richert (Switzerland), Istvan Tepliczky (Hungary), Felix Verbelen (Belgium) and Giuseppe Massimo Bertani (Italy).
3 Visual ZHR analysis
Using the visual observations of Pierre Martin, the first author obtained a provisionally determined maximum ZHR of 205 ± 20 (population index r based on CAMS data, this was r = 3.2). The ZHR is slightly higher than the ZHR based on CAMS data and somewhat lower than the ZHR based on radio observations. Six observers have observed the outburst, in addition to Pierre Martin, these were Robert Lunsford (California US, only the last part of the outburst), Terrence Ross (Texas, US), Gabriel Hickel (Brazil), Bruce McCurdy (Canada) and Paul Martsching (Iowa, US). Terrence Ross’ observation around the maximum is also impressive: he counted 20 Perseids in 7 minutes with limiting magnitude 6.2 and a radiant height of only 38 degrees! Unfortunately, the observations of Bruce McCurdy and Gabriel Hickel do not meet the requirements for a good observational set (too low limiting magnitudes and/or too high coverage of clouds). McCurdy’s observations unfortunately had too low limiting magnitudes caused by smoke from distant wildfires, just like in 2019. Using the data of the observers Lunsford, Martin, Martsching and Ross, both population index r and ZHR could be calculated.
Population index r
To calculate the population index r, we first checked whether the observational data meets certain requirements, which are:
- The limiting magnitude must be, rounded off, at least 5.9.
- The difference between the limiting magnitude and the average magnitude of the meteors should not exceed 4 magnitudes.
Most of the data was satisfactory. For the analysis of the population index r, 636 Perseids could be used. The results are shown in Table 2 and Figure 9.
Table 2 – The population index r for the Perseids 2021 August 14, between 05h50m en 11h47m UT.
|
Period |
Timem |
λʘ (°) |
r [–2;+5] |
± |
r [–1;+5] |
± |
|
05h50m–07h00m |
6.42 |
141.405 |
2.29 |
0.28 |
2.55 |
0.28 |
|
07h00m–08h00m |
7.50 |
141.448 |
2.39 |
0.15 |
2.54 |
0.15 |
|
08h00m–09h00m |
8.50 |
141.488 |
2.55 |
0.13 |
2.62 |
0.13 |
|
09h00m–10h10m |
9.58 |
141.532 |
– |
– |
3.09 |
0.19 |
|
10h45m–11h47m |
11.27 |
141.599 |
– |
– |
2.66 |
0.47 |
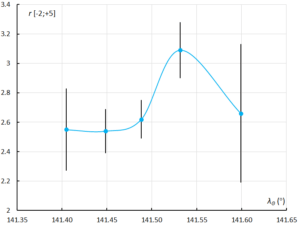
Figure 9 – Population index r Perseids August 14, between 05h50m and 11h47m UT.
Zenithal Hourly Rate
As with the determination of the population index r, the observational data must meet certain requirements for the ZHR calculations. These criteria are:
- The limiting magnitude lm, rounded off, had to be minimum 5.9 or better;
- The radiant elevation h has to be at least 25 degrees or higher;
- 15–20-minute counts were used for this analysis. Shorter consecutive counting periods were added together. Short isolated periods were not used;
- A known Cp was used or calculated for all observers whose data has been included in this analysis;
- Extreme outliers were removed.
A total of 831 Perseids were used in this ZHR analysis. The results of the calculations are shown in Table 3 and Figure 10. To calculate the ZHR we use the formula:
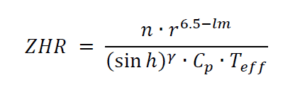
The zenith exponent γ has been taken equal to 1.0. The above calculated population index r [–1;+5] was used for the ZHR calculations.
Table 3 – ZHR values based on visual observations of the Perseids 2021 August 14, between 05h and 12h UT.
|
Hour UT |
λʘ (°) |
N |
PER |
ZHR |
± |
|
5.38 |
141.363 |
1 |
4 |
58.1 |
29.1 |
|
5.82 |
141.381 |
3 |
19 |
51.5 |
11.8 |
|
6.01 |
141.389 |
4 |
28 |
49.2 |
9.3 |
|
6.27 |
141.399 |
5 |
47 |
55.8 |
8.1 |
|
6.48 |
141.408 |
5 |
66 |
79.2 |
9.7 |
|
6.63 |
141.413 |
2 |
30 |
93.7 |
17.1 |
|
7.10 |
141.433 |
2 |
35 |
102.4 |
17.3 |
|
7.23 |
141.438 |
5 |
161 |
137.3 |
10.8 |
|
7.47 |
141.447 |
6 |
180 |
157.6 |
11.7 |
|
7.73 |
141.456 |
5 |
154 |
162.4 |
13.1 |
|
8.03 |
141.469 |
5 |
174 |
171.1 |
13.0 |
|
8.25 |
141.478 |
6 |
180 |
176.0 |
13.1 |
|
8.51 |
141.489 |
7 |
157 |
194.8 |
15.5 |
|
8.72 |
141.497 |
7 |
131 |
179.7 |
15.7 |
|
8.98 |
141.507 |
5 |
84 |
162.5 |
17.7 |
|
9.26 |
141.519 |
4 |
62 |
157.9 |
20.1 |
|
9.50 |
141.529 |
5 |
56 |
116.2 |
15.5 |
|
9.68 |
141.535 |
4 |
50 |
103.5 |
14.6 |
|
9.93 |
141.546 |
1 |
17 |
95.3 |
23.1 |
|
11.00 |
141.588 |
2 |
17 |
64.0 |
15.5 |
|
11.25 |
141.598 |
2 |
14 |
51.0 |
13.6 |
|
11.51 |
141.609 |
2 |
11 |
39.0 |
11.8 |
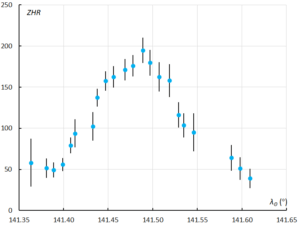
Figure 10 – ZHR values based on visual observations of the Perseids 2021 August 14, between 05h and 12h UT.
From these observations we calculated a maximum ZHR of 195 ± 15 at λʘ = 141.489°. This is very close to the values found by CAMS and radio observations. Assuming a normal ZHR of 45 around this solar longitude, the extra activity due to the passage through this dust trail corresponds to a ZHR 140, in good agreement with the results based on CAMS, finding an extra ZHR of 130. In Figure 11 we see the ZHR curve combined with the population index r [–1;+5]. This shows that the maximum consisted mainly of weak Perseids of +3, +4 and +5. At that moment, the r value was much higher than in the hours before and after the outburst.
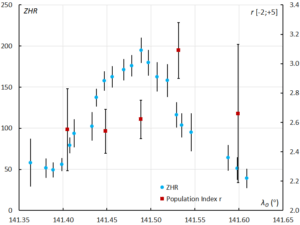
Figure 11 – Combined ZHR and population index r curve Perseids 2021 based on visual observations.
Photographic ZHR for the Perseids
Meteor observer Pierre Martin also used a camera during the Perseids outburst. The camera was a Canon 6D in combination with a Rokinon 14 mm F2.8 lens. The camera was set to iso 6400- and 20-seconds exposure time. The camera worked completely automatically for the rest of the night. Between 06h50m and 09h00m UT the camera took 364 continuous exposures on which 282 meteors were found. These images were also the base for the magnificent composite image made by Pierre (Figure 12).
Pierre also supplied a list with the number of Perseids per image with a time indication. To determine the photographic ZHR, the 20-second counts were summed to 15-minute counts. This way a ZHR determination was made every ten minutes in partially overlapping periods. Determining a photographic ZHR is only possible if the weather conditions remain exact the same. That means no clouds, haze, fog, moonlight or emerging twilight. The camera must be pointed exactly at the same point during the entire period (unguided) and settings may not be adjusted.
ZHR values may have been slightly higher after 8h10m UT due to a minimal increasing twilight. Corrections have only been made for radiant height and not for Cp, population index r and limiting magnitude lm. The purpose of this ZHR determination was not so much to determine the ZHR but more to see where the maximum photographically took place. The photographic maximum occurred at at λʘ = 141.470° very close to the time of the visual and radio maxima. See also Figure 11.
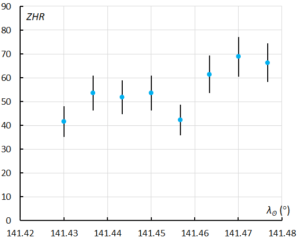
Figure 13 – The photographic ZHR for the Perseid outburst of 2021 August 14.
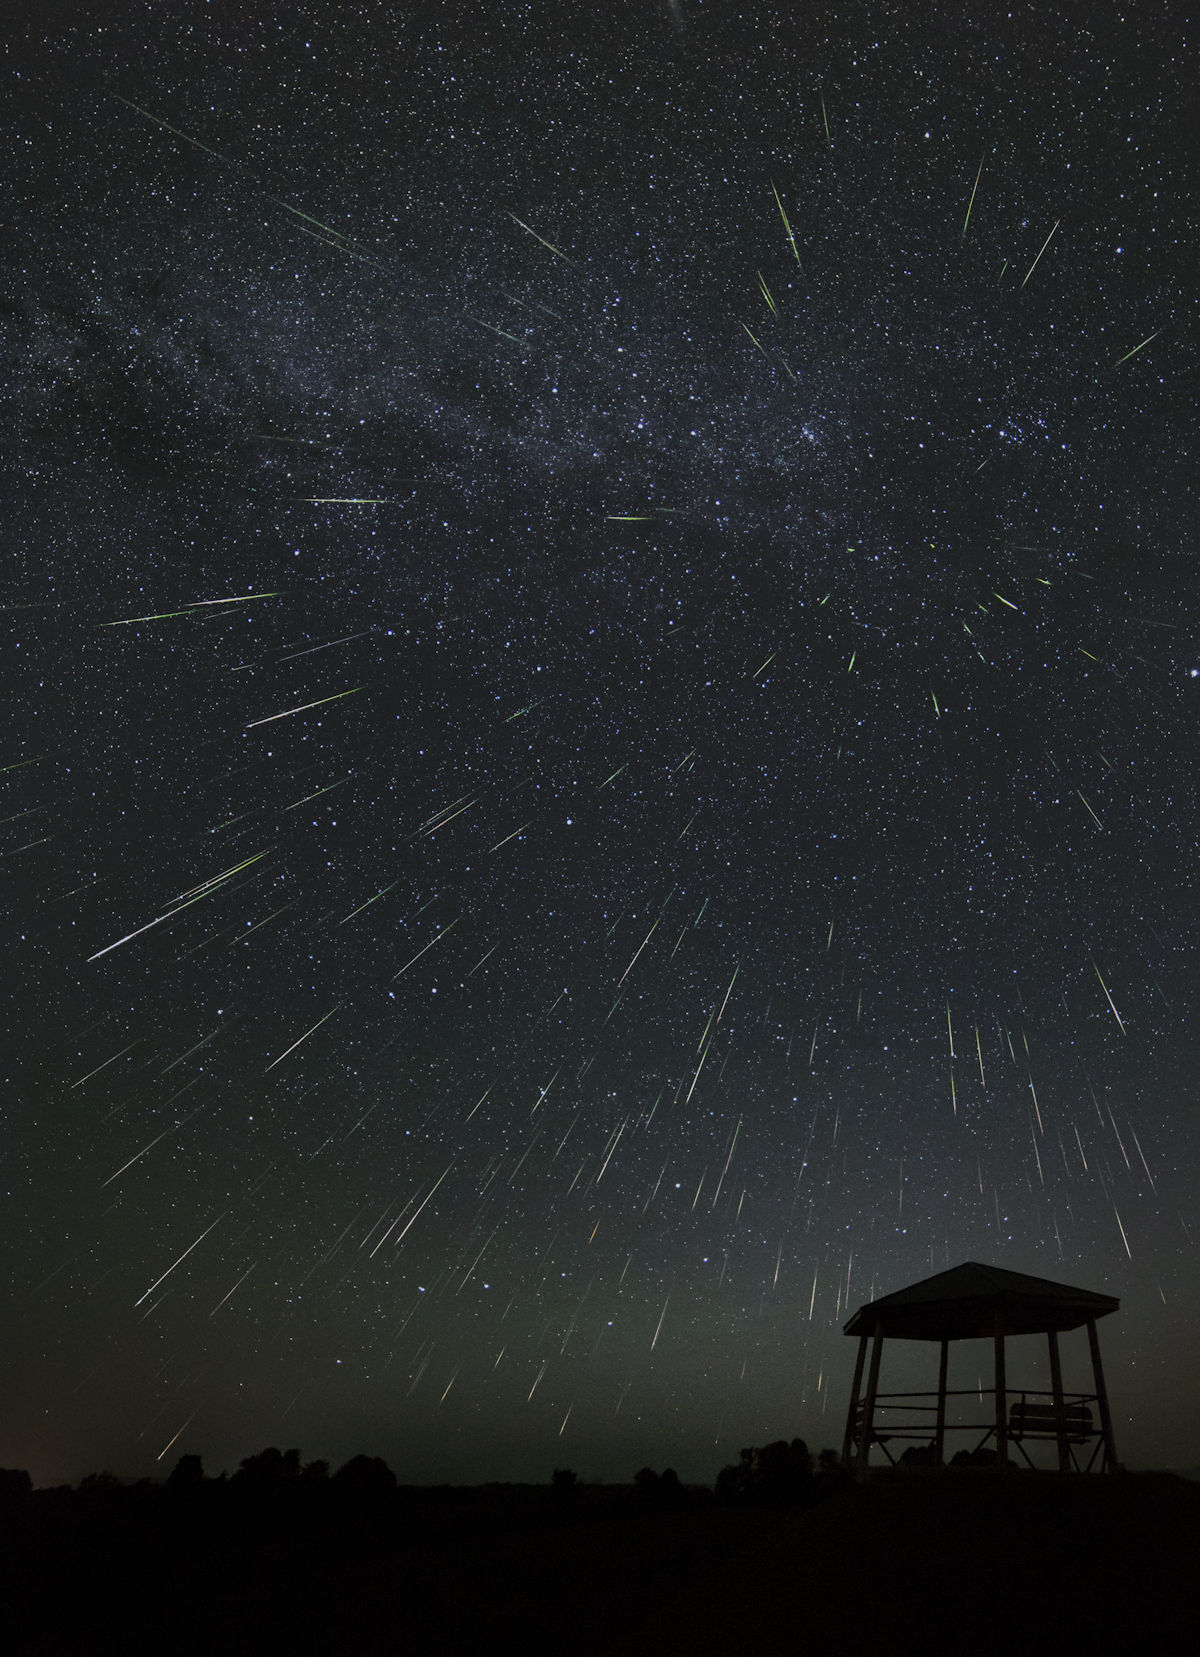
Figure 12 – A magnificent composite image of the 2021 Perseid outburst on August 14 made by Pierre Martin at Westmeath Lookout, Ontario in Canada. Between 06h50m and 09h00m UT the camera took 364 continuous exposures on which 282 meteors were found (courtesy Pierre Martin).
Comparison between the visual ZHR and radio estimated ZHRr’s
Figure 14 was created from Tables 1 and 3, this graph shows both the radio estimated ZHRr and the visual ZHR observations. How the radio estimated ZHRr is determined is described in Sugimoto (2017). The excellent agreement between the two graphs is remarkable. It seems that with the Perseids it is quite possible to make comparisons between these two very different methods of observation. The ZHRr’s based on radio observations are slightly higher, but the characteristics of both curves are almost the same. It is possible that the higher ZHRr was caused by other minor showers or different characteristics between radio and visual observing such as the observed portion of the sky and the limiting magnitude. The numbers of meteors observed with radio observations depend on several factors for example, the used radio frequency, the speed and size of the meteoroid, etc.
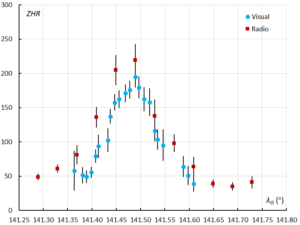
Figure 14 – Comparison of the visual ZHR and estimated radio ZHRr.
Since Pierre Martin had the best conditions during his observations (high transparency and limiting magnitude 6.65), we also compared his calculated visual ZHR based on 10-minute counts, with the radio estimated ZHRr based on 10-minute counts. The result is shown in Figure 15. Both methods find higher ZHRs and exact the same peak times. Just like in Figure 14, the radio estimated ZHRr is about 10–15% higher.
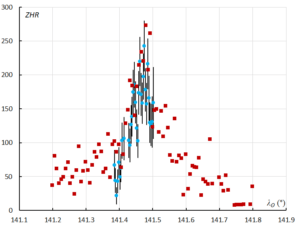
Figure 15 – Visual ZHR based on 10 minute counts from Pierre Martin (blue dots) compared with the radio estimated ZHRr (orange dots) based on 10 minute counts of radio observations.
4 Discussion
It is difficult to determine from this dataset which structure (dust trail?) is responsible for this strong outburst. Is it the same structure that has started to cross the Earth’s orbit since 2018, or are these different structures or dust trails that are active? Peter Jenniskens gives the appearance of the filament structure as a possible reason (Jenniskens, 2021). But what does this mean for the predictions for the filament structure in the Perseids meteoroid stream in the book by Jenniskens (Jenniskens, 2006, page 659 table 5d)?
Most of the peaks in Table 4 and Figure 15 appear to show similarities. First, the 2018 and 2019 outbursts, which are similar in maximum ZHR and duration. The 2020 outburst is different in that regard and is more like the 2016 August 11–12 Perseid outbursts when the Earth passed through multiple dust trails. It is noticeable that with each peak in 2020 the population index is higher than during the previous peak. If we disregard the outburst of 2020, it is noticeable that each peak of 2018, 2019 and 2021 falls somewhat later in solar longitude. For this reason, a search was done in the IMO visual database 2020 Perseids. However, no abnormal Perseid activity was found in 2020 during the interval λʘ = 141.24° and 141.50° (European data).
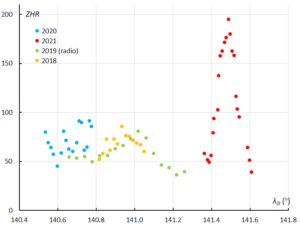
Figure 16 – A combined ZHR graph with the Perseid outbursts in 2018, 2019, 2020 and 2021.
5 Conclusion
In 2018, 2019 and 2020, the Perseids showed modest outbursts between λʘ = 140.60° and 141.60°. In 2021, the Perseids showed a major outburst at λʘ = 140.47°. It is not yet clear what mechanism(s) are behind these outburst(s). The Perseid meteor shower seems like a suitable meteor shower to combine both visual and radio observations. Visual meteor observers are recommended to observe a little longer after the traditional Perseid maximum. You might be in for a surprise!
Acknowledgment
The authors thank the visual and radio observers for providing their observational data. These are (visually): Robert Lunsford, Paul Martsching, Pierre Martin, Terrence Ross, Gabriel Hickel and Bruce McCurdy. The following radio observers provided data for this analysis: Chris Steyaert (Belgium), Felix Verbelen (Belgium), Johan Coussens (Belgium), Halei BI7NTP (China), FLZ-R0 (Czech republic), ZVPP-R7 (Czech republic), Jacques Molne (France), Pierre Micaletti (France), DanielD SAT01_DD (France), Jean Marie F5CMQ (France), Per DL0SHF (Germany), WHS Essen (Germany), Hegyesi Viktor (Hungary), Istvan Tepliczky (Hungary), Balogh Laszlo (Hungary), Fabio Moschini_IN3GOO (Italy), AAV Planetario_di_Venezia (Italy), Associazione Pontina di Astronomia _APA_ (Italy), Giuseppe Massimo Bertani (Italy), GAML Osservatorio Astronomico Gorga (Italy), Mario Bombardini (Italy), Hirofumi Sugimoto (Japan), Hironobu Shida (Japan), Hiroshi Ogawa (Japan), Kenji Fujito (Japan), Masaki Kano (Japan), Masaki Tsuboi (Japan), Nobuo Katsura (Japan), Tomohiro Nakamura (Japan), Yumari (Japan), Juan Zapata (Mexico), Rainer Ehlert (Mexico), Salvador Aguirre (Mexico), Kees Meteor (Netherlands), Karlovsky Hlohovec Observatory (Slovakia), Jochen Richert (Switzerland), Ian Evans (UK), Philip Norton (UK), Philip Rourke (UK), Simon Holbeche (UK), Eric Smestad_KC0RDD (USA), Stan Nelson (USA). The worldwide data were provided by the Radio Meteor Observation Bulletin (RMOB). The authors also thank Paul Roggemans and Carl Johannink for proofreading. A very special thank you to Hiroshi Ogawa for helping us with this article.
References
Gaarder K. (2018). “2018 Perseid expedition to Crete”. eMetN, 3, 263–266.
Jenniskens P. (2006). “Meteor Showers and their Parent Comets”. Cambridge University Press, Cambridge, UK, 790 pp.
Jenniskens P. and Miskotte K. (2021). “Perseid meteor outburst 2021”. eMetN, 6, 460–461.
Jenniskens P. (2021). “Perseid meteor shower outburst 2021”. CBET 5016, 2021 August 14, editor D.W.E. Green.
Miskotte K. (2019). “The Perseids in 2018: Analysis of the visual data”. eMetN, 4, 135–142.
Miskotte K. and Vandeputte M. (2020). “Perseids 2019: another peak in activity around solar longitude 141.0?”. eMetN, 5, 25–29.
Miskotte K. (2020). “Perseids 2020: again, enhanced Perseid activity around solar longitude 141?”. eMetN, 5, 395–397.
Miskotte K. (2021). “Perseids 2020 revisited”. eMetN, 6, 29–30.
Sugimoto H. (2017). “The New Method of Estimatin ZHR using Radio Meteor Observations”. eMetN, 2, 109–110.
Vandeputte M. (2019). “Perseid campaign at Aubenas Les Alpes, Haute Provence”. eMetN, 4, 83–88.
