Abstract: The δ-Aquariids are one of the major meteor showers. In 2021, worldwide radio meteor observations caught a distinct activity. The peak occurred at λʘ = 125.64° (July 28. 18h UT) with an Activity Level = 4.0 ± 0.7. Another peak before the main peak has been observed at λʘ = 122˚ (July 25). This activity was composed by two components. One was the traditional activity, and the other was a sub-component activity. The peak of the traditional activity appeared earlier than for visual observations. The sub-component activity has been also detected in the past.
1 Introduction
The δ-Aquariids are one of the most prominent annual meteor showers. The peak occurs around July 30th (λʘ = 127°) with a ZHR = 25 (Rendtel, 2020).
With Radio Meteor Observations it is possible to observe meteor activity continuously even if the weather is bad or during daytime. Besides, the radiant elevation problem has been solved by organizing the worldwide radio project. One of these worldwide projects is the International Project for Radio Meteor Observations (IPRMO). IPRMO uses the Activity Level Index for the analyzing of meteor shower activity (Ogawa et al., 2001).
This project has covered the δ-Aquariids activity since 2005 (Ogawa and Steyaert, 2017). The annual activity for the period of 2005–2020 shows the maximum Activity Level = 3.0 at λʘ = 125.00° with FWHM = –2.8° / +5.3°. The maximum of the δ-Aquariids in the case of radio meteor observations appears earlier than for the visual observations.
2 Method
Similar to previous investigations, the meteor activity was calculated by using the Activity Level Index. The profile of the meteor activity was estimated by using the Lorentz profile (Jenniskens et al., 2000). Although the total number of meteor echoes did not only include δ-Aquariids but also α-Capricornids, it has been assumed that most of the increase in activity was caused by the Southern δ-Aquariids.
3 Results
Figure 1 shows the result of the δ-Aquariid activity based on the calculation of the Activity Level Index using 40 observations from 12 countries. The distinct increase started around λʘ = 118˚ (July 19). The highest activity occurred between λʘ = 124.00° and 126.00°. The maximum peak displayed an Activity Level = 4.0 ± 0.7 at λʘ = 125.64° (July 28, 18h UT). Since the solid line shows the average for the period of 2005–2020, the whole activity profile was similar to the previous year’s average. In detail, however, the ascending shoulder produced a higher activity than previous year’s average. Another peak appeared at λʘ = 122° (July 25). The peak had an Activity Level = 3.4 ± 0.3 at λʘ = 122.22° (July 25, 5h UT). Although the Activity Level Index seemed to increase again after λʘ = 125.64° (August 6), this was probably due to the influence of the beginning Perseid activity. This is because it is impossible to distinguish the total number of meteor echoes for the different meteor showers.
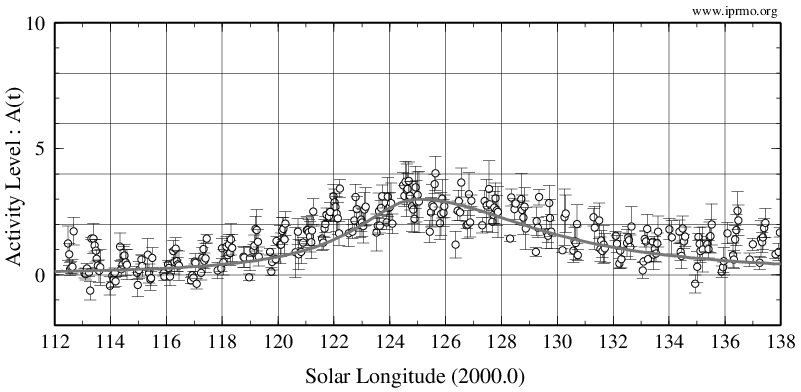
Figure 1 – The Activity Level Index of the δ-Aquariids 2021 by radio meteor observations from all over the world (solid line is the average for the period of 2005–2020).
4 Activity profile components
Figure 2 and Table 1 show the activity components of the δ-Aquariids 2021 estimated by using the Lorentz profile. One component represents the main activity and had a maximum Activity Level = 3.5 at λʘ = 126.16° (July 29, 8h UT). It seems that this activity represents the traditional activity profile. The other component appeared with a maximum Activity Level = 1.0 at λʘ = 121.74° (July 24, 17h UT).
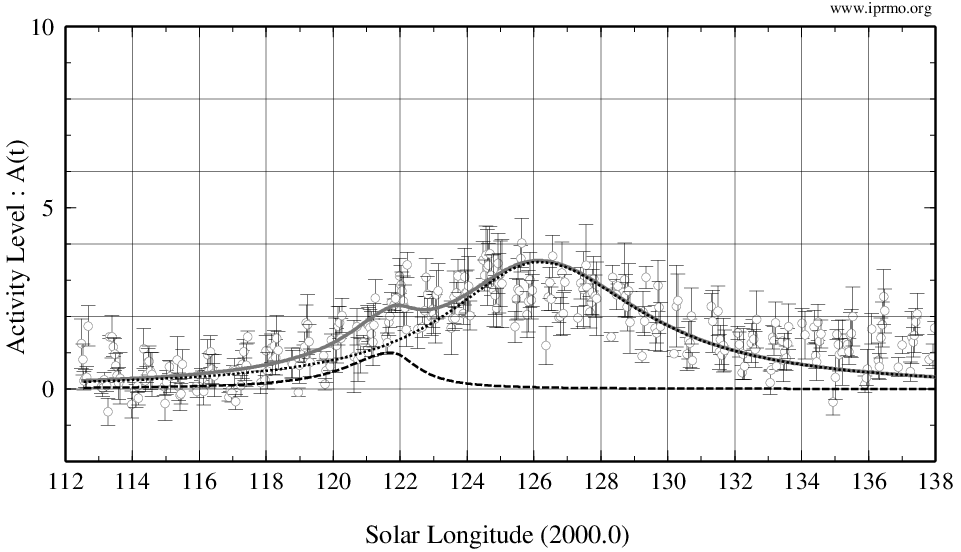
Figure 2 – The estimated components of the δ-Aquariids 2021 (dotted and dashed lines represent the main and the sub components, the gray line represents the total activity profile).
Table 1 – The estimated components of the δ-Aquariids 2021.
| DAQ21C01 | DAQ21C02 | |
| Peak Time | July 29, 8h UT | July 24, 17h UT |
| Solar Longitude | 126.16° | 121.74° |
| Activity Level | 3.5 | 1.0 |
| FWHM (hours) | -84.0 / +96.0 | -42.0 / +24.0 |
5 Discussion
The earlier peak time than in visual observations
Since 2005, the peak of the δ-Aquariids in radio meteor observations was observed to appear earlier in time than in the visual observations. Table 2 shows the list of data for past observations. The average time for the main peak for the period of 2005–2020 was estimated at λʘ = 125.00°. Although the time of the peak activity has a certain width, these occurred almost every year earlier than the visual peak.
A possible explanation may be that the activities caused by different meteor showers have been combined because with radio meteor observations it is difficult to separate the activity from different meteor showers. Another possible explanation is that the mass distribution of the meteors is different for the visual and for the radio observations.
Sub activity component
The sub activity component seen in the 2021 δ-Aquariids has been also detected in almost every previous year (see Table 2). The average for the previous years 2005–2020 was at λʘ = 122.1 ± 0.8° with an Activity Level = 1.2 ± 0.6. It is important to note that the time of the peak and the activity level had a width.
There is no obvious explanation what is causing this activity. Although it is possible that these occur within the error margins, there may be some other explanation because this has been observed almost every year.
Table 2 – The list with the data for both components of the main and the sub activity. AL* is the Activity Level at the peak time.
|
|
Main activity | Sub activity | ||
| λʘ | AL* | λʘ | AL* | |
| 2005 | 125.93° | 3.5 | 121.39° | 0.5 |
| 2006 | 125.22° | 4.0 | 121.63° | 1.0 |
| 2007 | 126.40° | 3.5 | 122.58° | 1.0 |
| 2008 | 124.96° | 4.0 | – | – |
| 2009 | 124.72° | 5.0 | 121.65° | 2.0 |
| 2010 | 126.39° | 4.0 | 123.36° | 2.0 |
| 2011 | 125.42° | 3.0 | 122.08° | 1.5 |
| 2012 | 126.93° | 4.0 | 122.79° | 2.0 |
| 2013 | 126.60° | 3.0 | 123.34° | 2.0 |
| 2014 | 124.69° | 3.0 | – | – |
| 2015 | 125.24° | 3.0 | 122.06° | 1.0 |
| 2016 | 125.94° | 3.5 | – | – |
| 2017 | 126.50° | 2.5 | 121.68° | 0.6 |
| 2018 | 126.14° | 2.5 | 122.91° | 0.5 |
| 2019 | 125.77° | 3.0 | 120.24° | 0.5 |
| 2020 | 125.45° | 3.0 | 121.79° | 1.0 |
Acknowledgment
The worldwide data were provided by the Radio Meteor Observation Bulletin (RMOB). The data has been provided by the following observers:
Chris Steyaert (Belgium), Felix Verbelen (Belgium), Johan Coussens (Belgium), Pierre Micaletti (France), DanielD SAT01_DD (France), Jean Marie F5CMQ (France), WHS Essen (Germany), Balogh Laszlo (Hungary), Associazione Pontina di Astronomia APA (Italy), Fabio Moschini_IN3GOO (Italy), GAML Osservatorio Astronomico Gorga (Italy), Mario Bombardini (Italy), Oss Monte San Lorenzo DLF (Italy), Hirofumi Sugimoto (Japan), Hironobu Shida (Japan), Hiroshi Ogawa (Japan), Hirotaka Otsuka (Japan), Kenji Fujito (Japan), Masaki Kano (Japan), Masaki Tsuboi (Japan), Tomohiro Nakamura (Japan), Juan Zapata (Mexico), Rainer Ehlert (Mexico), Salvador Aguirre (Mexico), Kees Meteor (Netherlands), Jose Carballada (Spain), Jochen Richert (Switzerland), Ian Evans (United Kingdom), John Collins (United Kingdom), Philip Norton (United Kingdom), Philip Rourke (United Kingdom), Simon Holbeche (United Kingdom), Eric Smestad KC0RDD (United States of America).
References
Jenniskens P., Crawford C., Butow S. J., Nugent D., Koop M., Holman D., Houston J., Jobse K., Kronk G., and Beatty K. (2000). “Lorentz shaped comet dust trail cross section from new hybrid visual and video meteor counting technique imprications for future Leonid storm encounters”. Earth, Moon and Planets, 82–83, 191–208.
Ogawa H., Toyomasu S., Ohnishi K., and Maegawa K. (2001). “The Global Monitor of Meteor Streams by Radio Meteor Observation all over the world”. In, Warmbein Barbara, editor, Proceeding of the Meteoroids 2001 Conference, 6-10 August 2001, Swedish Institute of Space Physics, Kiruna, Sweden. ESA Publications Division, European Space Agency, Noordwijk, The Netherlands, 189–191.
Ogawa H. and Steyaert C. (2017). “Major and Daytime Meteor Showers using Global Radio Meteor Observations covering the period 2001–2016”. WGN, Journal of the International Meteor Organization, 45, 98–106.
Rendtel J. (2020). “2021 Meteor Shower Calendar”. International Meteor Organization.