Abstract
An analysis of visual observations of the Geminids in 2020 is presented. The maximum activity was expected to take place above Europe. Indeed, there was a peak in activity around solar longitude 262.14 degrees, but with a ZHR of 90 ± 4 it was remarkably low.
1 Introduction
The 2020 Geminid observational campaign was long awaited. Not only was the maximum was predicted for Europe, but 2020 also fell nicely in the comparison series 1996–2004 and 2012. Unfortunately, the Corona pandemic also severely hit Europe, making all kinds of large-scale movements almost impossible. Borders were closed, planes grounded and so the options to move to clear weather slowly but surely dried up. For the author and a number of Dutch observers, this meant waiting to see whether it would become clear in the Netherlands or not. Unfortunately, as so often in December, the weather did not cooperate. Almost nothing has been seen from the Benelux around the Geminid maximum. But the weather conditions were also poor in the rest of Europe, here and there people could benefit from small-scale clear sky periods. The observers in Israel were better off in that regard and were able to observe extensively on the nights of December 12–13 and December 13–14. There hasn’t been much observed on the American continent either. So, there was not much hope for a good analysis. Fortunately, it turned out that the latter was not so bad and that nice results were still achieved.
2 The observers and analysis
On the IMO website, 7445 Geminids were reported by 50 observers. The author of this article received another observation with 169 Geminids. See Table 1 with all the observers who observed the Geminids in 2020.
All data was pre-checked on the following points:
- The limiting magnitude was rounded off at least at 5.9;
- The radiant height was at least 25 degrees or higher;
- Hourly counts were used for this analysis. These were added together when shorter counting periods were reported. Short isolated periods were not used;
- A known Cp was used or calculated for all observers from whom data was used;
- Extreme outliers are always removed, but this did not appear to be necessary in this analysis.
3 Population index r
The Geminids are known to have a strong variation in the size of the meteoroids during their activity period. Especially shortly after the maximum, this manifests itself through the appearance of bigger meteoroids, causing more brighter meteors. We can depict this phenomenon with the population index r. This number says something about the average brightness of the meteor shower. A low population index r means relatively many bright meteors, a high population index r means a lot of weak meteors.
To determine the population index r you must have enough meteors available per time unit. For the nights before December 12, it is therefore only possible to determine a population index r per night. For 12–13 December periods of a few hours could be used and around the maximum there was enough data for every hour.
To calculate the population index r, the observation data must meet two criteria:
- The limiting magnitude may not be less than 5.9;
- The difference between the limiting magnitude and mean magnitude of the meteors should not exceed 4 magnitudes.
For the calculation of the population index r, 3961 Geminids could be used (Steyaert, 1981). Table 2 and Figures 1 and 2 show the results of the population index r calculations (only for r [–2;+5] and r [–1:+5]).
If we look at Figures 1 and 2 in detail, we see that during the night 12–13 the population index r varries mostly between 2.0 and 2.5. During the maximum night over Europe, a steady decrease is visible after 2020 December 14, 00h00m UT (λʘ = 262.15°). Based on this, you would expect a maximum before this time.
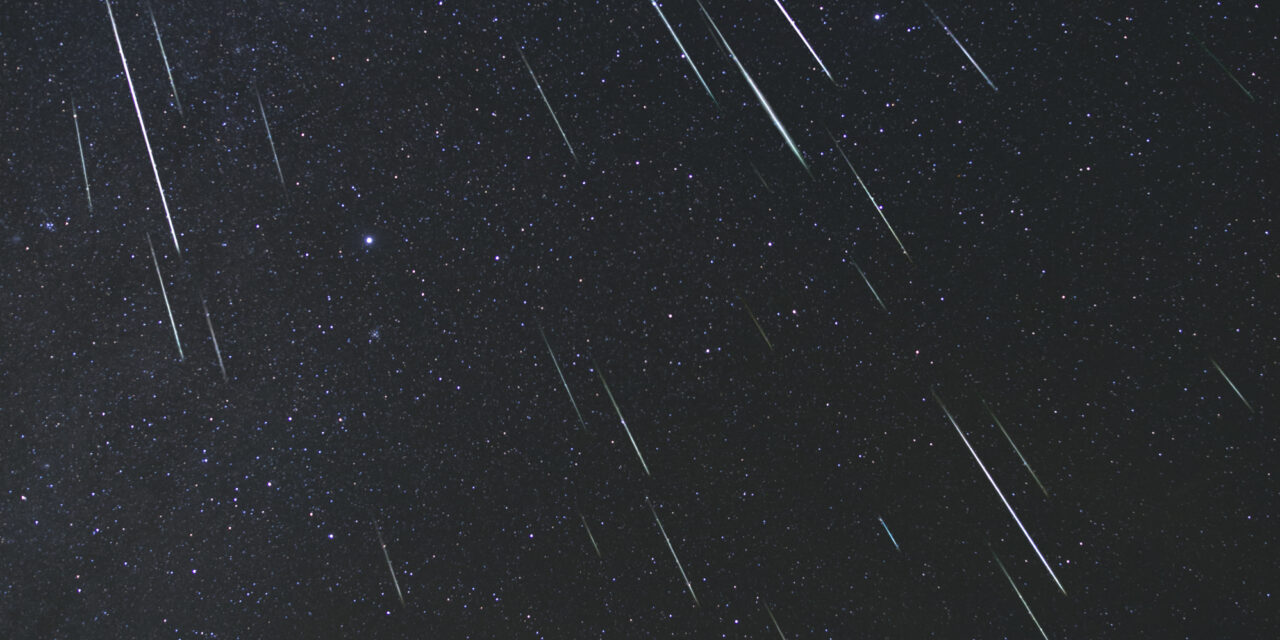
The Geminids are also known for short-lived periods with many fireballs. This can be quite spectacular for an observer. For example, in 2007 the author and some observers saw 22 Geminid fireballs with magnitudes between –3 to –8 within hours (Miskotte et al., 2010; 2011; Vandeputte, 2008)!
|
Observer |
Sessions |
Teff. |
GEM |
Observer |
Sessions |
Teff. |
GEM |
|
Adams Mark |
2 |
09h29m |
171 |
Melandri Fabrizio |
1 |
02h30m |
192 |
|
Amorim Alexandre |
1 |
00h57m |
2 |
Merlin Frederic |
1 |
04h25m |
113 |
|
Bao Wenjie |
1 |
01h30m |
27 |
Nilforoushan M. |
1 |
01h40m |
43 |
|
Ben Craig |
1 |
03h06m |
73 |
Pineau François |
1 |
01h00m |
24 |
|
Benítez S. Orlando |
1 |
02h19m |
109 |
Plum Jonas |
1 |
00h40m |
7 |
|
Brown Steve |
2 |
04h30m |
110 |
Prokofyev Sasha |
1 |
00h15m |
1 |
|
Correa da Silva Riziele |
1 |
03h07m |
2 |
Ratz Ella |
2 |
10h38m |
451 |
|
Deconinck Michel |
2 |
02h00m |
85 |
Rendtel Ina |
7 |
17h51m |
240 |
|
Dubishkin Dmitry |
1 |
00h45m |
6 |
Rendtel Jurgen |
9 |
20h24m |
239 |
|
Edin Howard |
4 |
04h08m |
214 |
Romanov Filipp |
10 |
05h20m |
178 |
|
Eini Shlomi |
2 |
08h30m |
476 |
Ross Terrence |
8 |
12h09m |
502 |
|
Gavriljuk Dmitry |
1 |
01h00m |
7 |
Sergey Ivan |
2 |
04h52m |
2 |
|
Gerber Christoph |
1 |
00h28m |
22 |
Shi Wei |
1 |
03h15m |
227 |
|
Godley William |
1 |
01h00m |
27 |
Sperberg Ulrich |
1 |
02h00m |
0 |
|
Growe Matthias |
1 |
01h04m |
0 |
Sun Fengwu |
3 |
03h28m |
245 |
|
Hergenrother Carl |
1 |
00h57m |
48 |
Taibi Richard |
2 |
02h10m |
14 |
|
Hickel Gabriel |
1 |
01h28m |
34 |
Tchenak Tamara |
2 |
14h41m |
753 |
|
Hughes Glenn |
1 |
00h45m |
0 |
Uchiyama Shigeo |
2 |
02h42m |
74 |
|
Jiménez López Gerardo |
2 |
02h50m |
33 |
Vandenbruaene H. |
1 |
01h04m |
32 |
|
Jones Paul |
1 |
02h00m |
169 |
Weiland Thomas |
4 |
09h17m |
359 |
|
Jung Hansub |
1 |
02h10m |
29 |
Westfried Ariel |
3 |
08h32m |
528 |
|
Katz Omri |
2 |
08h42m |
426 |
Wächter Frank |
2 |
01h15m |
108 |
|
Kostenko Roman |
8 |
03h20m |
161 |
Wächter Sabine |
2 |
01h39m |
73 |
|
Levin Anna |
2 |
16h21m |
792 |
Xiaofan Wei |
1 |
02h06m |
165 |
|
Marsh Adam |
2 |
06h54m |
14 |
Zeinodini Mostafa |
1 |
00h19m |
7 |
|
Marsh Jemma |
2 |
02h00m |
0 |
Table 1 – List of observers who observed the Geminids in 2020.
|
Date |
λʘ (°) |
r[–1;+5] |
± |
r[–2;+5] |
± |
|
7–12–2020 19h00m |
255.819 |
3.00 |
~ |
3.00 |
~ |
|
12–12–2020 05h55m |
260.383 |
2.18 |
0.4 |
~ |
~ |
|
12–12–2020 21h40m |
261.048 |
2.38 |
0.33 |
~ |
~ |
|
13–12–2020 00h20m |
261.161 |
2.11 |
0.21 |
2.27 |
0.21 |
|
13–12–2020 05h34m |
261.383 |
2.35 |
0.22 |
~ |
~ |
|
13–12–2020 06h36m |
261.427 |
2.53 |
0.15 |
2.64 |
0.15 |
|
13–12–2020 19h00m |
261.953 |
2.40 |
0.12 |
2.24 |
0.12 |
|
13–12–2020 20h02m |
261.997 |
2.02 |
0.14 |
2.05 |
0.14 |
|
13–12–2020 22h07m |
262.088 |
1.88 |
0.08 |
1.97 |
0.08 |
|
13–12–2020 23h02m |
262.124 |
2.10 |
0.08 |
2.07 |
0.07 |
|
14–12–2020 00h06m |
262.169 |
2.16 |
0.08 |
2.25 |
0.08 |
|
14–12–2020 01h30m |
262.228 |
1.90 |
0.07 |
2.01 |
0.06 |
|
14–12–2020 03h19m |
262.297 |
1.60 |
0.09 |
1.73 |
0.08 |
|
14–12–2020 06h57m |
262.459 |
1.74 |
0.15 |
1.96 |
0.15 |
|
14–12–2020 21h10m |
263.062 |
2.17 |
0.48 |
~ |
~ |
|
15–12–2020 00h10m |
263.189 |
2.20 |
0.4 |
~ |
~ |
|
15–12–2020 05h05m |
263.398 |
2.55 |
0.69 |
2.30 |
0.69 |
Table 2 – Population index r Geminids 2020.
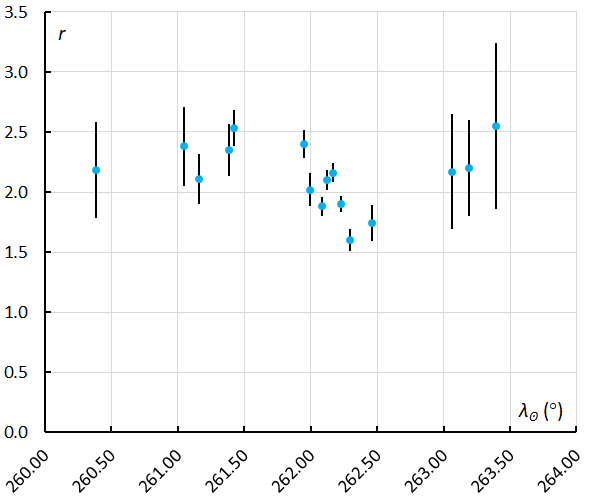
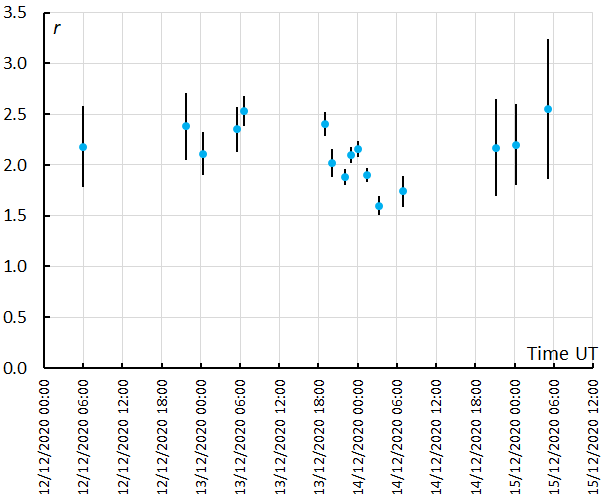
Figure 1 (left) and Figure 2 (right) – Population index r for the Geminids 2020 [–1:+5] against solar longitude λʘ (°) (left) and against GMT 12 December 2020 00h00m UT to 15 December 2020 12h00m UT (right).

Figure 3 – Composition with 7 Geminids, captured at a location near Evora, Portugal, during the night 2007 December 14–15.
Photo and composition made by the author.
|
Observers |
Date |
Period UT |
Start λʘ (°) |
End λʘ (°) |
Mean λʘ (°) |
Location |
|
Johannink, Miskotte, Vandeputte, Vanderkerken |
15 Dec.2007 |
00h45m–04h15m |
262.539 |
262.687 |
262.613 |
Portugal |
|
Weiland, Bettonvil |
13–14 Dec. 2012 |
19h25m–00h10m |
262.025 |
262.227 |
262.126 |
Oman |
|
Martin |
15 Dec.2015 |
05h00m–08h30m |
262.668 |
262.817 |
262.743 |
US |
|
Ross, Craig |
14 Dec. 2020 |
06h11m–10h22m |
262.419 |
262.603 |
262.511 |
US |
Table 3 – Overview of observations of many Geminid fireballs in a short time.
Remarkable in this respect are the 2020 observations of Terrence Ross and Ben Craig from Texas and California respectively. Terrence Ross saw 7 Geminids of –3 (2×), –4 (2×), –5 and –6 (2×) on 2020 December 14, between 7h25m UT and 8h30m UT[1]. The time he observed before this period (December 14, 2020 between 05h28m and 06h30m UT) there were no bright Geminids at all[2]. This observation reminded the author on the 2007 observations from Portugal. Observer Ben Craig saw 14 bright Geminids (–5, –4 and 12×–3) between 6h11m and 10h22m UT on 2020 December 14[3]. Similar stories are known: in 2012 Felix Bettonvil and Thomas Weiland saw quite a few fireballs from Oman in a short time (Weiland and Bettonvil, 2015). Pierre Martin also witnessed several fireballs in a short time in 2015 (Martin, 2018)[4]. Table 3 provides an overview of these observations.
[1] https://www.imo.net/members/imo_vmdb/view?session_id=81849
[2] https://www.imo.net/members/imo_vmdb/view?session_id=81848
[3] https://www.imo.net/members/imo_vmdb/view?session_id=81831
[4] https://www.imo.net/members/imo_vmdb/view?session_id=76023
It is striking that the fireball observations from 2007, 2017 and 2020 partly overlap in solar longitude. The 2012 observation is an outlier that fell much earlier in solar longitude. It also seems that this phenomenon did not occur every year. The author will investigate this in a larger study of the Geminids in a future publication.
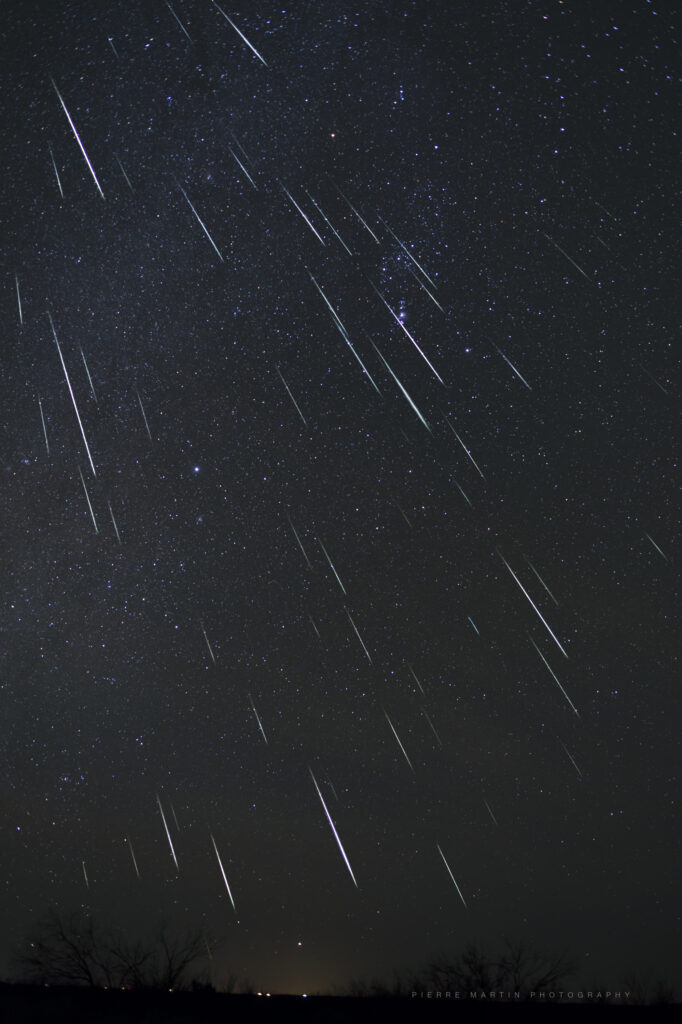
Figure 4 – Spectacular composition made by Pierre Martin from Texas, US in the night 14–15 December 2015. Canon EOS 6D, Sigma ART 24-35mm F2, (stopped at f / 2.2), focal length: 24mm, 25 sec exposures ×61, ISO 1600. More beautiful photos can be seen online[1].
[1] https://pmartin.smugmug.com/Astronomy/2015121317-Astronomy-Trip-to-T
4 Zenital Hourly Rate (ZHR)
The ZHR could also be determined with the calculated population index r. In total, of the 7445 Geminids reported to IMO, 4808 were used for the ZHR analysis. The results of the calculations are shown in Table 4 and Figure 5.
If we look closely at Figure 5, we see ZHR values between 30 and 60 for December 12–13, something you would expect at this time. There is an isolated ZHR point near solar longitude 161.5° (ZHR 119 ± 15).
During the maximum night (13–14 December 2020) we see indeed a peak around solar longitude 262.14° in Europe. However, this is a very low peak with a ZHR of 90 ± 4 followed by a declining ZHR. The question is whether this is the real peak or rather a sub-peak. However, the decreasing population index r (more brighter Geminids) after 2020 December 14, after 00h00m UT seems to confirm that this was the main peak. If this is really the case, the maximum ZHR value found is very low. The problem in this story is the higher ZHR values that are found at the end of the night and above the USA. Unfortunately, this data from only a few observers is based on relatively low Geminid numbers. It is also quite a late time for a major peak, but it has sometimes happened before in previous years.
|
Day |
UT |
λʘ (°) |
periods |
GEM |
ZHR |
± |
|
7 |
19.50 |
255.875 |
1 |
2 |
5.1 |
3.6 |
|
10 |
7.25 |
258.404 |
2 |
8 |
6.5 |
2.3 |
|
12 |
5.93 |
260.381 |
3 |
59 |
27.7 |
3.6 |
|
12 |
21.49 |
261.041 |
6 |
131 |
31.6 |
2.8 |
|
13 |
1.17 |
261.197 |
3 |
142 |
51.6 |
4.3 |
|
13 |
5.26 |
261.37 |
3 |
145 |
51.6 |
4.3 |
|
13 |
6.34 |
261.416 |
6 |
224 |
60.2 |
4.0 |
|
13 |
8.64 |
261.514 |
3 |
218 |
114.2 |
7.7 |
|
13 |
19.29 |
261.965 |
6 |
220 |
72.3 |
4.9 |
|
13 |
20.47 |
262.015 |
6 |
357 |
76.7 |
4.1 |
|
13 |
21.53 |
262.06 |
10 |
595 |
79.4 |
3.3 |
|
13 |
22.66 |
262.108 |
5 |
372 |
85.8 |
4.4 |
|
13 |
23.42 |
262.14 |
6 |
527 |
89.6 |
3.9 |
|
14 |
0.30 |
262.177 |
6 |
489 |
75.7 |
3.4 |
|
14 |
1.36 |
262.222 |
6 |
445 |
80.3 |
3.8 |
|
14 |
2.30 |
262.262 |
4 |
273 |
75.6 |
4.6 |
|
14 |
4.43 |
262.352 |
2 |
113 |
95.3 |
9.0 |
|
14 |
5.78 |
262.41 |
2 |
61 |
118.9 |
15.2 |
|
14 |
7.49 |
262.482 |
4 |
281 |
91.5 |
5.5 |
|
14 |
20.17 |
263.020 |
1 |
9 |
18.1 |
6.0 |
|
14 |
21.17 |
263.062 |
1 |
9 |
14.4 |
4.8 |
|
14 |
22.17 |
263.104 |
1 |
9 |
12.2 |
4.1 |
|
14 |
23.17 |
263.147 |
1 |
10 |
12.2 |
3.8 |
|
15 |
0.17 |
263.189 |
1 |
21 |
24.9 |
5.4 |
|
15 |
1.17 |
263.232 |
1 |
8 |
9.6 |
3.4 |
|
15 |
5.09 |
263.398 |
2 |
15 |
12.9 |
3.3 |
|
16 |
20.72 |
265.079 |
2 |
10 |
5.6 |
1.8 |
|
17 |
4.45 |
265.406 |
5 |
16 |
4.3 |
1.1 |
|
18 |
0.42 |
266.254 |
3 |
8 |
3.1 |
1.1 |
|
18 |
22.44 |
267.188 |
2 |
8 |
2.1 |
0.7 |
|
19 |
1.71 |
267.326 |
6 |
15 |
2.9 |
0.75 |
|
19 |
21.24 |
268.155 |
4 |
8 |
2.8 |
1.0 |
Table 4 – ZHR of the Geminids in December 2020.
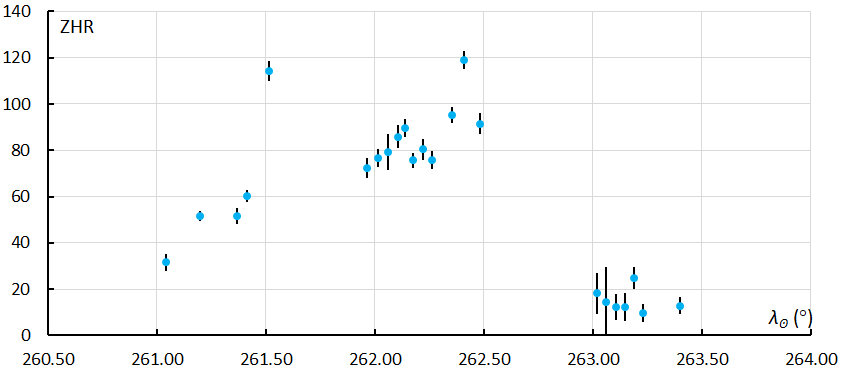
Figure 5 – The ZHR of the Geminidsin 2020 (variable population index r, γ = 1,0). As usual, only Europe is well represented in the observational data.
The 1996–2004–2012–2020 series
Every eight years we can observe at almost the same solar longitude and almost the same phases of the moon. In the article about 30 years of Geminid observations (Miskotte et al., 2010; 2011) we looked at whether we could find something of a trend in activity over a period of 30 years. It was concluded that the maximum Geminid ZHR increased from 1983 to 1996/2004 (from 80–100 to 120–140) and then remained stable or decreased slightly to 100–120. There are good data sets from 1996, 2004 and 2012, so we can (cautiously) compare the data from 2020 with these years. The ZHR graphs from previous years have been determined in an exactly identical manner. Hourly counts were used, and an assumed r value was used with the population index r = 2.2 to solar longitude 262.2°, after that r = 2.00. The 2020 data was also calculated in this way. The ZHR values found hardly deviate from the curve with the r values calculated in this article. Figures 6, 7, 8 and 9 are results from these comparisons.
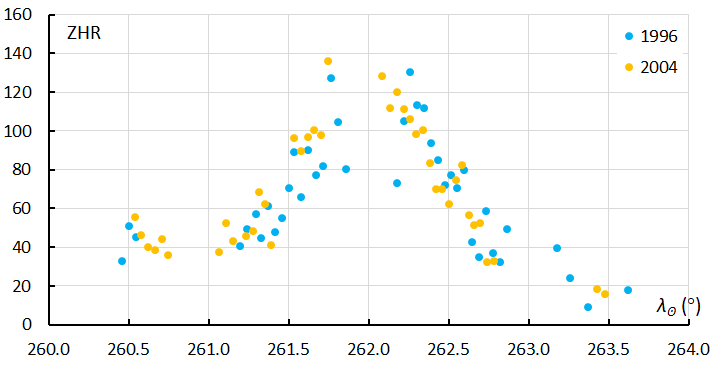
Figure 6 – Comparison of the Geminids in 1996 and 2004.
It is very well visible in Figure 6 that the activity and curves are comparable to each other. However, the graph of 2004 seems to have shifted slightly earlier in solar longitude compared to 1996. Both curves are of good quality based on 7531 Geminids from 1996 and 8340 Geminids from 2004.
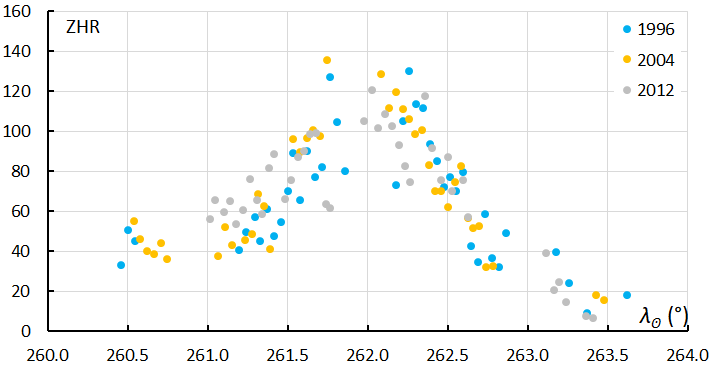
Figure 7 – Comparison of the Geminids in 1996, 2004 and 2012.
Some details require attention in Figure 7. In the period before the maximum (12–13 December), activity appears to be considerably higher in 2012 compared to 1996 and 2004, while the activity appears to be somewhat lower around the maximum. In 2012 there seems to be a dip in the activity profile that was also seen in 1996 (but not seen in 2004) around solar longitude 261.8°. The 2012 curve is also of a very reliable quality, based on 6650 Geminids.
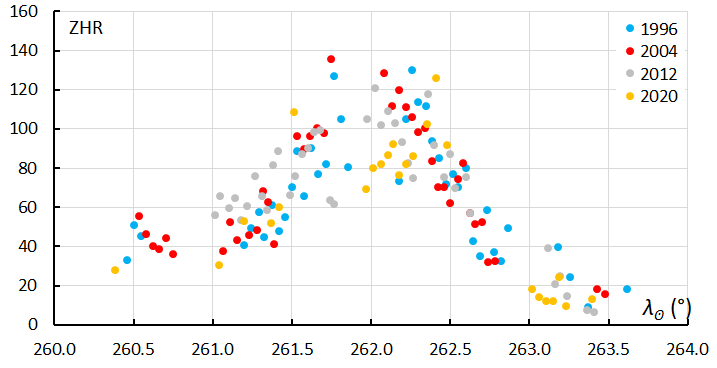
Figure 8 – Comparison of the Geminids in 1996, 2004, 2012 and 2020.
In Figure 8 it really looks like, with the exception of a few points, that the ZHR was visible lower in 2020. It seems a trend that confirms that we have had the most beautiful Geminid years in the past (1996–2004). The 2020 curve is based on 4733 Geminids.
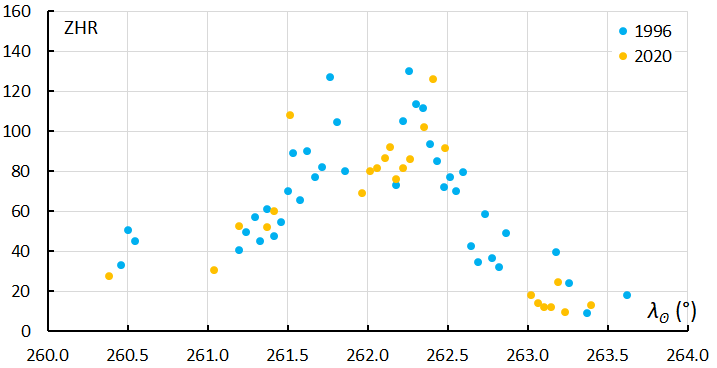
Figure 9 – Comparison of the Geminids in 1996 and 2020 (24 years).
Figure 9 shows another comparison between 1996 and 2020, because this is the longest period (24 years). This clearly reflects the problem of a comparison between the 1996 and 2020 activity profiles. Part of the night 13–14 December 2020 observed from Europe has too few points to be compared with 1996. This is partly because we do not look exactly at the same solar longitude every eight years. And if we then look at the ZHR points of 1996 and 2004 at solar longitude 262.2°, then there is indeed some similarity between the two years, also in terms of activity. More research with overlapping years from other series will certainly follow in a future article.
5 Conclusion and recommendations
The Geminids could hardly be observed from the BeNeLux, and it was also only moderately well observed in Europe. Nevertheless, a good result could ultimately be achieved. The expected maximum above Europe was weak. However, it is still not 100% certain that the best Geminids years are behind us. At best, there are some indications that this may be the case. It is clear, however, that the Geminid activity does not increase further compared to 1996–2004. This is in contrast to what is written in the article by Galina Ryabova and Jürgen Rendtel (Ryabova and Rendtel, 2018). The author hopes that good Geminid analyzes can be performed even more often in the future.
For the observers, it is highly recommended to observe in dark locations. The darker the starry sky, the (much) more you see! Observers are also advised to make a minimum of 10–15 hours observations in August so that Cp values can be calculated using hourly counts of the sporadic meteors. With these recommendations, both observations and analyzes will become much more reliable!
Acknowledgment
Many thanks to Carl Johannink, Michel Vandeputte and Thomas Weiland for their valuable comments. Also thank to Paul Roggemans for checking the English version of this article.
References
Martin P. (2018). “December 2015 Geminids adventure!”. eMetN, 3, 233–238.
Miskotte K., Johannink C., Vandeputte M., Bus P. (2010). “Geminiden: 30 jaar waarnemingen (1980-2009)”. Radiant, 32, 152–186.
Miskotte K., Johannink C., Vandeputte M., Bus P. (2011). “Geminids: 30 years of observations (1980–2009)”. WGN, Journal of the IMO, 39, 167–186.
Ryabova, G., Rendtel, J., (2018). “Increasing Geminid meteor shower activity”. Monthly Notices of the Royal Astronomical Society: Letters, 475, L77–L80.
Steyeart C. (1981). Populatie indexbepaling: methode en nauwkeurigheid, Technische Nota nr. 5 VVS Werkgroep Meteoren.
Vandeputte M. (2008). “Grootse Geminiden zwerm boven Portugal!”. Radiant, 30, 42–53.
Weiland T., Bettonvil F. (2015). “Geminids 2012 – a spectacular show from Oman”. In, Rault J.-L. and Roggemans P., editors, Proceedings of the International Meteor Conference, Giron, France, 18-21 September 2014. International Meteor Organization, ISBN 978-2-87355-028-8, pages 89–92.

