An overview of the radio observations during April 2020 is given.
The graphs show both the daily totals (Figure 1) and the hourly numbers (Figure 2) of “all” reflections counted automatically, and of manually counted “overdense” reflections, overdense reflections longer than 10 seconds and longer than 1 minute, as observed here at Kampenhout (BE) on the frequency of our VVS-beacon (49.99 MHz) during the month of April 2020.
The hourly numbers, for echoes shorter than 1 minute, are weighted averages derived from:
N(h) = n(h-1)/4 + n(h)/2 + n(h+1)/4
Due to technical problems at our beacon, the observations were interrupted from 02.04.2020 at 18:45 UT to 08.04.2020 at 09:33 UT, so that the daily totals from 02 to 08 April 2020 are missing. This month there was quite some local interference and unidentified noise, and also lightning activity on three days (April 17th, 28th and 30th). No registered “sporadic E” (Es). Most unwanted signals were corrected manually in the automatic counts.
As expected, the general shower activity remained low up to 20/4, with only a brief increase on 15/04, possibly due to the phi Serpentids. As expected, the annual Lyrids were the highlight of the month. They reached their maximum here on 22/04 between 04 and 05 UT, but between 02 UT and 09 UT there was increased activity. Apart from the Lyrids, between 20/4 and the end of the month, there were several minor meteor showers with mostly weaker reflections (underdenses and shorter overdenses) that need further investigation.
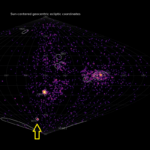
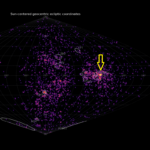
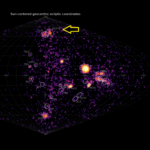
During this month, 7 reflections longer than 1 minute were recorded, but some more may have been lost during the period the beacon was out of order. Also included are a few SpecLab recordings of interesting reflections during this month. Attached are also a few examples of the strongest reflections (Figures 3, 4, 5, 6 , 7, 8, 9 and 10).
If you are interested in the actual figures, please send me an e-mail: felix.verbelen at skynet.be.

Figure 1 – The daily totals of “all” reflections counted automatically, and of manually counted “overdense” reflections, overdense reflections longer than 10 seconds and longer than 1 minute, as observed here at Kampenhout (BE) on the frequency of our VVS-beacon (49.99 MHz) during April 2020.

Figure 2 – The hourly numbers of “all” reflections counted automatically, and of manually counted “overdense” reflections, overdense reflections longer than 10 seconds and longer than 1 minute, as observed here at Kampenhout (BE) on the frequency of our VVS-beacon (49.99 MHz) during April 2020.

Figure 3 – 2020 April 9 at 4h50m UT.

Figure 4 – 2020 April 13 at 5h50m UT.

Figure 5 – 2020 April 20 at 7h55m UT.

Figure 6 – 2020 April 21 at 6h15m UT.

Figure 7 – 2020 April 22 at 4h50m UT.

Figure 8 – 2020 April 22 at 7h30m UT.

Figure 9 – 2020 April 23 at 4h10m UT.

Figure 10 – 2020 April 26 at 4h45m UT.