By Takashi Sekiguchi (Nippon Meteor Society and SonotaCo network)
Abstract: In December 2019, 208 Geminids spectra were obtained. The absolute magnitude ranged from -5 to +1 magnitude. The analyses of the spectra of the Geminids in 2019 showed that the Geminid activity was roughly divided into three types. This was also seen in 2018. For 2019, we can say that the normal type meteoroids were the most frequent among the three types. There were also many normal types near the local maximum. This is probably because the observations were done after the maximum in Japan. The occurrence of each type in the order of appearance time and solar longitude was clearly understood. According to the triangular diagram showing the absolute line intensities of Na, Mg, and Fe, with the absolute magnitude distribution, the depletion of Na in the Geminids tends to be higher for fainter meteors. In the fireball class, the proportion of iron tends to be high. By plotting the relationship between Na / Mg and some orbital elements, and between orbital elements, you can get a glimpse of the dust trail.
1 Observing equipment
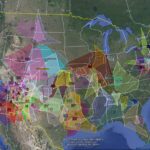
The equipment to register spectra consists of a single-color SONY alpha 7s camera with a 50 mm f 1.4 lens with a transmission diffraction grating film of 500 lines per mm as spectrometer and seven black and white cameras; four Watec Neptune 100+ with CBC 6 mm lenses, one with a 12 mm f 0.8 lens, and two Watec 902H2U with CBC lenses of 6 mm and 8 mm with f 0.8. Some cameras with spectrometer are shown in Figure 1. The coverage of all eight cameras is displayed in Figure 2.


Figure 1 – Transmission type diffraction grating film with 500 lines per mm, 5 units (Top), transmission blazed diffraction grating with 600 lines per mm, 2 units (Bottom).

Figure 2 – The field of view coverage of the cameras for intersection layers at 80, 100 and 120 km elevation.
4 Observing and orbital calculation software
The author uses the software UFOCaptureV2 – UFOAnalyzer V2 and UFOOrbitV2 (http://sonotaco.com/). These programs identify identical events and performs the triangulation calculations on SonotaCo net’s meteor data.
2 Spectral analysis software
The Japanese version of the spectral analysis software Rspec (https://www.rspec-astro.com/) has been used.
In each spectrum analysis, a triangular diagram is created with the peak ratios including rotation, tilt correction, background correction and sensitivity correction.
3 Triangular diagrams
The software CKTriangle (https://clikington-saito.com/CKTriangle/CKTriangle.html) is used to create the triangular or ternary diagrams. The spectral observations of the Geminid meteor shower in December, 2019 resulted in 208 spectra captured by eight cameras. The distribution of Na (5892 Å), Mg (5182 Å) and Fe (5269–5441 Å) is displayed by a triangle diagram.
We refer for the classification to the article by J. Borovička (2005):
- Na-free meteoroids are defined as those without the Na line but not classified as Irons. They fall into the region close to the left edge of the ternary diagram
(e.g. Figure 3). - Normal meteoroids are mainstream meteoroids lying near the expected position for chondritic bodies in the Mg–Na–Fe diagram or with somewhat lower Fe intensity.
- Na-poor meteoroids are mainstream meteoroids with the Na line significantly weaker than expected for the given speed but still reliably visible.
- Fe poor meteoroids are mainstream meteoroids having the expected Na/Mg ratio but with Fe lines too faint to be classified as normal meteoroids.
However, Fe poor were not classified in this study. The normal type represents about half and the Na free and Na poor make up the other half (see Figure 3).

Figure 3 – The triangle diagram displaying the relative line intensities of Na, Mg and Fe for the 208 Geminid spectra of 2019.

Figure 4 – The triangle diagram displaying the relative line intensities of Na, Mg and Fe for the 36 Geminid spectra of 2018.

Figure 5 – The triangle diagram indicating the absolute line intensities for Na, Mg and Fe based on the 208 Geminid spectra of 2019, and the absolute magnitude distribution.
5 Occurrences per type near maximum
Table 1 – Number of appearance times of each Geminids in 2019 by spectrum type.


Figure 6 – The Na / Mg ratio (Log) plotted in function of solar longitude for the 190 Geminids 2019.
Many normal types appear concentrated near the time of maximum activity. Similarly, the Na free and Na poor also increased from 13h00m to 20h00m on December 14 (Universal Time), marked with yellow background in Table 1.
The change in appearance for each type has been plotted for the Na / Mg ratio (Log) plotted in function of solar longitude. There are rather few data points before and after the maximum. The time bin with the maximum is enlarged and displayed at right. At the center of the maximum, it seems that Na free and the normal type appear more abundant at the middle of the maximum activity (Figure 6).
6 Measured Na/Mg line intensity ratio
The Na/Mg line intensity ratio in function of the geocentric velocity vg has been plotted in Figure 7. The data points are concentrated at vg = 33.5 km/s. The normal type is the most abundant. In 2018 the Na poor type were slightly more numerous, although that year only a single camera was used (Figure 8).

Figure 7 – The Na / Mg ratio (Log) plotted in function of the geocentric velocity for the 2019 Geminids.

Figure 8 – The Na / Mg ratio (Log) plotted in function of the geocentric velocity for the 2018 Geminids.
7 Measured O/Mg line intensity ratio
The O / Mg line intensity ratio in function of the geocentric velocity vg (Vojáček et al., 2015) has been plotted in Figure 9, obtained with a black and white camera. In particular, no tendency was observed depending on the type.

Figure 9 – O / Mg ratio (Log) in function of the geocentric velocity for the 2019 Geminids.
8 Relationship with orbital elements
Finally, we consider the relationship with the orbital elements. The Tisserand parameter relative to Jupiter,

where is the semimajor axis of Jupiter, a is the semimajor axis of the meteoroid, and e is the eccentricity of the meteoroid. Figure 10 shows the Na distribution against the inclination i and the Tisserand parameter relative to Jupiter, TJ. There is a clear concentration of mainly normal type meteoroids around inclination i = 23° and TJ = 4.5.
Figure 11 shows the relative line intensity distribution of Na / Mg (Log) in function of the inclination i. The concentration of each type seems to be different for the same inclination. Figure 12 shows the Aphelion Q (A.U.) against perihelion q (A.U.). Figure 13 shows the relative line intensity distribution of Na / Mg (Log) in function of the perihelion q. The distribution of Q against q shows a similar spread as the distribution of TJ against i.

Figure 10 – Na distribution against i and Tj.

Figure 11 – Na / Mg ratio (Log) plotted in function of the inclination i.

Figure 12 – Na distribution against q and Q.

Figure 13 – Na / Mg ratio (Log) plotted in function of the perihelion q.
References
Borovička J., Koten P., Spurný P., Boček J., Štork R. (2005). “A survey of meteor spectra and orbits: evidence for three populations of Na-free meteoroids”. Icarus, 174, 15–30.
Vojáček V., Borovička J., Koten P., Spurný P., Štork R. (2015). “Catalogue of representative meteor spectra”. Astronomy & Astrophysics, 580, A67, 1–31.

Thank you for your observations and research!