Abstract: The results of the author’s radio meteor observations for November 2019 are presented, as well as the first observing results of the meteor showers of the Leonids and the Northern Taurids (NTA) according to the Canadian Meteor Orbit Radar, (CMOR).
The observations were carried out at a private astronomical observatory near the town of Molodechno (Belarus) at the place of Polyani. A 5 element-antenna directed to the west was used, a car FM-receiver was connected to a laptop with as processor an Intel Atom CPU N2600 (1.6 GHz). The software to detect signals is Metan (author – Carol from Poland). A feature of my RMS (Radio Meteor System) is the reception of signals from the smallest meteoroids that generate signals, I’ve created some scale to relate the signal level of meteors in the radio echoes and the photographic star brightness from my all sky camera. The scale turned out to be is very approximate. up to about 6 to 7 magnitude stars.
There was more activity during the first half of the month because of the Orionids and also the Southern Taurids (STA) are still active in early November. In the first half of the month, the following meteor showers ae active: CTA, NTA, OKD, OER, ORI, STA, NID, NOO, OER, ZCN, NAS, IAR, LEO and AND. The second half of the month is calmer. The total number of small showers is larger than in the first half of the month, but their total activity results in lower rates than in the first half of the month. During this period of time, the following showers display activity: ORI, LEO, NOO, NOO, IOA, QUA, STA, NAS, AND, THA, OER, OME, NAR, FTA, AMO, NZT, NZP, NLD, GCP, NLY, GEM, NSU and ZLE. CMOR incorrectly shows two NTA radiants. In fact, the southern radiant marked on the radar images as “NTA” is the STA shower. Interestingly enough, the radar has detected the start of the main QUA shower activity one and a half months before the start of the shower activity!
The arrows on the graph (Figure 1) show the maximum activity of meteor shower, the shower code refers to the IAU working list of meteor showers managed by MDC. Black indicates weak activity, blue is average activity, red is strong activity, green stands for variable activity. Some minor meteor showers which are active according to the CMOR data are also indicated.

Figure 1 – Radio meteor echo counts at 88.6 MHz for November 2019.

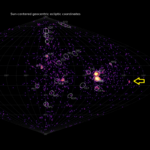
Figure 2 – Heatmap for radio meteor echo counts at 88.6 MHz for November 2019.
I present the first results of a study of the Leonid meteor shower activity based on the Canadian Meteor Orbit Radar (CMOR) data (Jones et al., 2005). Radiant images were analyzed using Maxim DL photometry software. The optimal SNR level for the sub-radiant was determined manually (determining while moving the cursor over the image) with a radius of 1.5 degrees at (R.A.~144° DEC ~ +22.5°) (see Figures 3 and 4), and with a radius of 3.5 degrees for the main radiant at (R.A.=153° DEC = +22°) (see Figure 6). The sub-radiant appeared on the radar on November 14th and disappeared on November 16th.

Figure 3 – Activity of the Leonid sub-radiant in 2019.

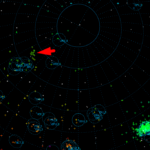
Figure 4 – Position of the Leonid sub-radiant according to CMOR data.
The maximum activity was short-lived and appeared around 11h UT on 14 November. The main shower radiant appeared on the radar on November 14 and disappeared on November 21. The peak activity occurred at the interval of 06h00m–10h00m UT on November 18 (Figure 3), which coincides with the data announced by Robert Lunsford (Meteor Activity Outlook for November 2019, IMO-News): The annual Leonids were predicted to peak at about 05h00m UT on November 18th.

Figure 5 – The Leonid activity according to CMOR. (Signal-to-Noise Ratio – SNR is defined as the ratio of signal power to the noise power).

Figure 6 – Leonids radiant position according to CMOR.
According to IMO data, the peak activity occurred a day earlier, i.e. on November 17 about 06h30m UT with a ZHR of about 29. However, in IMO there are no observations for November 18, so it is impossible to determine the exact moment of the peak activity of the shower, based on the visual data of IMO.
According to my data, some increase in AMO activity occurred in the interval 04h40m–05h00m UT on November 22, 2019. because of the higher activity of the meteor shower (radar sensitivity is a bit rough). During the interval 04h40m–05h00m UT some increase in the level of meteor signals was recorded.

Figure 7 – Increased AMO activity from my RMS data.
In 2016, there was a brief spike in meteor signal activity at 05h40m–06h00m UT 22.11.2016. In 2017 and 2018 there were no short-term bursts in the morning of November 22.
Table 1 – Overview of the AMO activity according to RMS data for 2016–2018.

The IMO Newsletter for NTA shows the peak of this meteor shower on November 3. And the IMO calendar shows the peak activity of the shower on November 13 (Rendtel, 2018). I decided to do a little research on this topic when this shower peaks. To do this, I analyzed images from CMOR (Canadian Meteor Orbit Radar).

Figure 8 – NTA activity according to CMOR data.
I did a radiant flux photometry (radiant intensity measurement) and drew up a SNR (Time) graph. The graph and even the images show that the radiant is very intense (there is redness) around November 13, but on November 9, the double structure is visible (Figure 9).

Figure 9 – Double NTA structure according to CMOR data.
But from November 2 to November 4, the radiant is less intense, rather white without reddish color. So, the maximum NTA is around November 13, not November 3, as mentioned on the mailing list by Robert Lunsford. Interestingly, on November 9, a double radiant structure appeared.
2 Conclusion
CMOR observations allow us to determine the periods of activity of the most noticeable meteor showers, the peak interval of the activity, radiant drift over time and the activity range of the showers. Personal radio observations allow you to monitor the overall level of activity, also to monitor the short-term outburst activity of the showers and to study the activity of the fireballs. The advantage of radio observations is the 24/24 hours monitoring and the independence from weather conditions.
Acknowledgment
I would like to thank Sergey Dubrovsky for the software they developed for data analysis and processing of radio observations. Thanks to Paul Roggemans for his help in the lay-out and the correction of this article. Thanks to, Christian Steyaert, for his help with the data processing.
References
Jones J., Brown P., Ellis K. J., Webster A. R., Campbell-Brown M., Krzemenski Z., and Weryk R. J. (2005). “The Canadian Meteor Orbit Radar: system overview and preliminary results”. Planetary and Space Science, 53, 413–421.
Rendtel Jürgen (2019). “Meteor Shower Calendar”. IMO.


