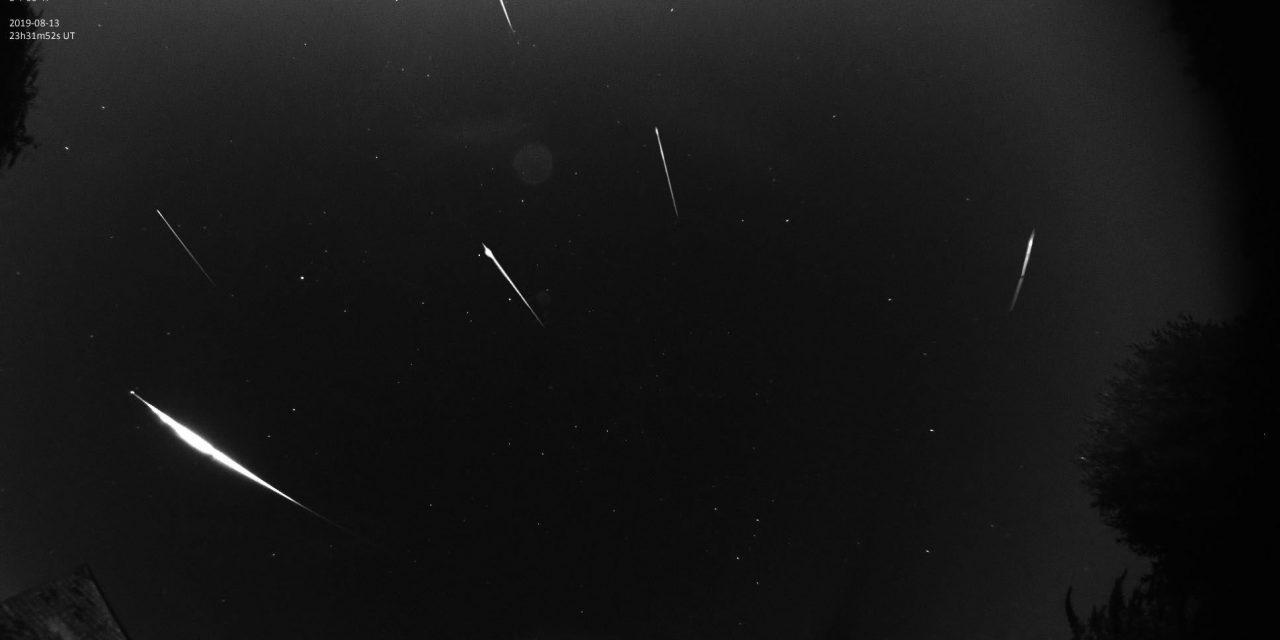
Figure 1. Composition made from images of Perseids in the night 13/14 August 2019 taken with an ASI290MM camera in combination with a 2.5 mm fish eye lens. The recordings were made by Bart Declercq from his observatory in Haaltert, Belgium. The brightest Perseid was magnitude -7 and left behind a persistent train that was visually 1 minute to see.
Koen Miskotte and Michel Vandeputte
Introduction
It is Tuesday morning, August 14, 2018. European meteor observers notice that the Perseids are well active that night. The first author subsequently extensively analyzed the available visual data [1 & 2]. It showed that around the traditional maximum there was some extra activity from bright meteors caused by the Perseid filament. Bigger was the surprise that a serious peak in activity was found on the night of 13/14 August! The maximum felt just before solar longitude 141.0 and had a ZHR of 85. Searching back in old data around the same solar longitude and the same moonlight conditions from 1986, 1994, 2002 and 2010 showed that there were previously peaks in activity around solar longitude 141.0, but the ZHR was not as high as in 2018.
2019: another peak in Perseid activity around solar longitude 141.0?
There was excitement among the authors when the famous radio curve from Hirofumi Sigumoto was online. After the traditional maximum, a second peak in activity was found just after solar longitude 141.0! Unfortunately, a search on the IMO site for visual observational data around solar longitude 141.0 yielded little observations due to moonlight and/or bad weather conditions. In this article we will take a closer look at available radio-, CAMS- and visual meteor observations.
Bruce McCurdy’s observation
The only observation around solar longitude 141.0 (= August 14, 2019 8:00 UT) comes from Bruce McCurdy from Canada. His time interval runs from August 14, 2019 6:04 to 10:22 UT. Unfortunately, due to the combination of moonlight and smoke from wildfires, McCurdy had a low limiting magnitude. He wrote:
“Observed Perseids within +/- 24 hours of the peak for the 32nd consecutive year. Barely. After a long run of crummy weather that wiped out the peak and several nights before, it cleared on the 13th to allow one session of post-peak viewing in the wee hours of the 14th. At that, bright moonlight interacting with incoming forest fire smoke reduced the sky at the “dark site” to urban or at best suburban quality, limiting magnitude about 4.5 at best. Just 27 Perseids observed in 4.0 hours Teff, with a bias towards brighter members (9 of mag -1 or brighter). Better late than never, but better luck next year!”
McCurdy didn’t see Perseids in the first hour, but during the other hours he did. Despite the very poor circumstances, we calculated the data under the motto: better something than nothing. An assumed population index r of 2.00 has been calculated. The results are ZHRs between 40 and 60.
Michel Vandeputte’s observations
Michel (2nd author) was able to observe this night from Belgium (unfortunately Ermelo hometown of first author was cloudy that night) between 23:30 and 03:15 UT (= between solar longitude 140.661 and 140.811). He wrote:
“This night was also clear, actually much better in quality than the previous night. There was some wind this night. First, I had to sleep a little, but was woken up long before my alarm went off caused by a text from Simon Vanderkerken. He had seen a fireball from the car. I couldn’t sleep anymore and decided to go under the starry sky a little earlier. This time I opted for a session on the ridge, given the more stable weather situation. The moonlight seemed many times more disturbing than during 12-13 August. View was focused on the northeast. Observations were done between 23:30 and 3:00 UT. When I started immediately there appeared a grandiose -6 a -7 PER with a long persistent train across the north !! I was able to follow the persistent train for one minute. Even more bright Perseids appeared in that first hour … Perhaps I should have observed a little earlier? I am curious what the all sky cameras will show. For the rest, the activity actually continued quite well. Certainly, in the last hour it was downright good, when the Moon disappeared behind the edge of the forest. Lots of activity, lots of weak stuff! ZHR must certainly have been > 50. The end of the session was one not to forget … a combination of a green-white -2, a +0, a -1 and a -6 Perseïd!! What an end of this session!!”
The question here is, observed Michel this last hour the first increase in activity to the second peak just as in 2018?

Figure 2. The Perseid fireball of August 14, 2019 at 3:14:38 UT (magnitude -6) recorded by Bart Declercq from Haaltert, Belgium. The fireball appeared in the constellation Auriga.
The radio ZHR curve from Hirofumi Sigumoto
Figure 3 shows the radio curve taken from the website of Hirofumi Sugimoto.
http://www5f.biglobe.ne.jp/~hro/Flash/2019/PER/index.html

Figure 3. The Perseid 2019 ZHR curve based on data collected worldwide by RMOB and made by Sugimoto.
The green line shows the ZHR curve based on radio observations from 2018. The way Sugimoto converts radio observations into a visual ZHR curve is described in his article [3] on Meteornews. The peak just after solar longitude 141.0 is clearly visible.
Radio observations by Felix Verbelen (Belgium)
Inquiries with radio observer Felix Verbelen also yielded an interesting observation. Figure 4 shows a comparison between 2018 and 2019. It concerns the radio reflections of more than 10 seconds (counted manually). The hour totals always relate to the past hour and were averaged according to the formula:
N (h) = n (h-1) / 4 + n (h) / 2 + n (h + 1) / 4.
Felix always uses the reflections for longer than 10 seconds because they usually correspond best with the visual observations.

Figure 4. Radio data from the Perseids 2019 of Felix Verbelen with reflections of 10 or more seconds.
It is clearly visible that the activity of the Perseids with reflections of 10 or more seconds in 2019 was higher than in 2018. Unfortunately, his data from 2018 shows no additional activity as observed by European visual observers.
Comparison of CAMS California data from 2018 and 2019


Figure 5. CAMS data from 14 August 2018 (left) and 2019 (right).
We also looked at the CAMS data (worldwide) from 2018 and 2019 (Figure 5). In 2019 we clearly see a much larger amount of Perseids. But unfortunately, this is also the case with the other meteor showers and sporadic meteors. So here unfortunately disruption due to the weather and / or influences of new CAMS networks in the southern hemisphere plays a role here. In order to eliminate weather and new network influences, we also looked at the relationship between the numbers of Perseids and other meteor showers.
Source: http://cams.seti.org/FDL/
Below the well-known images you also get a table with the numbers of meteors for each meteor shower. This determines the percentages between the ratio of Perseids and meteor showers in the night of August 14, 2016, 2018 and 2019. Here again we encountered the problem that the new southern CAMS networks record relatively more meteors from the southern meteor showers such as e.g. from the Aquariid complex or meteorshowers such as the eta Eridanids (in 2017: 4 meteors; in 2018: 2 meteors; in 2019: 36 meteors) and August Omicron Aquariids (in 2017: 4 meteors; in 2018: 12 meteors; in 2019: 43 meteors ). That is why calculations were made without these two meteor showers. The result is shown in Table 1. It is noticeable that the Perseids share on the total amount of meteor showers is virtually the same. So, this way no additional confirmation of higher Perseid activity in 2018 and 2019 compared to 2016. Unfortunately, we can’t do much with the CAMS data in this case.

Table 1. Ratio Perseids and other meteor showers on August 14, 2017, 2018 & 2019.
So what do we know now?
Unfortunately, there is hardly any visual evidence that there was a peak in activity in 2019 at solar length 141.0. In 2018 this peak was well observed. The 2019 radio curve of Sugimoto indicates a significant peak in activity, comparable to the visual peak of 2018. Unfortunately, Sugimoto’s curve from 2018 (figure 6) does not show a peak in activity (Figure 6).

Figure 6. Perseid ZHR curve from 2018 based on
worldwide radio observations (RMOB) and made by Sugimoto.
To see how radio ZHR values relate to individual visual ZHR values, the ZHR values found from the data of Bruce McCurdy and Michel Vandeputte were put together in one graph. The result is figure 7.

Figure 7. The ZHR values found from the data from Bruce McCurdy from Canada (blue dots) and Michel Vandeputte from Belgium (grey triangles) compared to the radio curve from Sugimoto (green points).
Michel Vandeputte’s data fits in nicely with the radio ZHR graph of Sugimoto. The ZHR found from the observation of Bruce McCurdy does not fit well, but does have the highest ZHR around the maximum of the radio ZHR curve. The lower ZHR curve relative to the radio ZHR curve is perhaps due to the greater atmospheric extinction caused by the smoke from the wildfires.
Finally, the shape of the ZHR curve was also examined. For this a graph has been made that combines the radio ZHR curve from 2019 with the visual ZHR curve from 2018. Figure 8 is the result.

Figure 8. Comparison of the visual Perseids 2018 ZHR graph with the radio Perseids 2019 ZHR graph.
It is striking that both peaks are reasonably in agreement in terms of appearance and height. The radio peak fell two hours later in 2019 compared to the visual peak in 2018. The question now arises as to why the radio data from 2018 shows NO peak around solar length 141.0? Perhaps it can be explained by the fact that the visual observations from 2018 show that the r value was almost normal during that peak. The observations of Vandeputte and McCurdy from 2019 suggest brighter Perseids. The radio data from Felix Verbelen seems to support this. Perhaps an explanation is that the radio observation method picks up the bright meteors better than the weak meteors.
Summary and call for observations
It is clear that in 2019 the Perseids show an extra peak in activity around solar longitude 141.0. This is mainly confirmed by radio data and barely by visual observations. In 2019, it seems that the peak was accompanied by somewhat brighter Perseids than in 2018. Therefore, an important call for observers in western North America, the Pacific and East Asia to continue to properly monitor Perseids beyond the traditional maximum! Perhaps another surprise is possible after 2018 and 2019.
The found maximum from 2018 (solar longitude 140.94) appears in 2020 on 13 August at 12:45 UT. It can still be observed from California until around 12:30 to 12:45, so at a peak around 12:45 UT the increasing activity can still be observed well. Also, in north-east Asia it is possible to observe around that time, but the radiant will still be low. If the peak on the found maximum in 2019 (141.02 based on radio data), then that will take place at 14:45 UT. In that case, only the first increase to this peak is visible from California. Australia and East Asia are better locations, although the radiant in Australia naturally remains low.
Acknowledgment
Thanks to Carl Johannink and Paul Roggemans for critically reading this article. Also, a word of thanks to Bruce McCurdy for his observation around solar length 141.0. Hirofumi Sigumoto profided the source material of the Perseid radio ZHR curve.
References
[1] Miskotte K., De Perseïden in 2018: een analyse van de visuele waarneemdata, Radiant 2019-2 blz. 27-35.
[2] Miskotte K., The Perseids in 2018: Analysis of the visual data, Meteornews 2019-3 p. 135-142
[3] Sugimoto H., The new method of estimating the ZHR using radio meteor observations, Meteornews 2017-4 p. 109-110.
