An overview of the radio observations during June 2019 is given.
The graphs show both the daily totals (Figure 2) and the hourly numbers (Figure 3) of manually counted “overdense” reflections, overdense reflections longer than 10 seconds and longer than 1 minute, as observed here at Kampenhout (BE) on the frequency of our VVS-beacon (49.99 MHz) during the month of June 2019.
The hourly numbers, for echoes shorter than 1 minute, are weighted averages derived from:
N(h) = n(h-1)/4 + n(h)/2 + n(h+1)/4
Counting “all” reflections was at times very difficult, if not impossible, due to strong local noise and other interference, and also during periods of intense lightning activity. Especially when thunderstorms occurred in the vicinity of our beacon, counting underdense reflections was practically impossible, since the lightnings showed reflections mostly identical to that of some normal underdense reflections. Figure 1 shows an example of how the SpecLab screen was filled with lightning reflections during one of these thunderstorms near Ieper.
Highlights of the month were as expected the daytime showers that peaked during the first half of the month, while long-lasting reflections were more numerous in the second half. SpecLab pictures of a selection of these are attached.
If you are interested in the actual figures, please send me an e-mail: felix.verbelen at skynet.be.

Figure 1 – Example how the SpecLab screen was filled with lightning reflections during one of these thunderstorms near Ieper.

Figure 2 – The daily totals of manually counted “overdense” reflections, overdense reflections longer than 10 seconds and longer than 1 minute, as observed here at Kampenhout (BE) on the frequency of our VVS-beacon (49.99 MHz) during June 2019.

Figure 3 – The hourly numbers of manually counted “overdense” reflections, overdense reflections longer than 10 seconds and longer than 1 minute, as observed here at Kampenhout (BE) on the frequency of our VVS-beacon (49.99 MHz) during June 2019.

Figure 4 – Echo registered on 5 June 2019 at 00h20m UT.

Figure 5 – Echo registered on 9 June 2019 at 06h00m UT.

Figure 6 – Echo registered on 15 June 2019 at 17h30m UT.

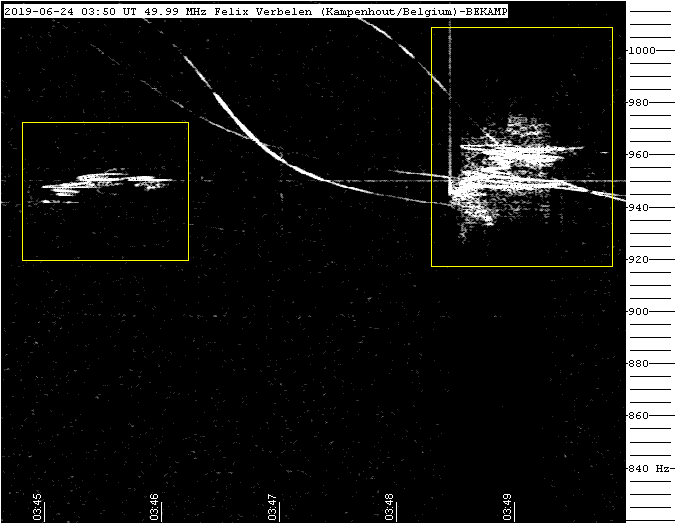
Figure 7 – Echo registered on 24 June 2019 at 03h50m UT.

Figure 8 – Echo registered on 27 June 2019 at 04h25m UT.

Figure 9 – Echo registered on 29 June 2019 at 00h40m UT.

Figure 10 – Echo registered on 30 June 2019 at 04h20m UT.


