Paul Roggemans, Carl Johannink and Peter Cambell-Burns
CAMS BeNeLux collected 37 orbits of the October Camelopardalids in 2018. A stream search on all available video meteor orbits could identify 442 October Camelopardalids orbits. The shower has a compact radiant at R.A. 169° and declination +78° and a velocity of 45 km/s. The velocity displays a significant dispersion with the faster particles at higher inclination and the slower particles at lower inclination. The shower activity displays a very sharp activity profile between solar longitude 192.2° and 192.9° with a sharp maximum at solar longitude 192.55 ± 0.05° with a duration of less than one hour.
1 Introduction
CAMS BeNeLux had clear sky during the night 5–6 October 2018 and registered 37 orbits of the October Camelopardalids, listed as an established shower in the IAU Meteor Data Center as OCT#281. The shower is poorly known.
Carl Johannink identified 37 orbits of the CAMS BeNeLux network in 2018 as October Camelopardalids, slightly more than in 2017 when 16 orbits were identified as October Camelopardalids. These are rather impressive numbers of orbits and therefore the authors decided to dedicate a case study to this shower.

Figure 1 – Screenshot of the CAMS radiant plot for the night of 2018 October 6 with the compact radiants identified as October Camelopardalids (OCT#281). The radiants of the Orionids (red bottom right) and Taurids (blue at the edge at right) are more scattered.
2 History of the October Camelopardalids
The shower got little or no attention and was first documented by Jenniskens (2006) who lists the following likely early visual observations of this stream:
- 1902 October 4 (λʘ = 192.01°) by G. Percy Bailey at Blackburn, United Kingdom, 50 light tracks behind clouds.
- 1942 October 5 (λʘ = 192.7±0.1°) by Dr. Werner Sandner, with a significant meteor shower.
- 1976 October 5, 9:55–11:37 pm EST (λʘ = 193.31–193.38°), E. Root reported 113 meteors moving from North to South.
- 2005 October 5, Jarmo Moilanen (Finland) detected 12 meteors by video with a compact radiant at R. A. = 164.1±2.0° and Decl. = +78.9±0.5°, confirmed by Esko Lyytinen and Illeka Yrjölä (Jenniskens et al., 2005).
Other lists with minor showers such as in Terentjeva (1966, 1968, 2017) do not contain any data about the October Camelopardalids. The IAU Photographic meteor catalogue (Lindblad et al., 2003) lists 4 orbits in 1952, 1954 and 1956 that fulfill our similarity criteria (all four orbits are listed in Table 5). The Harvard radar meteor orbit catalogue 1961–1965 (Verniani, 1973; Sekanina, 1973) has 3 similar orbits according to our criteria, all 3 in 1965. The Harvard radar meteor orbit catalogue 1968–1969 (Verniani, 1973; Sekanina, 1976) lists another 9 similar orbits, according to our D-criteria, all in 1969. We list the orbits that we obtained by our D-criteria as well as the original orbits published in 1973 and 1976. Sekanina (1973; 1976) applied the D-criterion with a very great tolerance with a high risk to include unrelated sporadic orbits. The radar observations were made in series of days with interruptions for some days and for this reason the shower maxima may have been missed in some years. Unfortunately, Sekanina does not list any reference literature for the October Camelopardalids.
The October Camelopardalids were also detected in the meteor shower search on the SonotaCo data for 2007 and 2008 (SonotaCo, 2009) as well as in each year of the CAMS data since 2011, but remains absent in CMOR data.
3 The methodology and orbit data
We have the following orbit data collected over 11 years, status as until July 2018, available for our search:
- EDMOND EU+world with 317830 orbits (until 2016). EDMOND collects data from different European networks which altogether operate 311 cameras (Kornos et al., 2014).
- SonotaCo with 257010 orbits (2007–2017). SonotaCo is an amateur video network with over 100 cameras in Japan (SonotaCo, 2009).
- CAMS with 111233 orbits (October 2010 – March 2013), (Jenniskens et al., 2011). For clarity, the CAMS BeNeLux orbits April 2013 – October 2018 are not included in this dataset because this data is still under embargo.
In total 686073 video meteor orbits are publicly available, most of which can be excluded from any association with October Camelopardalids by their position. Our methodology to detect associated orbits has been explained in a previous case study (Roggemans et al., 2019).
The first step is to assess the outer limits in time, radiant position and velocity range within which orbits of this stream may be found. To establish these outer limits, we take one of the suspect orbits and check the similarity criteria on all 686073 orbits. This results in a set of orbits which serves only to find the outer limits in time, radiant position and velocity range within which these orbits can be found. From this first preliminary selection it appears that any possible October Camelopardalids should have their orbit, radiant position and velocity, within the following range:
- Time interval: 179° < λʘ < 205°;
- Radiant area: 102° < α < 217° & +70° < δ < +88°;
- Velocity: 40 km/s < vg < 52 km/s.
Then we select all orbits available within this time interval, regardless their radiant position or velocity. In total 52049 orbits were available in the considered time interval. This dataset will serve as source for the background activity. From this dataset we select all orbits with a radiant position and geocentric velocity within the limits listed above. Any possible October Camelopardalid orbits will be among this selection. In this case 791 orbits had the radiant and velocity within the interval mentioned above. For any single station observer, either visual or video, all 791 orbits displayed meteors that appeared like perfect October Camelopardalids, from the right radiant area with the right angular velocity.
Since we have the orbital elements we will verify if the orbits can be identified as October Camelopardalids. We use the so-called similarity or discrimination criteria to accept or to reject the identification of an orbit as October Camelopardalids. The similarity criteria consider the distance between some of the orbital elements combined with the angle between the orbital planes. The first numeric discrimination criterion was proposed by Southworth and Hawkins (1963), referred to as DSH. Later Drummond (1981) introduced a slightly different criterion, referred as DD. Jopek (1993) proposed another version DH, based on the former criteria. We can apply all three criteria combined and we define five different classes with specific threshold levels of similarity:
- Low: DSH < 0.25 & DD < 0.105 & DH < 0.25;
- Medium low: DSH < 0.2 & DD < 0.08 & DH < 0.2;
- Medium high: DSH < 0.15 & DD < 0.06 & DH < 0.15;
- High: DSH < 0.1 & DD < 0.04 & DH < 0.1.
- Very high: DSH < 0.05 & DD < 0.02 & DH < 0.05.
Table 1 – The median values for each sub-set of orbits that fulfill DD<0.105, CAMS, SonotaCo, EDMOND and all combined. The orbit from the literature is taken from Jenniskens et al. (2018).
| All | CAMS | SonotaCo | Edmond | Literature | |
| λʘ | 192.6° | 193.9° | 192.7° | 192.55° | 192.5° |
| αg | 169.1° | 169.0° | 168.4° | 169.6° | 170.0° |
| δg | +78.6° | +77.8° | +78.6° | +78.7° | +78.3° |
| vg | 44.9 | 45.0 | 45.6 | 44.6 | 45.8 |
| a | 9.3 | 6.8 | 11.9 | 9.2 | 25.6 |
| q | 0.991 | 0.991 | 0.991 | 0.991 | 0.989 |
| e | 0.893 | 0.853 | 0.917 | 0.892 | 0.961 |
| ω | 168.9° | 168.8° | 169.2° | 168.9° | 168.1° |
| Ω | 192.6° | 193.9° | 192.7° | 192.55° | 192.5° |
| i | 77.1° | 76.8° | 77.8° | 76.3° | 77.5° |
| N | 249 | 18 | 59 | 172 | 14 |
Table 2 – The median values for the final selection of orbits with five different threshold levels on the D-criteria.
| Low | Medium low | Medium high | High | Very high | |
| λʘ | 192.6° | 192.6° | 192.6° | 192.6° | 192.6° |
| αg | 169.1° | 169.2° | 169.2° | 168.4° | 168.7° |
| δg | +78.6° | +78.6° | +78.6° | +78.6° | +78.7° |
| vg | 44.9 | 45.0 | 45.0 | 45.1 | 45.0 |
| a | 9.3 | 9.2 | 10.2 | 10.0 | 9.2 |
| q | 0.991 | 0.991 | 0.991 | 0.991 | 0.991 |
| e | 0.893 | 0.892 | 0.903 | 0.901 | 0.892 |
| ω | 168.9° | 168.7° | 168.7° | 168.7° | 168.7° |
| Ω | 192.6° | 192.6° | 192.6° | 192.6° | 192.6° |
| i | 77.1° | 77.1° | 77.1° | 77.4° | 77.1° |
| N | 249 | 154 | 107 | 53 | 21 |
| % | 31% | 19% | 14% | 7% | 3% |
These classes should allow to compare shower characteristics in function of the reliability of the shower identification. While the low threshold similarity class may include some sporadic orbits that fit the criteria by pure chance, the higher the threshold the less the risk for contamination with sporadic orbits.
The purpose of this case study is to compare results with the previously published results for CAMS. For this reason, the ‘average’ orbit of the stream is obtained in the same way as by Jenniskens et al. (2016), using an ordinary median value for each orbital element. The semi-major axis a and the eccentricity e are ignored in case of hyperbolic orbits. This way a reference orbit for the October Camelopardalids was derived from the selection of 791 orbits. Then this reference orbit was used to recalculate all similarity criteria and new median values were calculated for the orbits that fulfilled these criteria. This procedure was repeated 4 times until the iterations only influenced the insignificant decimals.
A few sub datasets were generated based on the final 249 probable October Camelopardalids orbits for the different sources of data as well as for each class of threshold level. The results are compared in Table 1 and Table 2. The results for the different datasets compare very well, except for the semi major axis a. The semi major axis is very sensitive for the measurement errors on velocity. The scatter on the semi major axis a for the individual orbits is very large and therefore these median values are not relevant. Both CAMS and UFOCapture are limited in accuracy to obtain the velocity of meteors, something that remains a challenge for even the most accurate observing techniques.
Plotting the ecliptic latitude β against the Sun centered longitude λ – λʘ neutralizes the radiant drift due to the movement of the Earth around the Sun. The presence of a concentration of radiants with similar orbits is very clear in Figure 2. The low threshold similarity orbits marked in blue display still a reasonable spread, but most of the October Camelopardalids (OCT#281) orbits form a rather compact radiant.

Figure 2 – Plot of the ecliptic latitude β against the Sun centered longitude λ – λʘ. The different colors represent the 5 different levels of similarity.
If we remove all the radiants that were identified as October Camelopardalids (OCT#281) based on their orbit, as many as 542 radiants remain for which the orbits fail in the similarity criteria (Figure 3). For any single station observer, either visual or video, all these meteors would be identified as October Camelopardalids (OCT#281) because they appear from the radiant area with the right velocity. This means that single station data would have about two third of its shower meteors identified as OCT-281, while the orbits should be considered as sporadics. Of course, a contamination of the sample with 69% erroneously identified October Camelopardalids makes statistics with such sample meaningless.

Figure 3 – Plot of the ecliptic latitude β against the Sun centered longitude λ – λʘ for the 476- orbits from the selection that failed in the similarity criteria.

Figure 4 – Plot of the ecliptic latitude β against the Sun centered longitude λ – λʘ (°) for the 249 OCU orbits that fulfill the low threshold similarity criteria with a color gradient to display the variation in the velocity vg.
If we remove all sporadic orbits and take a close-up of the October Camelopardalids with a color gradient to illustrate the spread in the geocentric velocity, we see a remarkable distribution of the velocity. The slow velocity radiants appear at higher ecliptic latitude (top of Figure 4) with a gradual increase in velocity over the core of the meteor stream towards the highest velocity at lower ecliptic latitude (bottom of Figure 4). This shows the orientation of the dispersion of the particles in the stream. The presence of a concentration of similar orbits is also very well visible in the plot of the inclination i against the length of perihelion Π (Figure 5). The selection of 791 orbits, although each of these orbits produced a meteor that looked like October Camelopardalids, includes a significant number of sporadic orbits, marked as black dots. Removing the shower orbits, we see the sporadic background radiant distribution in Figure 6 which is partially hidden in Figure 5.

Figure 5 – The plot of inclination i (°) against the length of perihelion П (°) for the 791-selected possible OCT-orbits. The colors mark the different threshold levels of the D-criteria relative to the final reference orbit listed in Table 2.

Figure 6 – The plot of inclination i (°) against the length of perihelion П (°) for the 542- orbits from the selection that failed in the similarity criteria.
The dispersion of the velocity found in the Sun centered ecliptic coordinate plot also appears in the plot of the inclination i against the length of perihelion Π (Figure 7). When we plot the geocentric velocity vg versus inclination i for all 249 OCT orbits the geocentric velocity vg increases with 0.45 km/s per degree in inclination (Figure 8). The slower, lower energy particles, got at lower inclination, the faster, accelerated particles, got at higher inclinations. If we look at possible changes in inclination and in geocentric velocity in function of time (solar longitude λʘ), both the inclination i and the velocity vg remain constant throughout the passage of the Earth through the stream. This means that Earth encounters the velocity dispersed particles all along its passage through the October Camelopardalids stream.

Figure 7 – Close-up on the plot of inclination i (°) against the length of perihelion П (°) for the 249 OCT orbits that fulfill the low threshold similarity criteria with a color gradient to display the variation in the velocity vg.

Figure 8 – Plot of the geocentric velocity vg against the inclination i (°).
4 Radiant drift
The radiant of any shower moves eastwards in the sky due to the Earth moving on its orbit around the Sun. By pinpointing the radiant night by night, we can track this radiant drift. In equatorial coordinates the radiant drift in R.A. and declination may differ quite a bit depending upon the source of the data.
We list the radiant drift in Table 3 as derived from the different datasets according to the class of the similarity criteria threshold. The compact nature of the radiant for the medium high and high threshold similarity criteria covers a too short range in solar longitude to make any reliable estimate of the radiant drift. In this case the values for the low and medium low similarity criteria will be the best estimate. Note that the OCT radiant position is at a high declination and that a small angle at the sky makes a large difference in R.A.
Table 3 – Radiant drift with ± σ for the October Camelopardalids obtained from the orbits for each threshold level of the D-criteria.
| Threshold/source | OCT – 281 | |
| Δα / λʘ | Δδ / λʘ | |
| Low | 1.71 ± 0.24 | –0.44 ± 0.03 |
| Medium low | 1.80 ± 0.29 | –0.46 ± 0.05 |
| Medium high | 0.62 ± 0.43 | –0.23 ± 0.05 |
| High | 0.98 ± 1.04 | –0.05 ± 0.03 |
5 The activity profile and maximum
The orbit sample has been collected over 11 years from 2006 until 2016. For 2017 we have only data from the SonotaCo network which missed the OCT activity completely due to bad weather in 2017. In 2016 CAMS BeNeLux registered 4 OCT orbits, few hours after the expected maximum (Johannink, 2016). The CAMS data for 2013 to 2018 which is still under embargo and not included in this case study however confirms a distinct presence of OCT orbits, 1 orbit in 2013, 1 orbit in 2014, 5 orbits in 2015, 8 orbits in 2016, 16 orbits in 2017 and 37 orbits in the 2018 data.
To estimate the activity of the October Camelopardalids relative to the background activity, all Orionid orbits were removed from the dataset. The background activity in each time bin includes all orbits except the Orionid and OCT orbits.

Figure 9 – The percentage of OCT orbits relative to the total number of non-OCT orbits obtained per year for different intervals of its activity period: The blue bars represent the total activity period, 179° < λʘ < 205°, and the red bars stand for the bin with the maximum at 192° < λʘ < 193°.
A weak October Camelopardalids activity has been detected during each year consisting of scattered orbits that fulfil the low and medium low threshold similarity criteria during the activity period of 179° < λʘ < 205° with on average 0.5% of all orbits being OCT orbits. A very sharp peak activity occurs between 192° < λʘ < 193°, the relative activity reaches 12% of the background activity (Figure 9). The sharpness of the OCT peak activity means that this short time interval with the best OCT activity can be easily missed depending on the available capture capacity of camera networks and weather circumstances.
The absence of OCT activity in some years may feed the assumption that the shower is not annual but responsible for periodic outbursts. We find no indications neither for a periodic nature nor for any outbursts in the years covered by this analysis. The years without any OCT peak activity can be easily explained. 2006, 2008 and 2009 had no coverage during 12 hours around the OCT peak. If we look at a narrow window of 12 hours (192.3° < λʘ < 192.8°), the OCT activity made up to ~33% of the total activity in 2010, 2012 and 2015. Three other years with good coverage of the time of the OCT peak, 2011, 2014 and 2016 produced only OCT rates of ~12% of the total activity, while 2007 and 2013 had a relative activity level of ~20%. The OCT activity seems to be quite variable from year to year, but not to an extend that justifies speaking about outbursts. These results are not in line with the expectation according to the model proposed by Lyytinen (2016) but may help to finetune the assumptions used in the model. It is not excluded that the variable nature of this shower produced some outbursts that may explain the past poorly documented reports of 1902, 1942 and 1976.

Figure 10 – The relative number of OCT orbits collected per 1° of solar longitude in steps of 0.5° during the years 2006–2016, with blue for DD < 0.105, green for DD < 0.08, orange for DD < 0.06, red for DD < 0.04 and yellow for DD < 0.02, as percentage compared to the total number of non-OCT orbits without any Orionids, collected in the same time span.
The number of orbits available for each time bin depends on the weather circumstances, number of cameras running, the kind of optics used etc. All these factors are the same for the non-shower orbits as for the shower orbits. The number of shower orbits relative to the number of non-shower orbits as a percentage allows to create a reliable activity profile. The number of shower orbits also depends on the elevation of the radiant above the local horizon. We do not attempt any correction for this. The composition of our sample of orbits is the result of a mixture of orbits collected at many different locations with the radiant at all possible elevations, this way we can consider the sample as representative for an average radiant elevation which remains approximately the same for all considered time bins.
The low threshold orbits (blue) represent outliers and may include some sporadics that just fit the similarity criteria by pure chance. These orbits are detected each year (Figure 10). The resulting activity profile shows a fast increase in activity from λʘ = 192.10° to the peak at λʘ = 192.55° with high rates until λʘ = 192.70°, followed by a steep decline towards λʘ = 192.95°. Beyond this short period only very few OCT orbits can be collected. The OCT maximum occurs in a 6 hours’ time span with peak activity during about one hour. Figure 11 shows the activity profile with a time bin of 0.3° moved forward in steps of 0.05° in solar longitude. This is the best resolution we can afford with the available number of orbits. There are no indications for any sub maxima and the OCT shower appears to produce a single short duration sharp peak that can be easily missed in case of unfavorable observing circumstances.

Figure 11 – The relative number of OCT orbits collected per 0.3° of solar longitude in steps of 0.05° based on the years
2006–2016, with blue for DD < 0.105, green for DD < 0.08, orange for DD < 0.06, red for DD < 0.04 and yellow for DD < 0.02, as percentage of the number of non-OCT orbits collected in the same time span, with the Orionid orbits removed from the sample.
Based on the relative activity profile derived from the numbers of orbits collected on a global scale over 11 years of time, we can pinpoint the time of maximum at λʘ = 192.55 ± 0.05°, with best rates limited to the interval 192.45° to 192.70°, about 6 hours, and the main OCT activity limited to the time bin of. 192.2° until 192.9°. Beyond this short interval only few dispersed OCT orbits can be detected. The time of maximum is exactly what Japanese radio observers obtained in 2016 (Ogawa, 2016) when a peak occurred that lasted less than half an hour.
Single station video and visual observations in 2018 resulted in a maximum at λʘ = 192.45 ± 0.05° (Rendtel and Molau, 2018). Single station data is rather tricky because of the small numbers of meteors which may be affected by sporadics with the right angular velocity but lined up by chance resulting in an activity profile of statistical flutter. However, these efforts by visual observers remain worthwhile to supervise if any real outburst would take place that could allow statistical relevant observations. It is of interest to know for sure that activity remained at or below detectability level while being vigilant for any unusual higher activity.
6 Other shower characteristics
With a geocentric velocity of 45 km/s the October Camelopardalids produce a luminous trajectory in the atmospheric layer between 110 and 93 km elevation. Looking at the median values for the beginning and ending points for each class of threshold level in D-criteria, all results are in a very good agreement (Table 4). We assume that the data providers, CAMS, EDMOND and SonotaCo, list the values obtained from triangulations that represent the real begin, and ending heights. Anyway, by using median values any outliers have little or no influence.
The velocity of the October Camelopardalids is comparable to the April Lyrids. Remarkable enough, although OCT meteors have a slightly lower velocity than the Lyrids (46.1 km/s), the OCT meteors start slightly higher in the atmosphere and end several kilometers sooner than the Lyrids. This could be an indication for a different composition with the October Camelopardalids being composed of more fragile fresh cometary material. This and the short sharp activity profile may indicate a young cometary dust trail left by a yet undiscovered long periodic comet.
Table 4 – Beginning and ending heights with ± σ for the October Camelopardalids obtained from the trajectories for each threshold level of the D-criteria.
| Threshold level | OCT – 281 | |
| Hbeg | Hend | |
| Low | 105.0 ± 4.9 km | 93.3 ± 6.5 km |
| Medium low | 106.0 ± 4.6 km | 94.2 ± 6.1 km |
| Medium high | 106.8 ± 4.3 km | 95.0 ± 5.7 km |
| High | 107.6 ± 3.0 km | 94.9 ± 5.1 km |
| Very high | 108.5 ± 2.3 km | 96.0 ± 3.4 km |

Figure 12 – Magnitude distribution per half magnitude class based on the absolute magnitudes of October Camelopardalids.
Our sample of 249 October Camelopardalids orbits had an average absolute magnitude, brightest and faintest value of –1.1 [–5.8; +2.1]. The magnitude distribution as a percentage of the total number of October Camelopardalids is shown in Figure 12. There are no exceptional fireballs included and there is no evidence for any exceptional brightness or anything that could point to a fireball stream. Nothing excludes that this shower produced outbursts with many bright meteors in the past, but the data covered here has no indication for this.

Figure 13 – Average absolute magnitude for the overall meteor activity (blue) and the October Camelopardalids (orange) per 3° in solar longitude with a step of 0.5° in solar longitude.
If we calculate the average absolute magnitude for each interval of 3.0° in solar longitude with a step of 0.5° solar longitude for all non-OCT meteors, without Orionids in the considered period and for all 249 OCT orbits, we see that the October Camelopardalids are about 0.3 magnitude brighter than the overall meteor activity (Figure 13). The best average brightness occurs near the shower maximum. Away from the core of the shower the OCT meteors are just slightly brighter on average than the background activity.
7 October Camelopardalids orbits
Table 5 lists all the relevant orbits that we could find for the October Camelopardalids (OCT#281) meteor stream. In most cases it is not clear which similarity criteria were applied to establish the orbit. Therefore, for this case study we list the reference orbits for the different threshold levels.


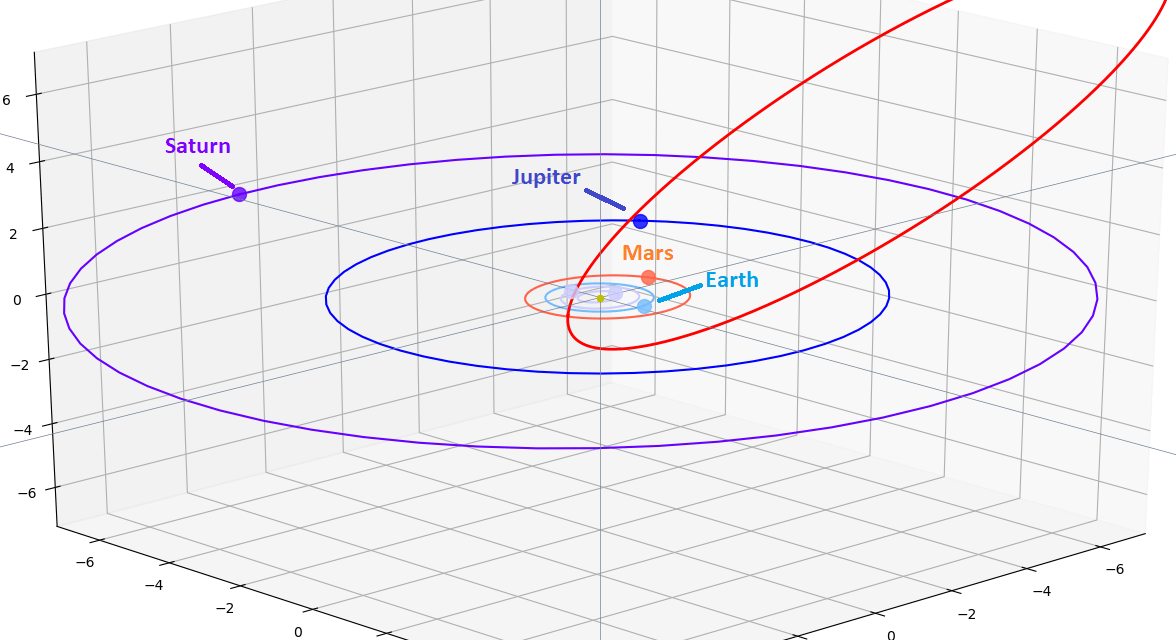
Figure 14 – The October Camelopardalid orbit (This study <0.04) as seen from north of the ecliptic, overview (top) and close-up near the Earth orbit (bottom).
The orbit of the October Camelopardalids suggests a long periodic comet as parent body, perhaps a Halley type comet. The parent body remains to be discovered and perhaps the dust trail may provide some indications where and when to expect this comet at its perihelion, if it still exists. The shower characteristics indicate relative fresh volatile cometary material. Any irregular annual activity of the OCT meteor stream may be a hint for the presence of a fresh dust trail related to the parent comet or its remnants. Careful annual monitoring is strongly recommended.

Figure 15 – The October Camelopardalid orbit (This study <0.04) as seen from above the orbital plane of the shower.
Table – 5 The orbital data for the OCT #281 all J2000. The data marked with (*) refers to Jenniskens et al. (2018), (°) refers to Lindblad et al. (2003), (!) are references with epoch 1950.0.
| λʘ(°) | αg(°) | δg(°) | Δα (°) | Δδ (°) | vg km/s | a AU | q AU | e | ω (°) | Ω (°) | i (°) | N | Source |
| 199.4 | 182.4 | +81.0 | – | – | 42.1 | 5.5 | 0.998 | 0.818 | 179.4 | 199.4 | 72.0 | P | 254H1 (1952) (°!) |
| 192.8 | 132.9 | +77.7 | – | – | 48.6 | 7.4 | 0.999 | 0.863 | 178.1 | 192.8 | 85.5 | P | 065D1 (1954) (°!) |
| 198.4 | 179.1 | +73.0 | – | – | 46.2 | 44.8 | 0.973 | 0.978 | 161.6 | 198.4 | 77.7 | P | 011P1 (1956) (°!) |
| 200.5 | 188.5 | +80.5 | – | – | 42.7 | 9.9 | 0.997 | 0.899 | 179.0 | 200.5 | 72.0 | P | 313S1 (1956) (°!) |
| 195.6 | 189.7 | +79.2 | – | – | 38.0 | 2.5 | 0.992 | 0.610 | 169.7 | 195.6 | 67.1 | 22 | Sekanina (1973)(!) |
| 195.2 | 168.5 | +81.0 | – | – | 42.9 | 4.7 | 0.997 | 0.786 | 176.6 | 195.2 | 74.4 | 15 | Sekanina (1976)(!) |
| 195.7 | 196 | +79 | – | – | 42.5 | 5.4 | 0.989 | 0.810 | 171.1 | 195.7 | 70.2 | 3 | Radar 1965 (!) |
| 194.0 | 163 | +81 | – | – | 46.1 | 5.7 | 0.996 | 0.825 | 173.1 | 194.0 | 78.1 | 9 | Radar 1969 (!) |
| 193 | 166.0 | +79.1 | – | – | 46.6 | 368 | 0.993 | – | 170.6 | 192.57 | 78.6 | Jenniskens (2006) | |
| 197.1 | 163.3 | +76.7 | -0.93 | -0.13 | 45.3 | 10 | SonotaCo (2009) | ||||||
| 192.6 | 170.0 | +79.5 | – | – | 45.3 | 17.5 | 0.993 | 0.943 | 170.6 | 192.6 | 76.8 | 1 | 2013 (*) |
| 192.7 | 167.8 | +78.7 | – | – | 45.8 | 21.2 | 0.991 | 0.953 | 169.3 | 192.6 | 77.8 | 6 | 2014 (*) |
| 192.6 | 168.1 | +79.0 | – | – | 46.8 | – | 0.992 | 1.026 | 170.2 | 192.6 | 78.5 | 13 | 2015 (*) |
| 192.5 | 170.0 | +78.3 | – | – | 45.8 | 25.6 | 0.989 | 0.961 | 168.1 | 192.5 | 77.5 | 14 | 2016 (*) |
| 192.7 | 347 | 0.994 | 0.997 | 171.4 | 192.66 | 78.7 | 1 | Lyytinen (2016) | |||||
| 192.6 | 169.1 | +78.6 | 1.72 | -0.44 | 44.9 | 9.3 | 0.991 | 0.893 | 168.9 | 192.6 | 77.1 | 249 | This study (<0.105) |
| 192.6 | 169.2 | +78.6 | 1.80 | -0.46 | 45.0 | 9.2 | 0.991 | 0.892 | 168.7 | 192.6 | 77.1 | 154 | This study (<0.08) |
| 192.6 | 169.2 | +78.6 | 0.62 | -0.23 | 45.0 | 10.2 | 0.991 | 0.903 | 168.7 | 192.6 | 77.1 | 107 | This study (<0.06) |
| 192.6 | 168.4 | +78.6 | 0.99 | -0.05 | 45.1 | 10.0 | 0.991 | 0.901 | 168.7 | 192.6 | 77.4 | 53 | This study (<0.04) |
| 192.6 | 168.7 | +78.7 | – | – | 45.0 | 9.2 | 0.991 | 0.892 | 168.7 | 192.6 | 77.1 | 21 | This study (<0.02) |
8 Conclusion
This case study confirms the October Camelopardalids (OCT#281) meteor stream as annual minor meteor shower with a very sharp maximum at λʘ = 192.55 ± 0.05° which may last less than 1 hours. The activity profile rises steep to its maximum and most of the activity is limited to the time bin in solar longitude from 192.2° until 192.9°. There is a significant spread in velocity with slower particles at lower inclination and the faster ones at higher inclination. The cause of this distribution remains to be explained.
The October Camelopardalids (OCT#281) orbit is typical for long periodic comets and its parent body remains to be discovered. This shower should be monitored on annual bases.
Acknowledgment
The authors are very grateful to Jakub Koukal for updating the dataset of EDMOND with the most recent data, to SonotaCo Network (Simultaneously Observed Meteor Data Sets SNM2007–SNM2017), to CAMS (2010–2013) and to all camera operators involved in these camera networks.
We thank Denis Vida for providing us with a tool to plot a color gradient to show the dispersion in.
EDMOND (https://fmph.uniba.sk/microsites/daa/daa/veda-a-vyskum/meteory/edmond/) includes: BOAM (Base des Observateurs Amateurs de Meteores, France), CEMeNt (Central European Meteor Network, cross-border network of Czech and Slovak amateur observers), CMN (Croatian Meteor Network or HrvatskaMeteorskaMreza, Croatia), FMA (Fachgruppe Meteorastronomie, Switzerland), HMN (Hungarian Meteor Network or Magyar Hullocsillagok Egyesulet, Hungary), IMO VMN (IMO Video Meteor Network), MeteorsUA (Ukraine), IMTN (Italian amateur observers in Italian Meteor and TLE Network, Italy), NEMETODE (Network for Meteor Triangulation and Orbit Determination, United Kingdom), PFN (Polish Fireball Network or Pracownia Komet i Meteorow, PkiM, Poland), Stjerneskud (Danish all-sky fireball cameras network, Denmark), SVMN (Slovak Video Meteor Network, Slovakia), UKMON (UK Meteor Observation Network, United Kingdom).
References
Drummond J. D. (1981). “A test of comet and meteor shower associations”. Icarus, 45, 545–553.
Jenniskens, P., Moilanen, J., Lyytinen, E., Yrjölä, I and Brower, J. (2005). “The 2005 October 5 outburst of October Camelopardalids”. WGN, Journal of the International Meteor Organization, 33, 125–128.
Jenniskens P. (2006). Meteor Showers and their Parent Comets. ISBN 0521853494. Cambridge, UK: Cambridge University Press. Pages 528–530.
Jenniskens P., Gural P. S., Grigsby B., Dynneson L., Koop M. and Holman D. (2011). “CAMS: Cameras for Allsky Meteor Surveillance to validate minor meteor showers”. Icarus, 216, 40–61.
Jenniskens P., Nénon Q., Albers J., Gural P. S., Haberman B., Holman D., Morales R., Grigsby B. J., Samuels D. and Johannink C. (2016). “The established meteor showers as observed by CAMS”. Icarus, 266, 331–354.
Jenniskens P., Baggaley J., Crumpton I., Aldous P., Pokorny P., Janches D., Gural P. S., Samuels D., Albers J., Howell A., Johannink C., Breukers M., Odeh M., Moskovitz N., Collison J. and Ganjuag S. (2018). “A survey of southern hemisphere meteor showers”. Planetary Space Science, 154, 21–29.
Johannink C. (2016). “CAMS BeNeLux contributed 4 OCT orbits”. eMetN, 1, 137.
Johannink C. (2018). “October Camelopardalids activity recorded by CAMS”. eMetN, 3, 19–20.
Jopek T. J. (1993). “Remarks on the meteor orbital similarity D-criterion”. Icarus, 106, 603–607.
Kornoš L., Matlovič P., Rudawska R., Tóth J., Hajduková M. Jr., Koukal J. and Piffl R. (2014). “Confirmation and characterization of IAU temporary meteor showers in EDMOND database”. In Jopek T. J., Rietmeijer F. J. M., Watanabe J., Williams I. P., editors, Proceedings of the Meteoroids 2013 Conference, Poznań, Poland, Aug. 26-30, 2013. A.M. University, pages
225–233.
Lindblad B.A., Neslusan L., Porubcan V., Svoren J. (2003). “IAU meteor database of photographic orbits version 2003”. Earth, Moon and Planets, 93, 249–260.
Lyytinen E. (2016). “October Camelopardalids outburst model comparisons in the years 2005, 2016 and 2017”. eMetN, 1, 135–136.
Ogawa H. (2016). “Radio meteor observations in the world: Monthly report for October 2016”. eMetN, 1, 151–152.
Rendtel J. and Molau S. (2018). “October Camelopardalid outburst 2018 October 6”. WGN, Journal of the International Meteor Organization, 46, 173–175.
Roggemans p., Johannink C. and Cambell-Burns P. (2019). “October Ursae Majorids (OCU#333)”. eMetN, 4, 55–64.
Sekanina Z. (1973). “Statistical model of meteor streams. III Stream search among 19303 radio meteors”. Icarus, 18, 253–284.
Sekanina Z. (1976). “Statistical model of meteor streams. IV. A study of radio streams from the synoptic year”. Icarus, 27, 265–321.
SonotaCo (2009). “A meteor shower catalog based on video observations in 2007-2008”. WGN, Journal of the International Meteor Organization, 37, 55–62.
Southworth R. R. and Hawkins G. S. (1963). “Statistics of meteor streams”. Smithson. Contrib. Astrophys., 7, 261–286.
Terentjeva A. K. (1966). “Minor meteor streams”. Results of researches of international geophysical projects: Meteor Investigations. N° 1, Publishing House “Nauka”, pages 62–132, Moscow.
Terenteva A. K. (1968). “Investigation of minor meteor streams”. In, Lubor Kresak and Peter Mackenzie Millman, editors, Physics and dynamics of meteors. Symposium no. 33 held at Tatranska Lomnica, Czechoslovakia, 4-9 September 1967. Dordrecht, D. Reidel, 408–427.
Terentjeva A. K. (2017). “Meteor streams study of 1966”. eMetN, 2, 95.
Verniani F. (1973). “An analysis of the physical parameters of 5759 faint radio meteors”. J. Geophys. Res., 78, 8429–8462.
