By Paul Roggemans, Carl Johannink and Peter Cambell-Burns
The October Ursae Majorids caught attention with a significant number of orbits in the period 2006-2017. This study could identify 442 October Ursae Majorid orbits. The shower displays a compact radiant at R.A. 145° and dec. +64° and a velocity of 55.2 km/s. The velocity displays a significant dispersion with the faster particles at higher inclination and the slower particles at lower inclination. The shower activity displays a skew activity profile between solar longitude 201° and 206° with a sharp maximum at 202.05° ± 0.10°. The shower appears to be rich in bright meteors, including fireball events. The shower displays an annual activity without any indication for periodic outbursts.
1 Introduction
The nights 14–15 and 15–16 October 2018 had clear sky for the BeNeLux and apart from many Orionid and Taurid orbits, another less known shower caught attention, the October Ursae Majorids, listed as an established shower in the IAU Meteor Data Center, identified as OCU#333.

Figure 1 – Screenshot of the CAMS radiant plot for the night of 2018 October 16 with the compact radiants identified as October Ursae Majorids (OCU#333). The radiants of the Orionids (red near the center) and Taurids (blue at the edge at right) are more scattered.
Carl Johannink identified 83 orbits of the CAMS BeNeLux network in 2018 as October Ursae Majorids, slightly more than in 2017 when 73 orbits were identified as October Ursae Majorids. In total CAMS BeNeLux collected 211 October Ursae Majorids’ orbits, the orbits derived from these are listed in Table 5. These are rather impressive numbers of orbits and therefore the authors decided to dedicate a case study to this shower.
2 History of the October Ursae Majorids
The Japanese meteor observer, Satoshi Uehara, noticed the October Ursae Majorids on October 16, 2006, as some meteors radiated from a compact area at R.A. 144° and Dec. +64° (Uehara et al., 2006). SonotaCo (2009) continued investigations and found a few extra orbits. Their results are listed in Table 5.
Looking for older recorded orbits that might match the October Ursae Majorid orbits, we found 3 look alike orbits in the Photographic meteor orbit catalogue. Only one orbit fulfills our similarity test, an orbit recorded in the night 13–14 October 1958 with identification 022K1 (Dem’yanenko et al., 1964). This orbit is also listed in a list of meteor showers collected and documented by
Dr. A.Terentjeva, published in 1966 where this shower was already recognized and listed as shower number 135, the σ-Ursa Majorids (σ-Урса-Майориды) (Terentjeva, 1966, 2017), which means Dr. Alexandra Terentjeva was the first to identify this shower. The Harvard radar meteor orbit catalogues 1961-1965 (Verniani, 1973; Sekanina, 1973) has no similar orbits and only two possible OCU orbits were found, both recorded in 1969 (Verniani, 1973; Sekanina, 1976).
CMOR data covering 2001–2008 (Brown et al., 2010) detected orbits of this shower during only 3 days. The shower appears in the meteor stream searches of CAMS, listed among the long periodic comet meteor streams (Jenniskens et al., 2016). Eight out of nine October Ursae Majorids were recorded in the night of October 15, 2012, while the shower was almost absent in 2011 under good observing circumstances. Therefore, the shower was assumed to be in outburst in 2012 and thus not an annual shower.
3 The methodology and orbit data
We have the following orbit data collected over 11 years, status as until July 2018, available for our search:
- EDMOND EU+world with 317830 orbits (until 2016). EDMOND collects data from different European networks which altogether operate 311 cameras (Kornos et al., 2014).
- SonotaCo with 257010 orbits (2007–2017). SonotaCo is an amateur video network with over 100 cameras in Japan (SonotaCo, 2009).
- CAMS with 111233 orbits (October 2010 – March 2013), (Jenniskens et al., 2011). For clarity, the CAMS BeNeLux orbits April 2013 – October 2018 are not included in this data-set because this data is still under embargo.
In total 686073 video meteor orbits are publicly available, most of which can be excluded from any association with October Ursae Majorids by their position. Our methodology to detect associated orbits has been slightly modified compared to previous case studies. The current method works as follows.
The first step is to assess the outer limits in time, radiant position and velocity range within which orbits of this stream may be found. To establish these outer limits, we take one of the suspect orbits and check the similarity criteria on all 686073 orbits. This results in a set of orbits which serves only to find the outer limits in time, radiant position and velocity range within which similar orbits can be found. From this first preliminary selection it appears that any possible October Ursae Majorids should have their orbit, radiant position and velocity, within the following limits:
- Time interval: 189° < λʘ < 214°;
- Radiant area: 123° < α < 169° & +56° < δ < +72°;
- Velocity: 49 km/s < vg < 61 km/s.
Then we select all orbits available within this time interval, regardless their radiant position or velocity. In total 65478 orbits were available in the considered time interval. This data-set will serve as source for the background activity. From this data-set we select all orbits with a radiant position and geocentric velocity within the range established above. Any possible October Ursae Majorids orbits will be among this selection. In this case 918 orbits had the radiant and velocity within the interval mentioned above. For any single station observer, either visual or video, all 918 orbits displayed meteors that appeared like perfect October Ursae Majorids, from the right radiant area with the right angular velocity.
Since we have the orbital elements we will verify if the orbits can be identified as October Ursae Majorids. We use the so-called similarity or discrimination criteria to accept or to reject the identification of an orbit as October Ursae Majorids. The similarity criteria consider the distance between some of the orbital elements combined with the angle between the orbital planes. The first numeric discrimination criterion was proposed by Southworth and Hawkins (1963), referred to as DSH. Later Drummond (1981) introduced a slightly different criterion, referred as DD. Jopek (1993) proposed another version DH, based on the former criteria. We can apply all three criteria combined:
First, we determine Γ

Then we calculate ψ, the angle between the two orbital planes from:
![]()
Next, we calculate Π, the angle between the perihelion points:

λ is the ecliptic longitude of the perihelion, with ![]() β is the ecliptic latitude of the perihelion, with
β is the ecliptic latitude of the perihelion, with
![]() where λ has 180° added if cos ω < 0.
where λ has 180° added if cos ω < 0.
The angle θ between the two perihelion points on each orbit is given by the equation:

The three different discriminant criteria can now be calculated from the following equations, with DSH for the Southworth Hawkins criterion, DD for the Drummond criterion and DH for the Jopek criterion:
The larger the values of ψ, Π or θ, the bigger the ‘distances’ between the orbits and the less the probability becomes for an association. Related orbits have values in the order of a few degrees. The final values for these similarity criteria are dimensionless numeric values, where 0 represents identical orbits. The smaller the D-values the higher the degree of similarity and the better the probability becomes for an association. The D criteria cannot be applied without caution. It remains a way to find similarity between different orbits, without providing any prove for some physical relationship between the orbits. It is an approach in the sense of best effort, while it must be applied with caution in certain circumstances.
The D-criteria that we use are these of Southworth and Hawkins (1963), Drummond (1981) and Jopek (1993) combined. We define five different classes with specific threshold levels of similarity:
- Low: DSH < 0.25 & DD < 0.105 & DH < 0.25;
- Medium low: DSH < 0.2 & DD < 0.08 & DH < 0.2;
- Medium high: DSH < 0.15 & DD < 0.06 & DH < 0.15;
- High: DSH < 0.1 & DD < 0.04 & DH < 0.1.
- Very high: DSH < 0.05 & DD < 0.02 & DH < 0.05.
These classes should allow to compare shower characteristics in function of the reliability of the shower identification. While the low threshold similarity class may include some sporadic orbits that fit the criteria by pure chance, the higher the threshold the less the risk for contamination with sporadic orbits.
Table 1 – The median values for each sub-set of orbits that fulfil DD<0.105, CAMS, SonotaCo, EDMOND and all combined. The orbit from the literature is taken from Jenniskens et al. (2016).
| CAMS | SonotaCo | Edmond | All | Literature | |
| λʘ | 203.2° | 202.6° | 202.4° | 202.5° | 202.0° |
| αg | 146.0° | 145.2° | 145.1° | 145.3° | 145.0° |
| δg | +64.3° | +64.1° | +64.0° | +64.1° | +64.8° |
| vg | 55.5 | 55.6 | 54.9 | 55.2 | 55.6 |
| a | 11.9 | 11.0 | 7.8 | 8.8 | 12.63 |
| q | 0.979 | 0.980 | 0.978 | 0.979 | 0.982 |
| e | 0.917 | 0.911 | 0.874 | 0.889 | 0.967 |
| ω | 164.6° | 165.0° | 163.8° | 164.3° | 165.9° |
| Ω | 203.2° | 202.6° | 202.4° | 202.5° | 202.2° |
| i | 100.8° | 101.0° | 100.6° | 100.8° | 100.6° |
| N | 35 | 160 | 247 | 442 | 9 |
The purpose of this case study is to compare results with the previously published results for CAMS. For this reason, the ‘average’ orbit of the stream is obtained in the same way as by Jenniskens et al. (2016), using an ordinary median value for each orbital element. The semi-major axis a and the eccentricity e are ignored in case of hyperbolic orbits. This way a reference orbit for the October Ursae Majorids was derived from the selection of 918 orbits. Then this reference orbit was used to recalculate all similarity criteria and new median values were calculated for the orbits that fulfilled these criteria. This procedure was repeated 4 times until the iterations only influenced the insignificant decimals.
A few sub data-sets were generated based on the final 442 probable October Ursae Majorids orbits for each class of threshold level as well as for the different sources of data. The results are compared in Table 1 and Table 2. The results for the different data-sets compare very well, except for the semi major axis a. The semi major axis is very sensitive for the measurement errors on velocity. The scatter on the semi major axis a for the individual orbits is very large and therefore these median values are not relevant. Both CAMS and UFOCapture are limited in accuracy to obtain the velocity of meteors, something that remains a challenge for even the most accurate observing techniques.
Table 2 – The median values for the final selection of orbits with five different threshold levels on the D-criteria.
| Low | Medium low | Medium high | High | Very high |
|
| λʘ | 202.5° | 202.6° | 202.5° | 202.4° | 202.2° |
| αg | 145.3° | 145.4° | 144.5° | 145.4° | 144.6° |
| δg | +64.1° | +64.1° | +64.2° | +64.2° | +64.2° |
| vg | 55.2 | 55.2 | 55.2 | 55.2 | 55.1 |
| a | 8.8 | 9.8 | 11.0 | 11.0 | 10.0 |
| q | 0.979 | 0.979 | 0.979 | 0.979 | 0.979 |
| e | 0.889 | 0.900 | 0.912 | 0.911 | 0.903 |
| ω | 164.3° | 164.3° | 164.2° | 164.3° | 164.2° |
| Ω | 202.5° | 202.6° | 202.5° | 202.3° | 202.2° |
| i | 100.8° | 100.8° | 100.6° | 100.8° | 100.4° |
| N | 442 | 331 | 237 | 141 | 43 |
| % | 48% | 36% | 26% | 15% | 5% |

Figure 2 – Plot of the ecliptic latitude β against the Sun centred longitude λ – λʘ. The different colors represent the 5 different levels of similarity.
Plotting the ecliptic latitude β against the Sun centered longitude λ – λʘ neutralizes the radiant drift due to the movement of the Earth around the Sun. The presence of a concentration of radiants with similar orbits is very clear in Figure 2. The low threshold similarity orbits marked in blue display still a reasonable spread, but most of the October Ursae Majorids (OCU#333) orbits form a rather compact radiant.

Figure 3 – Plot of the ecliptic latitude β against the Sun centered longitude λ – λʘ for the 476- orbits from the selection that failed in the similarity criteria.

Figure 4 – Plot of the ecliptic latitude β against the Sun centered longitude λ – λʘ (°) for the 442 OCU orbits that fulfill the low threshold similarity criteria with a color gradient to display the variation in the velocity vg.
If we remove all the radiants that were identified as October Ursae Majorids (OCU#333) based on their orbit, as many as 476 radiants remain for which the orbits fail in the similarity criteria (Figure 3). For any single station observer, either visual or video, all these meteors would be identified as October Ursae Majorids (OCU#333) because they appear from the radiant area with the right velocity. This means that single station data would have more than half of its shower meteors identified as OCU-333, while the orbits should be considered as sporadics. Of course, a contamination of the sample with 52% erroneously identified October Ursae Majorids makes statistics with such single station sample meaningless. To make the situation worse, single station data will have even more sporadic contamination due to meteors that line up with the assumed radiant position by pure chance as seen from a given site, while its true radiant is somewhere else on its backwards produced path at the sky. Therefore, it makes no sense to do visual counts for low activity minor showers, or even major showers when the activity is still under a certain minimal level of statistical relevance. For visual observers plotting errors or estimation errors will make the situation even worse so that shower identification becomes more like gambling.
If we remove all sporadic orbits and take a close-up of the October Ursae Majorids with a color gradient to illustrate the spread in the geocentric velocity we see a remarkable distribution of the velocity. The slow velocity radiants appear at higher ecliptic latitude (top of Figure 4) with a gradual decrease in velocity over the core of the meteor stream towards the highest velocity at lower ecliptic latitude (bottom of Figure 4). This shows the orientation of the dispersion of the particles in the stream. The presence of a concentration of similar orbits is also very well visible in the plot of the inclination i against the length of perihelion Π (Figure 5). The selection of 918 orbits, although each of these orbits produced a meteor that looked like October Ursae Majorids, includes a significant number of sporadic orbits, marked as black dots. Removing the shower orbits, we see the sporadic background radiant distribution in Figure 6 hidden in Figure 5.

Figure 5 – The plot of inclination i (°) against the length of perihelion П (°) for the 918-selected possible OCU-orbits. The colors mark the different threshold levels of the D-criteria relative to the final reference orbit listed in Table 2.

Figure 6 – The plot of inclination i (°) against the length of perihelion П (°) for the 476 orbits from the selection that failed in the similarity criteria.

Figure 7 – Close-up on the plot of inclination i (°) against the length of perihelion П (°) for the 442 OCU orbits that fulfill the low threshold similarity criteria with a color gradient to display the variation in the velocity vg.

Figure 8 – Plot of the geocentric velocity vg against the inclination i (°).
The dispersion of the velocity found in the Sun centered ecliptic coordinate plot also appears in the plot of the inclination i against the length of perihelion Π (Figure 7). When we plot the geocentric velocity vg versus inclination i for all 442 OCU orbits the geocentric velocity vg increases with 0.39 km/s per degree in inclination (Figure 8). The slower, lower energy particles, got at lower inclination, the faster, accelerated particles, got at higher inclinations. If we look at possible changes in inclination and in geocentric velocity in function of time (solar longitude λʘ), both the inclination i and the velocity vg remain almost constant throughout the passage of the Earth through the stream. This means that Earth encounters the velocity dispersed particles all along its passage through the October Ursae Majorid stream.
4 Radiant drift
The radiant of any shower moves eastwards in the sky due to the Earth moving on its orbit around the Sun. By pinpointing the radiant night by night, we can track this radiant drift. In equatorial coordinates the radiant drift in R.A. and declination may differ quite a bit depending upon the source of the data. Therefore, we list the radiant as derived from the different data-sets according to the class of the similarity criteria threshold.
Table 3 – Radiant drift with ± σ for the October Ursae Majorids obtained from the orbits for each threshold level of the D-criteria compared with a reference from literature.
| Threshold/source | OCU – 333 | |
| Δα / λʘ | Δδ / λʘ | |
| Low | 1.40 ± 0.06 | –0.25 ± 0.03 |
| Medium low | 1.57 ± 0.08 | –0.35 ± 0.04 |
| Medium high | 1.96 ± 0.11 | –0.38 ± 0.06 |
| High | 1.68 ± 0.14 | –0.40 ± 0.08 |
| Very high | 1.72 ± 0.23 | –0.31 ± 0.12 |
| Jenniskens et al. (2016) | 1.39 | –0.33 |
5 The activity profile and maximum
The orbit sample has been collected over 11 years from 2007 until 2017. To estimate the relative activity of the October Ursae Majorids relative to the background activity, we had a problem with the variable Orionid activity in the sample. Therefore, all Orionid orbits were removed. The background activity in each time bin includes all orbits except the OCU orbits and Orionid orbits. The background meteor activity should be as much as possible free of variable sources of activity to avoid to measure the shower activity level relative to a composite of different variable sources of activity. A method such as for meteor echo counts should be avoided as it makes no sense to compare a variable shower activity with a complex variable background.
October Ursae Majorid orbits were collected in each year during the activity period of 189° < λʘ < 214° with on average 0.9% of all orbits. Focusing on the time bin with the shower maximum 201.5° < λʘ < 202.5°, the relative activity on average reaches 7.1% of the background activity (Figure 9). Taking a narrower time bin around the time of the maximum, 201.75° < λʘ < 202.25°, the relative activity reaches 8.3%. The variation from year to year in maximum activity can be explained by the rather poor coverage of the time bin around the maximum in some years. The peak maximum was missed completely in 2008. From the total number of orbits available for the time bin with the maximum 201.75° < λʘ < 202.25°, we can see that only the years 2011, 2012, 2014 and 2015 had good coverage. The assumption proposed by Dr. Jenniskens (2016) that the OCU aren’t annual because CAMS collected most OCU orbits in 2012 and nothing in 2011, cannot be confirmed since OCU orbits were collected in all years based on our data-set which includes Japanese and European networks’data. Checking the CAMS data in detail, the reason why CAMS did have no OCU orbits in 2011 was mainly because the maximum night was missed in 2011 while for some reason most of the CAMS OCU orbits that fulfill our similarity criteria, even those with a very good similarity were not identified as OCU orbits in the CAMS data. It seems that the shower was not taken into account at all in 2011.

Figure 9 – The percentage of OCU orbits relative to the total number of non-OCU orbits obtained per year for different intervals of its activity period: Total activity period 189° < λʘ < 214°, blue and the bin with the maximum at 201.5° < λʘ < 202.5° (red).
Unpublished CAMS BeNeLux results show a strong presence of OCU orbits in both 2017 and 2018 data. Unfortunately, the maximum and most of this shower activity was missed by the Japanese SonotaCo network due to bad weather in 2017. We wait for the release of 2017, 2018 EDMOND data and 2018 SonotaCo data to check if the OCU activity was higher than usual in 2017 and 2018.

Figure 10 – The relative number of OCU orbits collected per 1° of solar longitude in steps of 0.5° during the years 2007–2017, with blue for DD < 0.105, green for DD < 0.08, orange for
DD < 0.06, red for DD < 0.04 and yellow for DD < 0.02, as percentage compared to the total number of non-OCU orbits without any Orionids, collected in the same time span.
The number of orbits available for each time bin depends on the weather circumstances, number of cameras running, the kind of optics used etc. All these factors are the same for the non-shower orbits as for the shower orbits. The number of shower orbits relative to the number of non-shower orbits as a percentage results in a fairly reliable activity profile. The number of shower orbits also depends on the elevation of the radiant above the local horizon. We do not attempt any correction for this. The composition of our sample of orbits is the result of a mixture of orbits collected at many different locations with the radiant at all possible elevations, this way we can consider the sample as representative for an average radiant elevation which remains approximately the same for all considered time bins.

Figure 11 – The relative number of OCU orbits collected per 0.25° of solar longitude in steps of 0.05° based on the years
2007–2017, with blue for DD < 0.105, green for DD < 0.08, orange for DD < 0.06, red for DD < 0.04 and yellow for DD < 0.02, as percentage of the number of non-OCU orbits collected in the same time span, with the Orionid orbits removed from the sample.
The activity is made up of mainly medium high and higher threshold level orbits. The low threshold orbits (blue) which represent outliers that may include sporadics that just fit the similarity criteria by pure chance, but these do not have much effect on the total activity level (Figure 10). The resulting activity profile shows a fast increase in activity from λʘ = 201.0° to the peak at λʘ = 202.0° with a slower decline until λʘ = 204.0°, beyond the short period of 201.0° until 206.0° in solar longitude only very few OCU orbits have been collected. The skew shape or shoulder in the activity profile may hide some sub maxima caused by some layered structure of dust trails in the stream. Therefore, we look more in detail at the activity profile with a time bin of 0.25° moved forward in steps of 0.05° in solar longitude. The resulting activity profile in Figure 11 shows some remarkable ups and downs with a dip at λʘ = 201.9° immediately before the maximum peak. The best rates are within the interval 201.95°– 202.15° and another dip occurs at λʘ = 202.45° followed by a kind of sub maximum around λʘ = 202.65°. Future data may help to decide if the modest sub maxima at λʘ = 203.8° and λʘ = 204.3° are real or just spurious due to statistical scatter. The number of orbits available requires some caution when considering details in the activity profile.
Based on the relative activity profile derived from the numbers of orbits collected on a global scale over 11 years of time, we can pinpoint the time of maximum at λʘ = 202.05 ± 0.1°, while λʘ = 202.5° is in fact the median value of the entire activity period which falls slightly after the peak of the activity due to the skewness of the activity profile.
6 Other shower characteristics
With a geocentric velocity of 52.2 km/s the October Ursae Majorids produce a luminous trajectory in the atmospheric layer between 115 and 95 km elevation. This is the same layer where the Perseids appear. Remarkable enough, although OCU meteors have a slightly lower velocity than the Perseids (59.1 km/s), the OCU meteors start a couple of kilometers higher in the atmosphere than Perseids. This could indicate a slightly different composition with more volatile fresh cometary material. The high layer in which the OCU meteors appear is favorable for video camera networks as these have their best overlap at this level.
Table 4 – Beginning and ending heights with ± σ for the
October Ursae Majorid obtained for the trajectories from this study (1) and from CAMS BeNeLux (2) for each threshold level of the D-criteria.
| Threshold level | OCU – 333 | |
| Hbeg | Hend | |
| Low (1) | 110.6 ± 6.3 km | 96.4 ± 6.1 km |
| Medium low (1) | 111.2 ± 5.8 km | 96.5 ± 6.0 km |
| Medium high (1) | 111.4 ± 5.1 km | 97.0 ± 5.9 km |
| High (1) | 112.3 ± 4.6 km | 97.3 ± 6.1 km |
| Very high (1) | 112.1 ± 4.3 km | 96.5 ± 6.8 km |
| Low (2) | 110.0 ± 6.0 km | 96.6 ± 5.2 km |
| Medium low (2) | 111.2 ± 5.9 km | 96.8 ± 5.4 km |
| Medium high (2) | 113.1 ± 4.4 km | 97.4 ± 4.9 km |
| High (2) | 113.7 ± 4.4 km | 97.0 ± 5.0 km |
| Very high (2) | 114.1 ± 4.1 km | 95.6 ± 5.1 km |
Looking at the median values for the beginning and ending points for each class of threshold level in D-criteria, all results are in a very good agreement (Table 4). We assume that the data providers, CAMS, EDMOND and SonotaCo, list the values obtained from triangulations that represent the real begin, and ending heights. Anyway, by using median values any outliers have little or no influence.
Our sample of 442 October Ursae Majorid orbits had an average absolute magnitude, brightest and faintest value of –1.3 [–9.6; +1.9]. The magnitude distribution as a percentage of the total number of October Ursae Majorids is shown in Figure 12. The shower is abundant in bright meteors and produced some very bright fireballs in the past. The shape of the magnitude profile in Figure 12 indicates that the amount of data doesn’t sufficiently cover the magnitude range to attempt any population index calculation.
If we calculate the average absolute magnitude for each interval of 3.0° in solar longitude with a step of 0.5° solar longitude for all non-OCU meteors, without Orionids in the considered period and for all 442 OCU orbits, we see that the October Ursae Majorids are about 0.5 magnitude brighter than the overall meteor activity (Figure 13). Although the shower produced some very bright fireballs, the overall brightness is with 0.5 magnitude only slightly above that of the background activity, without Orionids. Figure 13 suggests that the average shower produces more bright meteors during its maximum and less before and after the maximum. However, the number of OCU meteors is too small yet to draw any conclusions about these variations in average magnitude.

Figure 12 – Magnitude distribution per half magnitude class based on the absolute magnitudes of October Ursae Majorids.

Figure 13 – Average absolute magnitude for the overall meteor activity (blue) and the October Ursae Majorids (red) per 3° in solar longitude with a step of 0.5° in solar longitude.
7 October Ursae Majorids orbits
In Table 5 we list all relevant orbits for October Ursae Majorids (OCU#333) meteor stream. The orbital data published by the IAU Meteor Data Center, based on different stream searches, represents rather small numbers of orbits. It is often not clear which D-criteria were applied to determine the reference orbit. Therefore, for this case study we list the reference orbits for the different threshold levels.
The orbits collected by CAMS BeNeLux which are still under embargo are not included in this case study, but the preliminary results for these OCU orbits are listed for each threshold level.
The orbit of the October Ursae Majorids as well as the shower characteristics suggest a long periodic comet as parent body, perhaps a Halley type comet. The parent body remains to be discovered and perhaps the dust trail may provide some indications where and when to expect this comet at its perihelion, if it still exists. Any irregular annual activity of the OCU meteor stream may be a hint for the presence of a fresh dust trail related to the parent comet or its remnants. Careful annual monitoring is strongly recommended.

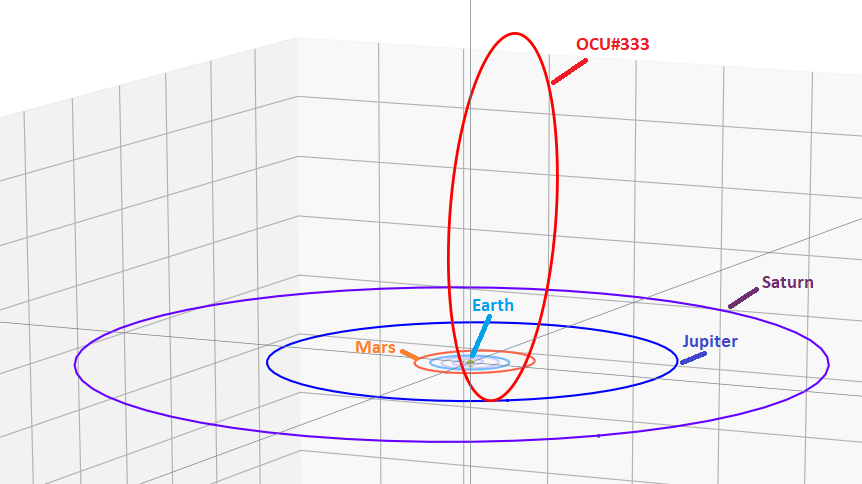
Figure 14 – The reference orbit from this study with D<0.04 in Table 5 as seen from North of the ecliptic plane.

Figure 15 – The reference orbit from this study with D<0.04 in Table 5 as seen near the Earth orbit.
Table – 5 The orbital data for the OCU #333 all J2000. The data marked with (*) refers to Jenniskens et al. (2018).
| λʘ(°) | αg (°) | δg (°) | Δα (°) | Δδ(°) | vg km/s | a AU | q AU | e | ω (°) | Ω (°) | i (°) | N | Source |
| 200.6 | 137.8 | 67.7 | – | – | 54.2 | 9.1 | 0.994 | 0.891 | 173.5 | 200.6 | 98.2 | 1 | 022K1 (1958) |
| 202 | 144.8 | 64.5 | – | – | 54.1 | 5.9 | 0.979 | 0.875 | 163.7 | 202.1 | 99.7 | 10 | Uehara et al., 2006 |
| 204.7 | 147.6 | 64.0 | 0.13 | 0.09 | 54.4 | – | – | – | – | – | – | 15 | SonotaCo, 2009 |
| 202 | 143.8 | 63.9 | – | – | 58.1 | – | 0.981 | 1.115 | 165.7 | 202.0 | 103.3 | 1223 | Brown et al., 2010 |
| 202.0 | 145.0 | 64.8 | 1.39 | -0.33 | 55.6 | 12.6 | 0.982 | 0.967 | 165.9 | 202.2 | 100.6 | 9 | Jenniskens et al. (2016) |
| 202.2 | 143.6 | 63.9 | – | – | 55.2 | 7.89 | 0.980 | 0.876 | 164.5 | 202.2 | 101.4 | 1 | 2015 (*) |
| 202.6 | 146.0 | 63.7 | – | – | 55.5 | 13.1 | 0.976 | 0.925 | 163.2 | 202.6 | 101.1 | 6 | 2016 (*) |
| 202.7 | 146.1 | 64.2 | – | – | 55.5 | 18.1 | 0.978 | 0.946 | 164.1 | 202.7 | 100.7 | 11 | 2014 (*) |
| 202.8 | 146.0 | 64.0 | – | – | 55.6 | 18.1 | 0.977 | 0.946 | 163.9 | 202.8 | 100.8 | 69 | Annual (*) |
| 202.0 | 144.4 | 64.3 | – | – | 55.7 | 17.2 | 0.980 | 0.943 | 164.7 | 202.0 | 101.2 | 16 | 2013 (*) |
| 202.24 | 144.8 | 64.3 | – | – | 55.9 | 14.1 | 0.979 | 0.930 | 164.4 | 202.2 | 101.2 | 211 | BeNeLux (<0.105) |
| 202.24 | 144.8 | 64.4 | – | – | 55.9 | 15.6 | 0.980 | 0.938 | 164.6 | 202.2 | 101.1 | 137 | BeNeLux (<0.08) |
| 202.22 | 144.9 | 64.5 | – | – | 55.8 | 17.1 | 0.979 | 0.942 | 164.4 | 202.2 | 100.8 | 101 | BeNeLux (<0.06) |
| 202.23 | 144.9 | 64.5 | – | – | 55.9 | 18.5 | 0.980 | 0.947 | 164.7 | 202.2 | 100.8 | 77 | BeNeLux (<0.04) |
| 202.18 | 144.6 | 64.6 | – | – | 55.9 | 30.8 | 0.981 | 0.968 | 165.3 | 202.2 | 100.7 | 25 | BeNeLux (<0.02) |
| 202.5 | 145.3 | 64.1 | 1.40 | -0.25 | 55.2 | 8.8 | 0.979 | 0.889 | 164.2 | 202.5 | 100.8 | 442 | This study (<0.105) |
| 202.5 | 145.4 | 64.1 | 1.57 | -0.35 | 55.2 | 9.8 | 0.979 | 0.900 | 164.3 | 205.6 | 100.8 | 330 | This study (<0.08) |
| 202.5 | 145.6 | 64.2 | 1.96 | -0.38 | 55.2 | 11.0 | 0.979 | 0.911 | 164.2 | 202.5 | 100.6 | 237 | This study (<0.06) |
| 202.4 | 145.4 | 64.2 | 1.68 | -0.40 | 55.2 | 10.9 | 0.979 | 0.910 | 164.3 | 202.4 | 100.8 | 141 | This study (<0.04) |
| 202.2 | 144.6 | 64.2 | 1.72 | -0.31 | 55.1 | 10.1 | 0.979 | 0.903 | 164.2 | 202.2 | 100.4 | 43 | This study (<0.02) |
8 Conclusion
This case study confirms the October Ursae Majorids (OCU#333) meteor stream as annual minor meteor shower with a rather sharp maximum at λʘ = 202.05 ± 0.10°. The skew activity profile rises steep to its maximum followed by a slower decline in activity. The activity profile displays dips and sub-maxima which may be related to a layered structure of dust trails, but this requires more data to exclude statistical flutter on the profile. There is a significant spread in velocity with slower particles at lower inclination and the faster ones at higher inclination. The cause of this distribution remains to be explained. There is absolutely no indication for any periodicity in the shower activity which produces activity on annual bases. The shower is rich in rather bright meteors, including fireball events. The rather sharp peak activity can be easily missed in case of unfavorable weather therefore a global coverage with widely spread camera networks is recommended.
The October Ursae Majorids (OCU#333) should be investigated again when more data is available. Its orbit is typical for long periodic comets, but its parent body remains to be discovered. Future surprises with this shower are not excluded and require permanent attention.
Acknowledgment
The authors are very grateful to Jakub Koukal for updating the dataset of EDMOND with the most recent data, to SonotaCo Network (Simultaneously Observed Meteor Data Sets SNM2007–SNM2017), to CAMS (2010–2013) and to all camera operators involved in these camera networks.
We thank Denis Vida for providing us with a tool to plot a color gradient to show the dispersion in velocity and we thank Alexandra Terentjeva for her personal comments.
EDMOND (https://fmph.uniba.sk/microsites/daa/daa/veda-a-vyskum/meteory/edmond/) includes: BOAM (Base des Observateurs Amateurs de Meteores, France), CEMeNt (Central European Meteor Network, cross-border network of Czech and Slovak amateur observers), CMN (Croatian Meteor Network or HrvatskaMeteorskaMreza, Croatia), FMA (Fachgruppe Meteorastronomie, Switzerland), HMN (HungarianMeteor Network or Magyar Hullocsillagok Egyesulet, Hungary), IMO VMN (IMO Video Meteor Network), MeteorsUA (Ukraine), IMTN (Italian amateur observers in Italian Meteor and TLE Network, Italy), NEMETODE (Network for Meteor Triangulation and Orbit Determination, United Kingdom), PFN (Polish Fireball Network or Pracownia Komet i Meteorow, PkiM, Poland), Stjerneskud (Danish all-sky fireball cameras network, Denmark), SVMN (Slovak Video Meteor Network, Slovakia), UKMON (UK Meteor Observation Network, United Kingdom).
The CAMS BeNeLux team is operated by the following volunteers: Hans Betlem (Leiden, CAMS 371, 372 and 373), Felix Bettonvil (Utrecht, CAMS 376 and 377) , Jean-Marie Biets (Wilderen, CAMS 380, 381 and 382), Martin Breukers (Hengelo, CAMS 320, 321, 322, 323, 324, 325, 326, 327, 328 and 329), Bart Dessoy (Zoersel, CAMS 397, 398, 804, 805, 806 and 888), Franky Dubois (Langemark, CAMS 386), Jean-Paul Dumoulin / Christian Wanlin (Grapfontaine, CAMS 814 and 815), Luc Gobin (Mechelen, CAMS 390, 391, 807 and 808), Tioga Gulon (Nancy, France, CAMS 3900 and 3901), Robert Haas (Alphen aan de Rijn, CAMS 3160, 3161, 3162, 3163, 3164, 3165, 3166 and 3167), Robert Haas / Edwin van Dijk (Burlage, CAMS 801, 802, 821 and 822) , Robert Haas (Texel, CAMS 810, 811, 812 and 813), Klaas Jobse (Oostkapelle, CAMS 3030, 3031, 3032, 3033, 3034, 3035, 3036 and 3037), Carl Johannink (Gronau, CAMS 311, 312, 313, 314, 315, 316, 317 and 318), Hervé Lamy (Ukkel, CAMS 393; Dourbes, CAMS 395), Koen Miskotte (Ermelo, CAMS 351, 352, 353 and 354) , Piet Neels (Terschelling, CAMS 841, 842, 843 and 844), Piet Neels (Ooltgensplaat, CAMS 340, 341, 342, 343, 344 and 345, 349, 840), Tim Polfliet (Gent, CAMS 396), Steve Rau (Zillebeke, CAMS 3850 and 3852), Paul Roggemans (Mechelen, CAMS 383, 384, 388, 389, 399 and 809), Hans Schremmer (Niederkruechten, CAMS 803), Erwin van Ballegoij (CAMS 347 and 348) ) and Marco Van der Weide (CAMS 3110).
References
Brown P., Wong D. K., Weryk R. J. and Wiegert P. (2010). “A meteoroid stream survey using the Canadian Meteor Orbit Radar. II: Identification of minor showers using a 3D wavelet transform”. Icarus, 207, 66–81.
Dem’yanenko V.I., Terentjeva A. K., Sherbaum L. M. (1964). “Orbits of meteor bodies by photographic observations 1957-1958”. Materials of International Geophisical year, Information Bulletin, №6, Kiev, Pub. Academy of Sciences UkSSR, 32–35.
Drummond J. D. (1981). “A test of comet and meteor shower associations”. Icarus, 45, 545–553.
Jenniskens P., Gural P. S., Grigsby B., Dynneson L., Koop M. and Holman D. (2011). “CAMS: Cameras for Allsky Meteor Surveillance to validate minor meteor showers”. Icarus, 216, 40–61.
Jenniskens P., Nénon Q., Albers J., Gural P. S., Haberman B., Holman D., Morales R., Grigsby B. J., Samuels D. and Johannink C. (2016). “The established meteor showers as observed by CAMS”. Icarus, 266, 331–354.
Jenniskens P., Baggaley J., Crumpton I., Aldous P., Pokorny P., Janches D., Gural P. S., Samuels D., Albers J., Howell A., Johannink C., Breukers M., Odeh M., Moskovitz N., Collison J. and Ganjuag S. (2018). “A survey of southern hemisphere meteor showers”. Planetary Space Science, 154, 21–29.
Jopek T. J. (1993). “Remarks on the meteor orbital similarity D-criterion”. Icarus, 106, 603–607.
Kornoš L., Matlovič P., Rudawska R., Tóth J., Hajduková M. Jr., Koukal J. and Piffl R. (2014). “Confirmation and characterization of IAU temporary meteor showers in EDMOND database”. In Jopek T. J., Rietmeijer F. J. M., Watanabe J., Williams I. P., editors, Proceedings of the Meteoroids 2013 Conference, Poznań, Poland, Aug. 26-30, 2013. A.M. University, pages 225–233.
Sekanina Z. (1973). “Statistical model of meteor streams. III Stream search among 19303 radio meteors”. Icarus, 18, 253–284.
Sekanina Z. (1976). “Statistical model of meteor streams. IV. A study of radio streams from the synoptic year”. Icarus, 27, 265–321.
SonotaCo (2009). “A meteor shower catalog based on video observations in 2007-2008”. WGN, Journal of the International Meteor Organization, 37, 55–62.
Southworth R. R. and Hawkins G. S. (1963). “Statistics of meteor streams”. Smithson. Contrib. Astrophys., 7, 261–286.
Terentjeva A. K. (1966). “Minor meteor streams”. Results of researches of international geophysical projects: Meteor Investigations. N° 1, Publishing House “Nauka”, pages 62–132, Moscow.
Terentjeva A. K. (2017). “Meteor streams study of 1966”. eMetN, 2, 95.
Uehara S., Fujiwara Y., Furukawa Takashi, Inoue H., Kageyama K., Maeda K., Muroishi H., Okamoto S., Masuzawa T., Sekiguchi T., Shimizu M., and Yamakawa H. (2006). “Detection of October Ursa Majorids in 2006”. WGN, Journal of the International Meteor Organization, 34, 157–162.
Verniani F. (1973). “An analysis of the physical parameters of 5759 faint radio meteors”. J. Geophys. Res., 78, 8429–8462.
