Introduction
The Lyrids in the BeNeLux were very successful. CAMS achieved some nice results and even the all sky cameras recorded a few Lyrids. The author could observe six nights during the period 15-23 April. Unfortunately, he was one of the few in the BeNeLux.
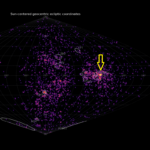
I looked on the IMO site at the amount of data submitted. It turned out that 36 observers submitted data from the Lyrids period, this yielded 918 Lyrids in 15 intervals (situation on 2 July 2018), see also figure 1. The author then downloaded data according to the known selection criteria and made some calculations. The results are presented in this article.
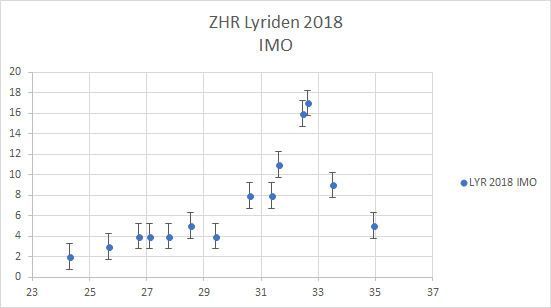
Figure 1. ZHR on the fly curve Lyrids 2018, IMO. Source:
http://www.imo.net/members/imo_live_shower?shower=LYR&year=2018
Workflow
First of all, I looked at data from observers for which a recent CP was already known. If data was available, it was downloaded, with a minimum limiting magnitude of 5.9. Observations with limiting magnitudes below 5.9 were not used. Hourly counts were used for the ZHR analysis. Data based on shorter periods was aggregated to periods of about 1 hour. Incidentally, this time the author also used data from two observers who do not report to IMO.
It is also striking how little data comes from America and Asia which is really a pity if you want to do a real global analysis. The r value calculations could only be made on the basis of European data, most of the ZHR values came from Europe and a small part from America.
Population index r
Of the 949 Lyrids that were reported to IMO and the author, only 335 could be used for a r value determination. This concerned data from the period 18-23 April. What often appears is that the gradient or ratio in the magnitude distributions is often the same, but that one observer has more +4 meteors than other magnitudes, while another observer has a peak at +2 or +1. There are observers who do not see meteors of magnitude +5 or +6 at conditions where the limiting magnitude is well above 6.5. The cause is difficult to indicate. Sometimes it is a matter of estimating meteors too bright, but perhaps that there are also other factors involved (e.g. with the eye?).
Table 1 gives the r values. This clearly shows that in fact only for the nights 21/22 and 22/23 April a good population index R value could be determined on the European continent. The results are also what you would expect from the Lyrids. In the night April 21 to 22 the weak Lyrids dominate, the night April 22 to April 23 the bright Lyrids are the strongest. The maximum was expected in the evening of April 22 at 18 UT (λʘ 32.32 degrees). However, in [1] is mentioned about a maximum that varies a little between 22 April from 10 to 21 UT (λʘ 32.0-32.45 degrees).
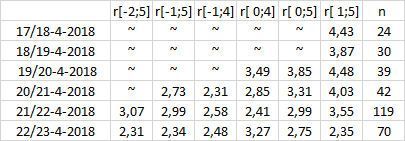
Table 1. Results of population index r calculations.
For the ZHR calculations, a population index of 2.73 was used for the night of 20/21 April, 2.99 for April 21/22 and 2.34 for the night of April 22/23 (all European data). All calculations were based on the magnitude range [-1; +5]. In the nights before 20 April a population index of 3.00 was assumed, for the nights 23/24 and 24/25 April the r value was assumed as 2.50. These have been adopted on the basis that only weak Lyrids have actually been seen in the period before 20 April and in the period after 23 April, less evident as 22/23, but more like the nights before.
Zenital Hourly Rate (ZHR)
As indicated earlier, only data from observers with a good Cp have been used. The Cp could also be calculated for a number of “new” observers.
The data was further examined for the radiant heights (observations done with radiant heights lower than 25 degrees were not used). A check was done for outliers in the ZHR but for the latter nothing was found. In total, of the 949 Lyrids reported to IMO and the author, 588 Lyrids were used. That are 143 Lyrids more than in the analysis from 2015, which was based on 445 Lyrids. The results are shown in table 2 and figures 2,3 and 4.
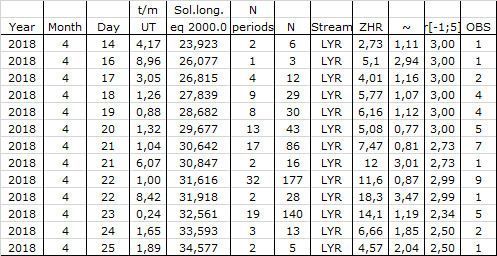
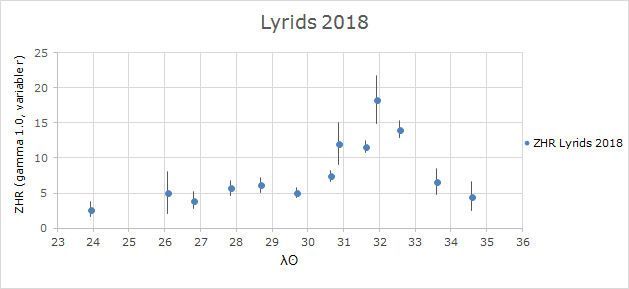
Table 2. ZHR Lyrids 2018

Figure 2. Lyrids 2018 ZHR. The solar longitude corresponds with the period from April 14 to April 25, 2018.
It is clearly visible that the ZHR remains a bit stable with a ZHR of 5 in the period from λ 26 to 30 (roughly 16 to 20 April), only after that a somewhat faster increase appears. This fact could also have something to do with the low numbers of Lyrids and on top of that the “pollution” with look-alike sporadic meteors. The ZHR points just before λ 31 and 32 are data from respectively 1 and 2 American observer (s).
April 21/22 and 22/23 2018
Here we zoom in a bit in on the maximum of the Lyrids to see if we can determine a course in ZHR and possibly pin the maximum sharper. This yielded graph 3 and table 3.
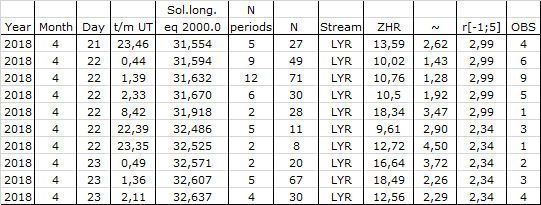
Table 3. ZHR Lyrids 2018, 21/22 and 22/23 April 2018.
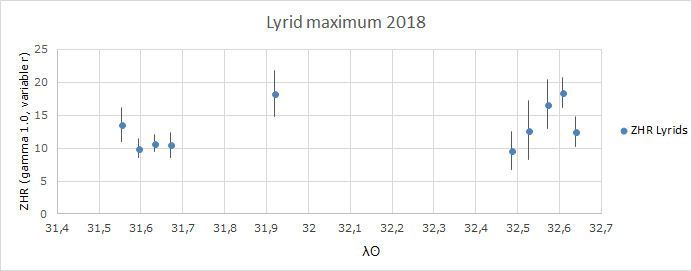
Figure 3. ZHR Lyrids on April 21/22 and April 22/23 2018.
If we look at the ZHR profile in figure 3, we see a reasonably flat pattern for 21/22 April. The course of 22/23 April looks beautiful. It shows an increasing ZHR and a maximum around λ 32.61. This is well above the period given in [1] which runs from λʘ 32.0-32.45 degrees. Unfortunately, there is no data available from the period of 22 April 2018 between 18 and 21 UT. It is therefore difficult to indicate whether the peak at λ 32.61 is the real maximum peak of the Lyrids. The author therefore also looked at the well-known radio chart based on RMOB radio data. See figure 4.
Figure 4. Radio data of the Lyrids 2018 based on radio data (RMOB).
A peak is clearly visible on the radio graph around λ 32.3 which matches nicely with the expected value λ 32.32 from [1]. However, at the moment of the maximum ZHR found in this analysis, there is also a very small sub-peak in the radio data. That was also the moment that the author could observe and observed many bright Lyrids [2]. So the only conclusion we can draw from this is that the maximum of the Lyrids is not visually observed and that the peak found from this analysis may be a sub-peak. The IMO also found the maximum activity around that radio chart (black graph points). Logical, there is simply no data available from around λ 32.32.
Conclusions and recommendations
The Lyrids could reasonably be observed. Unfortunately, most data comes from Europe. We certainly cannot speak of a global analysis. A peak in activity has been found around solar longitude λ 32.61, it is probably a sub peak in the activity of the Lyrids which has also been observed with radio.
Finally, the author continues to insist that a good Cp provision for observers is necessary. For this purpose, as much as possible sporadic observing data is used from the period 25 July to 31 August on the basis of hourly counts between 0 and 4 am local time.
Word of thanks
First of all, a big thank you for all observers who observed the Lyrids and sent data to the author and / or IMO. They are:
Alexandre Amorim, Pierre Bader, Sarvesh Bhogaokar, Steve Brown, David Buzgo, Tibor Csorgei, Michel Deconinck, Jaroslav Dygos, Frank Enzlein, Kai Frode Gaarder, Gristoph Gerber, George Gliba, Robin Hegenbarth, Glenn Hughes, Karoly Jonas, Javor Kac, Sara Knežević, Zdenek Komarek, Sneha Kulkarni, Michael Linnolt, Adam Marsh, Peter Miklos, Koen Miskotte, Sirko Molau, Ana Nikolić, Vladimir Nikolić, Ina Rendtel, Juergen Rendtel, Terrence Ross, Branislav Savic, Stefan Schmeissner, Kai Schultze, Snežana Todorović, Michel Vandeputte, Roland Winkler, Oliver Wusk and Sabine Wächter.
Finally, a word of thanks to Carl Johannink, Paul Roggemans and Michel Vandeputte for critically reviewing and commenting on this article.
References
[1] Jurgen Rendtel et al, 2018 Meteor Shower Calendar, IMO