By Paul Roggemans and Peter Cambell-Burns
A small but remarkable number of orbits of the x Herculids were recorded by the CAMS BeNeLux network on 12 March 2018. An independent search was made to identify orbits of this shower. One photographic orbit obtained in 1954 and 6 radar orbits obtained between 1961 and 1969 qualify as possible members of this stream. For more recent data ~686000 public available video meteor orbits were searched for XHE orbits.
The 180 video meteors that fit the minimal similarity D criterion with D < 0.105 (Drummond criterion), radiated from R.A. 255.7° and Decl. +48.8° with a geocentric velocity of 34.4 km/s in a time lapse between 339° and 6° in solar longitude with a rather sharp peak around 351.5±0.4°. The orbital elements match perfectly with previously published results. There is no indication for any periodicity in the shower displays from year to year. The XHE-meteors are remarkably rich in bright meteors and rather deficient in faint meteors and belong probably to an old remnant of a dust trail produced by a comet of the Jupiter-family. The distinct concentration of the orbits confirms this minor shower as an established meteor stream.
1 Introduction
In the night of 11–12 March 2018 a number of orbits were identified as belonging to the x Herculids (XHE-346) by the CAMS BeNeLux network. Although the number of orbits is not impressive, the radiants caught attention on the otherwise rather empty shower radiant maps around this time of the year.
Very little is known about this meanwhile established minor shower. The authors decided to search the publicly available orbit data in an attempt to document this minor shower.
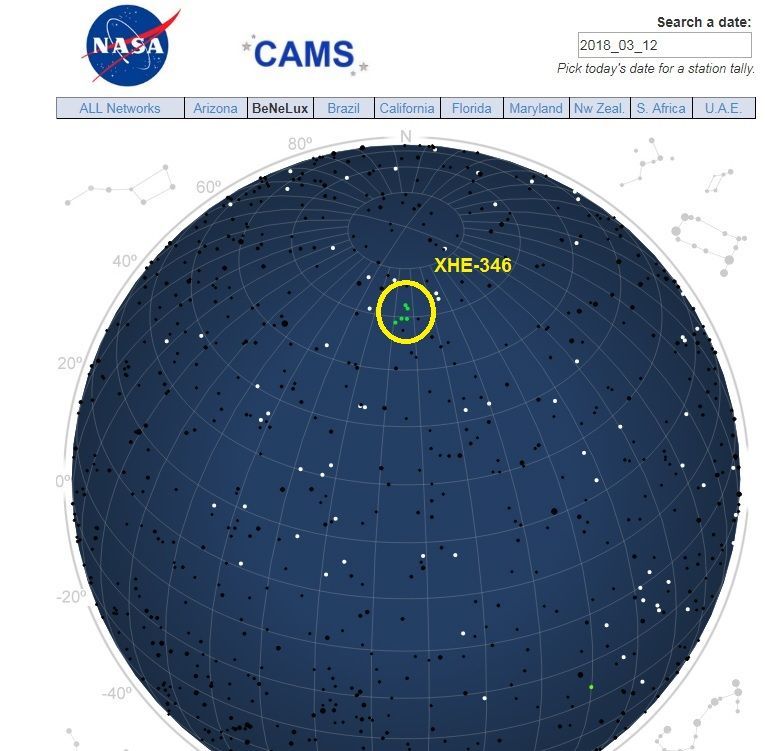
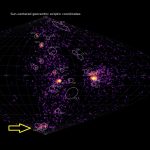
Figure 1 – Screenshot of the CAMS radiant plot for the night of 2018 March 12 with the remarkable concentration of radiants identified as XHE (346) orbits.
2 XHE (346) history
A search for earlier recorded orbits that could be associated with this stream in the photographic meteor orbit catalogue with 4873 accurate photographic orbits obtained between 1936 and 2008 resulted in only one similar orbit. This meteor was photographed on 6 March 1954 (Jacchia et al., 1967) and fits with the XHE-reference orbit with a high threshold of DD < 0.04.
The Harvard radar orbit catalogues 1961–1965 and 1968–1969 (Hawkins, 1963) contain only 6 orbits with DD < 0.105 and 3 with DD < 0.08.
The scarce amount of available orbital data explains why this meteor shower has never been detected before. The XHE (346) had to wait until sufficient numbers of video meteor orbits had become available to be detected. We did not check any single station based radiant analyses as the risk of contamination of the data with sporadics is far too high in single station video statistics for the XHE shower.
3 The available orbit data
With two major orbit datasets being recently updated, it was worthwhile to check if and what we can detect about the XHE (346) meteor shower. We have the following data, status as until March 2018, available for our search:
- EDMOND EU+world with 317830 orbits (until 2016). EDMOND collects data from different European networks which altogether operate 311 cameras (Kornos et al., 2014).
- SonotaCo with 257010 orbits (2007–2017). SonotaCo is an amateur video network with over 100 cameras in Japan (SonotaCo, 2009).
- CAMS with 111233 orbits (October 2010 – March 2013), (Jenniskens et al., 2011). For clarity, the CAMS BeNeLux orbits April 2013 – March 2018 are not included in this dataset because this data is still under embargo.
Altogether we can search among 686073 video meteor orbits.
4 Preliminary orbit selection
The triggers for this analysis were the 6 XHE orbits obtained by the CAMS BeNeLux network on 12 March 2018. The authors followed the procedure described in a previous similar analysis (Roggemans and Johannink, 2018) to identify possible XHE orbits. Based on the known parameters we can define a sub-dataset to limit the amount of orbits in time and space to a region where related orbits might be located.
In a first attempt orbits were selected in a period of 1 week before and after 12 March. The length of this interval was increased in small steps until no more extra candidate orbits were detected. All orbits within the following intervals were selected:
- Time interval: 335° < λʘ < 8°;
- Radiant area: 242° < α < 273° and +39° < δ < +59°;
- Velocity: 31.7 km/s < vg < 38.7 km/s.
In total 377 orbits occurred within these intervals. These 377 orbits were obtained from meteors that appeared in the sky in a way that any single station observer would associate these meteors as XHE shower members, coming from the right direction of the radiant with the right angular velocity expected for this shower. The purpose of analyzing the orbital data is to get an idea how many of these orbits are nothing else than sporadics that contaminate the radiant area and how many of these orbits have enough similarity to form a concentration that indicates the presence of a minor shower.
Although we used the previously known time, radiant position and velocity as bases to define our preselection of orbits, we will not use the orbit from previous research as parent orbit to detect XHE-candidates. The first step is to check to which extend the median values of the selected dataset compare to the literature values. If our dataset contains a concentration of orbits for the XHE shower, the median values should be comparable. We check this for the total dataset as well as for the sub datasets for CAMS, EDMOND and SonotaCo. The results are listed in Table 1. All combinations compare well to the orbit found in literature which is a first indication that a significant number of orbits of this shower are included. The median values listed also include the contamination by sporadics because no similarity criteria were applied yet.
Table 1 – The median values for each sub-set of orbits, CAMS, SonotaCo and EDMOND, compared to the reference orbit from literature (Jenniskens et al., 2018).
|
We apply three discrimination criteria to evaluate the similarity between the individual orbits taking the median values as parent orbit. The D-criteria used are these of Southworth and Hawkins (1963), Drummond (1981) and Jopek (1993). We consider four different threshold levels of similarity:
- Low: DSH < 0.25 & DD < 0.105 & DH < 0.25;
- Medium low: DSH < 0.2 & DD < 0.08 & DH < 0.2;
- Medium high: DSH < 0.15 & DD < 0.06 & DH < 0.15;
- High: DSH < 0.1 & DD < 0.04 & DH < 0.1.
In Table 2 we filter those orbits that fit the low threshold D-criteria to eliminate the obvious sporadic contamination from the sample. The median values for each set of orbits do not differ too much from Table 1, but the comparison is slightly better. In Table 3 we compare the median values of the orbits according to the four levels of the D-criteria threshold. Again the resulting orbits for each of the levels of similarity show very little variation. Whether we consider the preselected dataset as a whole, or if we consider the different networks with or without D-criteria, all have about the same median values.
Table 2 – The median values for each sub-set of orbits, CAMS, SonotaCo and EDMOND with DD < 0.105, compared to the reference orbit from literature (Jenniskens et al., 2018).
|
Table 3 – The median values for the selected orbits with four different threshold levels on the D-criteria, compared to the reference orbit from literature (Jenniskens et al., 2018).
|
Table 3 shows the percentage (S) of orbits of the sample that fails to fulfill the D-criteria and must be considered as sporadic contamination of the radiant area. The remainder is an indication for the evidence of the presence of a dust concentration within the sample.
The presence of a cluster of very similar orbits in the dataset becomes very obvious in the graph of the inclination i (°) against the length of perihelion П (°) (Figure 2).
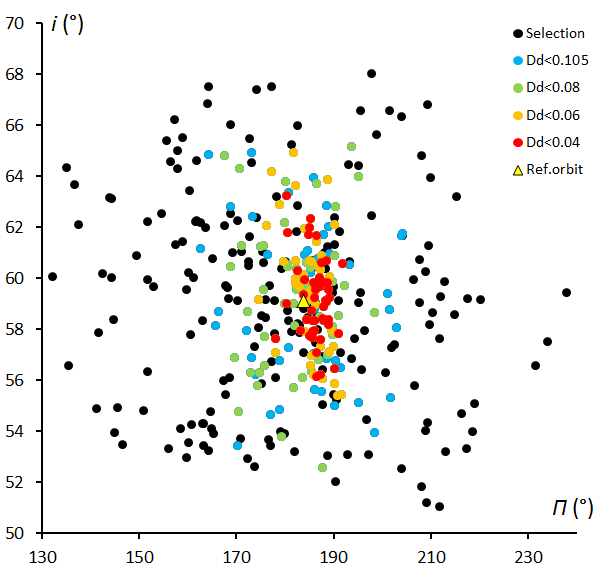
Figure 2 – The plot of inclination i (°) against the length of perihelion П (°) for the 377 preselected orbits. The colors mark the different threshold levels of the D-criteria relative to the parent orbit defined by the median values of the entire dataset.
5 Final orbit selection
In the preliminary investigation we used the median values based on the entire dataset including the natural contamination by sporadics as a parent orbit to approach the cluster of similar orbits. In the final approach the median values for the 47 orbits that fit the high threshold D-criteria are taken as parent orbit to recalculate the individual D-criteria for each of the 377 selected orbits.
For reason of completeness we repeat the procedure explained in section 4, but based on the parent orbit obtained from the 47 orbits that fit the high threshold criteria.
Table 4 – The median values for each sub-set of orbits, CAMS, SonotaCo and EDMOND with DD < 0.105 using the high threshold orbit from Table 3 as parent orbit. All compared to the reference orbit from literature (Jenniskens et al., 2018).
|
Table 5 – The median values for the selected orbits with four different threshold levels on the D-criteria using the high threshold orbit from Table 3 as parent orbit. All compared to the reference orbit from literature (Jenniskens et al., 2018).
|
Table 4 and 5 show that the final resulting orbit is only slightly different whether we look at different sub datasets or when we consider a higher or lower threshold level on the D-criteria. Regardless of the approach, we arrive at an orbit which matches closely with the value found in literature, except for a slight difference in the argument of perihelion. Figure 3 shows the high concentration of orbits near the reference orbit with some dispersion in inclination. The black dots represent orbits that fail to fulfill the D-criteria and represent 52% of the sample as sporadic contamination. The blue dots also display a rather large dispersion as their orbits just fulfill the weakest discrimination criteria to consider the degree of similarity with the parent orbit.
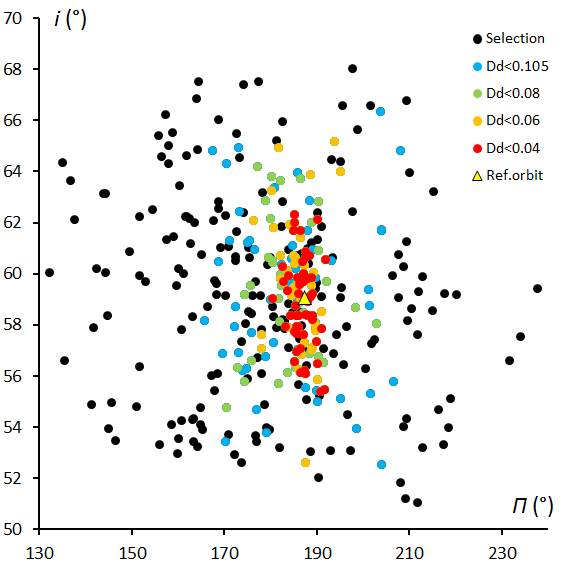
Figure 3 – The plot of inclination i (°) against the length of perihelion П (°) for the 377 preselected orbits. The colors mark the different threshold levels of the D-criteria relative to the parent orbit based on the median values of the 47 orbits to fulfill the high threshold D-criteria.
6 Case study XHE-346: results
The final sample of 180 probable XHE-346 orbits includes 17 CAMS orbits (from 42), 96 EDMOND orbits (from 207) and 67 SonotaCo orbits (from 128). Although 48% of the preselected orbits qualified as probable XHE-346 members with the minimal threshold, only 14% fit the high threshold D-criteria, indicating a high contamination of the region with sporadic orbits.
The activity period and profile
The first XHE-346 orbit was registered at λʘ = 339.5°, the last at λʘ = 5.3°. This corresponds to an activity period from roughly 28 February until 26 March. The main activity takes place in the time interval 347° < λʘ < 358°, or 8 March until 18 March, with the peak XHE activity on 12 March at λʘ = 351.5±0.4° (Figure 4). There is no indication for any annual variation in XHE activity. The variation in number of orbits collected year by year reflects the total amount of orbits contributed by all the camera networks (see Table 6). Since no hourly rates can be determined for this kind of minor showers, the number of orbits collected for each degree in solar longitude provides an indication of the activity profile, showing the activity period as well as the solar longitude at which the largest number of orbits has been collected. The activity period to check for XHE-346 orbits can be defined as
λʘ > 339° and λʘ < 6°. This profile is given in Figure 4. Note the relative sharp peak at λʘmax = 351.5±0.4°, which occurs each year at about the 12th of March.
Table 6 – The number of XHE-346 orbits per year (DD < 0.105).
|
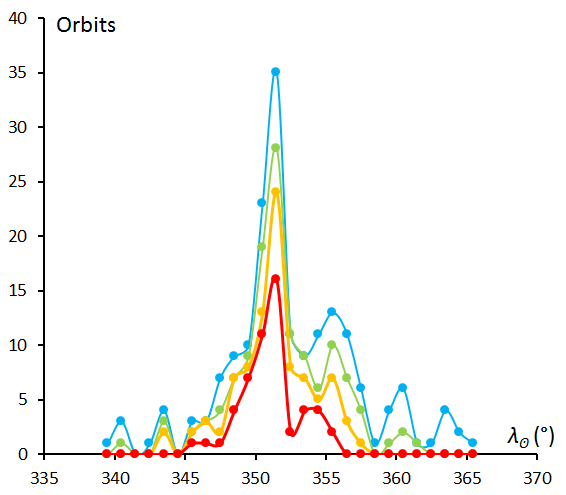
Figure 4 – The number of XHE-346 orbits collected per degree of solar longitude λʘ during the period 2007–2017 with blue for DD < 0.105, green for DD < 0.08, orange for DD < 0.06 and red for DD < 0.04.
The radiant position, drift and diameter
With a radiant position at α = 355.7° and δ = +48.8°, valid at λʘ = 351.5° the radiant drift can be easily determined. The selection of radiant positions that fulfill the low threshold criteria displays a too large scatter, which may be an indication that this criterion is too weak to eliminate all sporadic outliers. The medium low and medium high threshold levels cover a relevant time span with an acceptable spread on the positions. The high threshold level is less suitable as this represents a too short time span. As a compromise we use the medium high threshold (DD < 0.06) position to obtain the radiant drift (see Figures 5 and 6). This results in the following radiant drift:
Δα = 1.05°/ λʘ and Δδ = –0.22°/ λʘ.
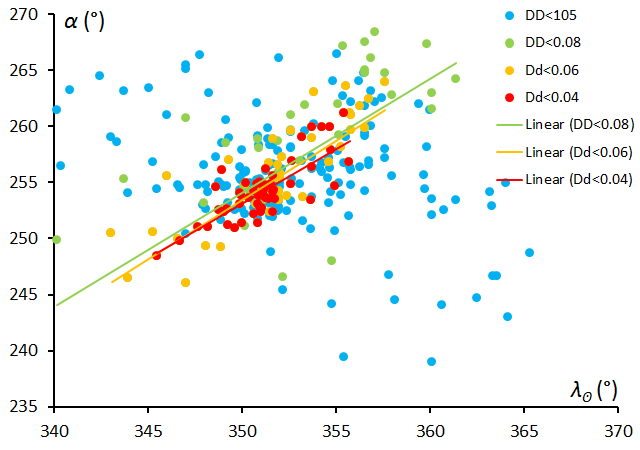
Figure 5 – Radiant drift in Right Ascension α against solar longitude λʘ. The different colors represent the 4 different levels of similarity.
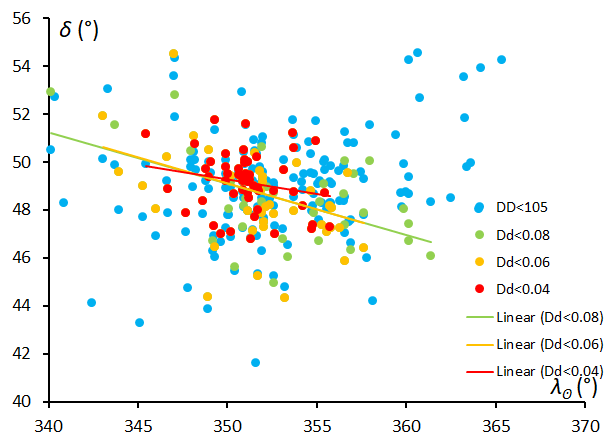
Figure 6 – Radiant drift in declination δ against solar longitude λʘ. The different colors represent the 4 different levels of similarity.
In order to get an idea of the size of the radiant we apply the radiant drift correction to get a plot of the radiant positions corrected for the daily motion (Figure 8). This shows a compact radiant slightly elongated in declination. Compared to the original, uncorrected radiant positions (Figure 7) the scatter of the radiants that failed to fulfill the D criteria increases considerably. Some radiants for orbits with a weak similarity get more diffused and may indicate that these orbits are sporadics that fit within the low threshold by pure chance. The higher the threshold level the more concentrated the radiant drift corrected positions become.
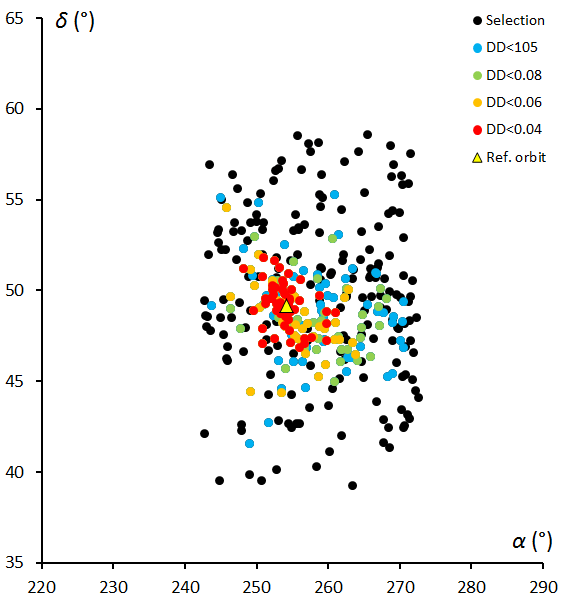
Figure 7 – Plot of the 377 radiant positions as selected. The different colors represent the 4 different levels of similarity according to different threshold levels in the D-criteria.
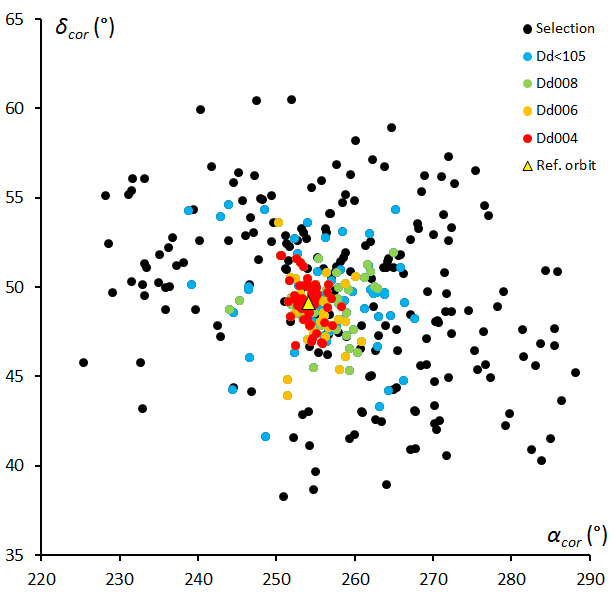
Figure 8 – Plot of the radiant drift corrected radiant positions. The different colors represent the 4 different levels of similarity.
Other shower characteristics
The x Herculids (346) are deficient in faint meteors and rich in medium bright meteors, which may indicate that this is a leftover of an old meteor stream. With a geocentric velocity vg of 34.4 km/s, the XHE-346 are slightly faster than the Geminids (GEM-4) with 33.8 km/s and slower than the Quadrantids (QUA-10) with 40.7 km/s. The median value for the starting height with 96.2 ± 4.2 km and an ending height of 84.4 ± 6.0 km compares perfectly with the values found for the Geminids (Roggemans, 2017).
Dr. Peter Jenniskens et al. (2016) classified this shower with the Jupiter-family comets although its inclination is rather high compared to most showers in this group.
The final orbits obtained in our analyses are listed in Table 7 and compared to the only two relevant references available for the x Herculids so far. The results of this analysis match with the references. In order to visualize the distribution of the 53 individual orbits which fulfill the high threshold (DD < 0.04) in space, we plot these orbits in Figure 9 and compare these with the final result based on the median values plotted in red. The 3D view displays the scatter on the individual orbits. Seen from a position in the ecliptic plane the scatter at the aphelia becomes better visible on the orbits with an inclination of about 59° relative to the ecliptic plane (Figure 10). Figure 11 presents a view as seen from a position in the orbital plane of the x Herculids and shows the scatter in inclination better.
It is obvious that the gravitational forces of planet Jupiter account to a large extent for the orbital evolution of the dust trail that once may have been released by a Jupiter family comet. The dispersion in inclination we noticed in Figure 3 for instance is most likely the result of these gravitational forces.
Table – 7 The orbital data for the x Herculids (XHE-346) all J2000, the standard deviation σ is listed as ± where available.
|
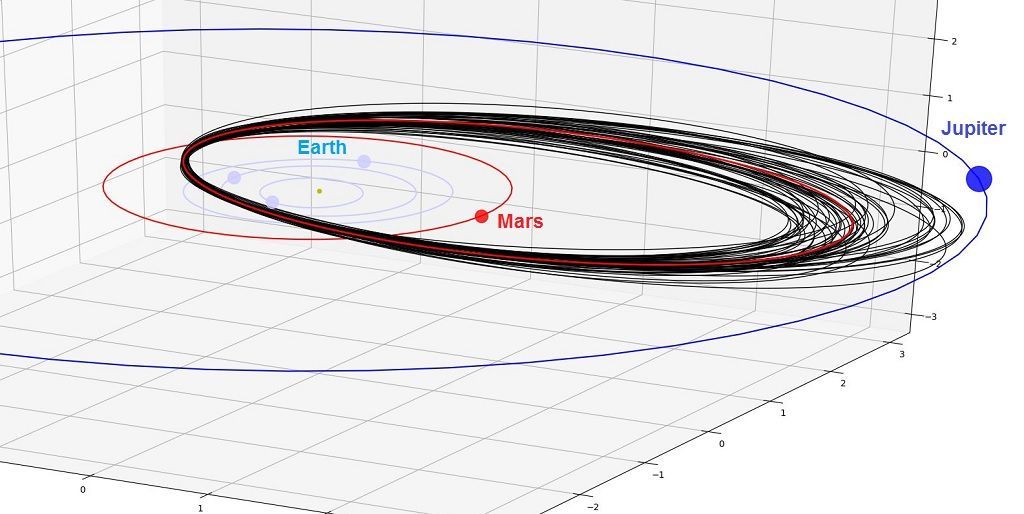
Figure 9 – A 3D view of the final 53 orbits that fulfill the high threshold D-criterion with DSH < 0.1 & DD < 0.04 & DH < 0.1, with the final resulting orbit based on the median values of the orbital elements for the x Herculids (#346) in this case study. (Author Peter Cambell-Burns).
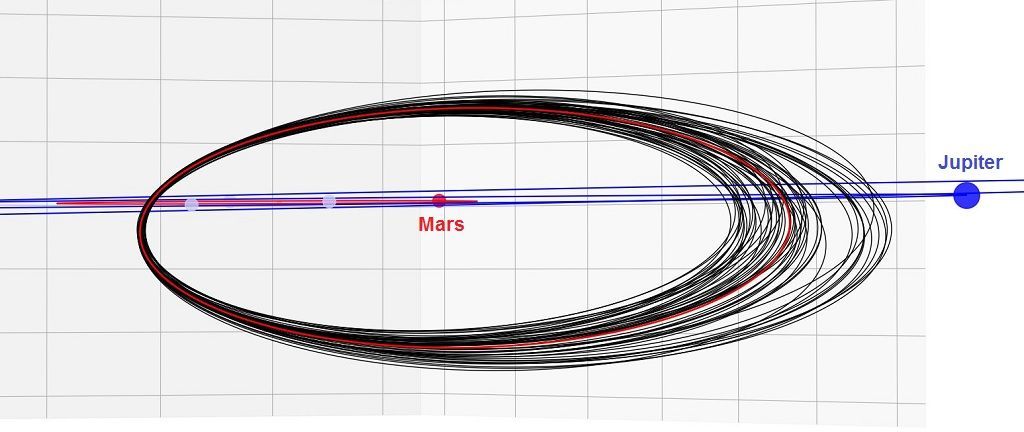
Figure 10 – A view as seen from a position in the ecliptic plane at the concentration of the 53 x Herculids orbits (black) and the final resulting orbit (red), with an inclination of 58.9 ± 1.7 ° relative to the ecliptic. (Author Peter Cambell-Burns).
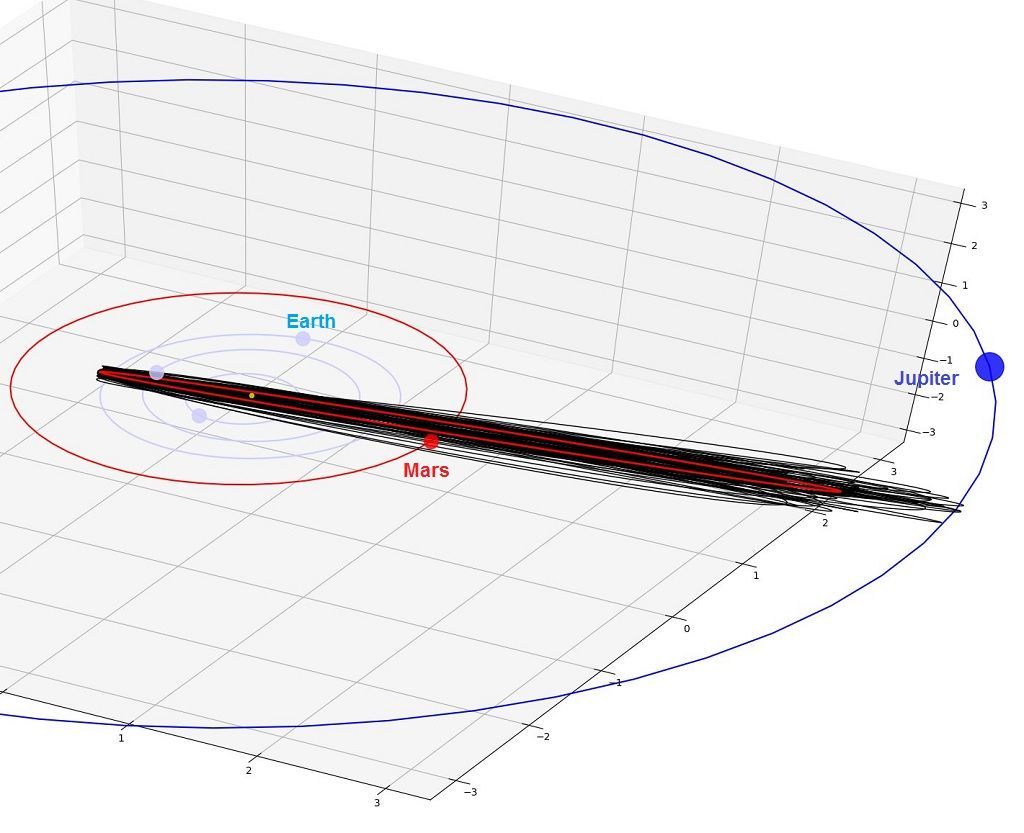
Figure 11 – View from a position in the orbital plane of the x Herculids meteor stream with the 53 x Herculids orbits (black) and the final resulting orbit (red) . (Author Peter Cambell-Burns).
7 Conclusion
A search on the orbital data from the major video camera networks worldwide, good for ~686000 orbits (status March 2018), resulted in 180 candidate XHE-orbits. 53 orbits fulfill the high threshold D-criteria of DD < 0.04. An analysis of the available orbits proved the presence of a distinct cluster of similar orbits independently from previous stream searches. The resulting reference orbit compares very well with the previously published orbits.
Members of this shower have been detected every year since 2007 in a time span between 339° and 6° in solar longitude with a rather sharp maximum at about λʘ = 351.5±0.4°. There is no indication of any periodicity in the stream activity. The abundant proportion of bright meteors and deficiency in faint meteors indicate that this is an old dust stream probably associated with a Jupiter-family comet.
Acknowledgment
The authors are very grateful to Jakub Koukal for updating the dataset of EDMOND with the most recent data, to SonotaCo Network (Simultaneously Observed Meteor Data Sets SNM2007-SNM2017), to CAMS (2010-2013) and to all camera operators involved in these camera networks.
References
Drummond J. D. (1981). “A test of comet and meteor shower associations”. Icarus, 45, 545–553.
Hawkins G. S. (1963). “The Harvard radio meteor project”. Smithsonian Contributions to Astrophysics, 7, 53–62.
Jacchia L., Verniani F. and Briggs R. E. (1967). “An Analysis of the Atmospheric Trajectories of 413 Precisely Reduced Photographic Meteors”. Smithsonian Contributions to Astrophysics, 10, 1–139.
Jenniskens P., Gural P. S., Grigsby B., Dynneson L., Koop M. and Holman D. (2011). “CAMS: Cameras for Allsky Meteor Surveillance to validate minor meteor showers”. Icarus, 216, 40–61.
Jenniskens P., Nénon Q., Albers J., Gural P.S., Haberman B., Holman D., Morales R., Grigsby B.J., Samuels D.,Johannink C. (2016). “The established meteor showers as observed by CAMS”. Icarus, 266, 331–354.
Jenniskens P., Baggaley J., Crumpton I., Aldous P., Pokorny P., Janches D., Gural P.S., Samuels D., Albers J., Howell A., Johannink C., Breukers M., Odeh M., Moskovitz N., Collison J., and Ganjuag S. (2018). “A survey of southern hemisphere meteor showers”. Planetary Space Science, 154, 21–29.
Jopek T. J. (1993). “Remarks on the meteor orbital similarity D-criterion”. Icarus, 106, 603–607.
Kornoš L., Matlovič P., Rudawska R., Tóth J., Hajduková M. Jr., Koukal J., and Piffl R. (2014). “Confirmation and characterization of IAU temporary meteor showers in EDMOND database”. In Jopek T. J., Rietmeijer F. J. M., Watanabe J., Williams I. P., editors, Proceedings of the Meteoroids 2013 Conference, Poznań, Poland, Aug. 26-30, 2013. A.M. University, pages 225–233.
Roggemans P. (2017). “Variation in heights of CAMS meteor trajectories”. eMN, 2, 80–86.
Roggemans P. and Johannink C. (2018). “A search for December alpha Bootids (497)”. eMN, 3, 64–72.
SonotaCo (2009). “A meteor shower catalog based on video observations in 2007-2008”. WGN, Journal of the International Meteor Organization, 37, 55–62.
Southworth R. R. and Hawkins G. S. (1963). “Statistics of meteor streams”. Smithson. Contrib. Astrophys., 7, 261–286.


