Abstract
A comprehensive analysis of the Leonids 2017 based on visual observational data sent to the International Meteor Organization and to the author. During the night of 16 to 17 November, some increased activity of the Leonids with bright meteors has been observed over Europe. Also during the night of 19/20 November, possible increased activity of the Leonids was observed over North America. This article zooms in on these two possible small outbursts of the Leonids observed by Kai Frode Gaarder from Norway and George Gliba from the U.S.
1 Introduction
It is already 15 years since we were able to observe the last major outburst of the Leonids. In the period after 2002 there have been a few smaller outbursts, such as in 2006, 2008 and 2009. Then the activity level calmed down. But every now and then the Leonids show some surprises. Also in 2017. On 17 November 2017 the author received an enthusiastic Facebook message from the Norwegian observer Kai Gaarder:
“I had great fun watching the Leonids tonight! I got 3.5 hours of observations, and both activity level and magnitude distribution changed a lot during the watch. First half of the period many bright Leonids were seen, and there was a complete lack of faint meteors. Then things suddenly changed. The bright meteors disappeared, and the faint ones started to show up. A short time activity level was quite good, before activity dropped to almost nothing at the end of the watch with the radiant high in the sky”.
A more detailed report of his observation has been described in MeteorNews [1]. His message remained in my mind, especially after capturing two bright Leonids in the night of 18/19 November 2017 with my all-sky camera: these were two Leonids of resp. -8 and -3. The brightest Leonid was also extensively recorded by other all-sky and CAMS systems in the BeNeLux [2 & 3]. Has there been something strange going on here?
The question remained unanswered for a long time due to other issues, until I received an email in early April from the American observer George Gliba about a nice Leonid activity on November 20. His observation is described in detail in “The Valley Skywatcher of the Chagrin Valley Astronomical Society” [4].
He wrote: “I was rewarded by seeing what was probably part of an older dust trail that was not predicted. I was also able to get in a good hour with clear LM = 6.5 skies. From 9:42 to 10:42 UT I was able to see 11 Leonids. The average Leonid was a relatively bright 1.6 magnitude and left a train. I also saw 3 NTA, 3 STA, 1 NOO, 1 AMO, and 9 SPO meteors. There were also seen a beautiful -2, a very nice -1, and two good 0 magnitude Leonids. It was cold out with a 6º F wind chill, but it was well worth it. I’m glad I didn’t go back to sleep after I put that last log on the fire (which I almost did)”.
As a result of both reports, I decided to make an analysis of the Leonids 2017. The interesting results are described in this report.
2 Collecting the data
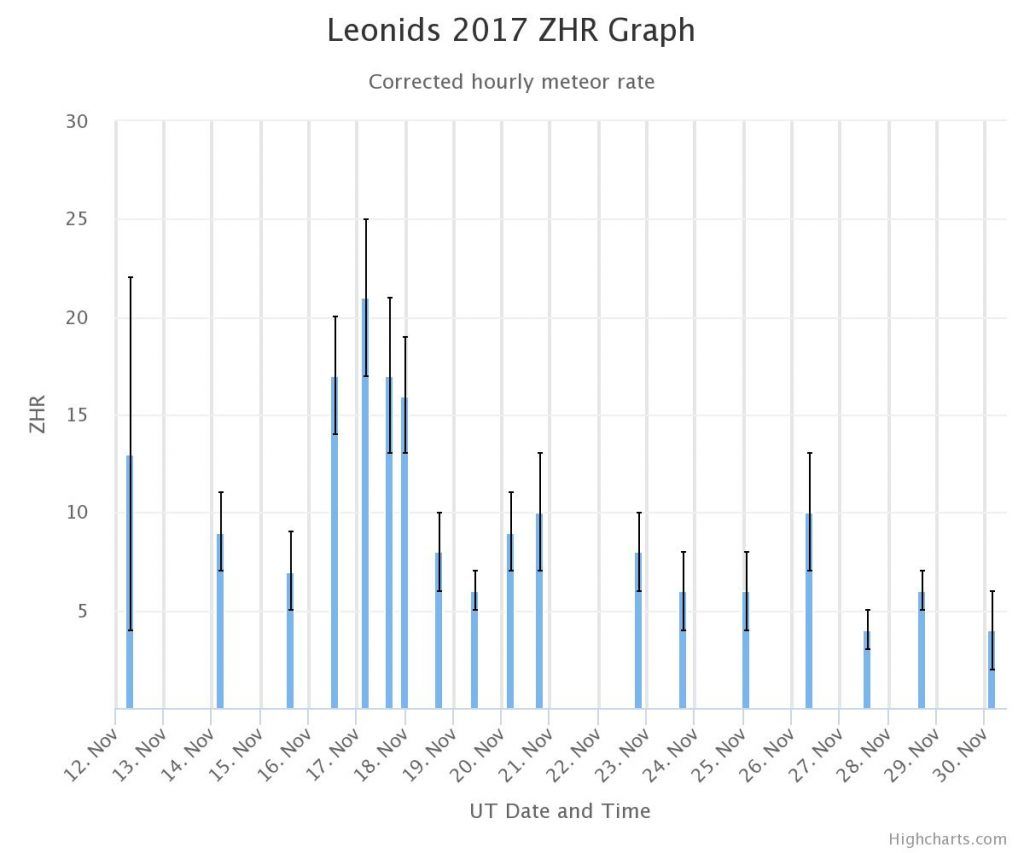
Figure 1 – ZHR Leonids 2017 “on the fly” profile on the IMO website.
http://www.imo.net/members/imo_live_shower?shower=LEO&year=2017
Unfortunately, there is very little data available from the Leonids 2017. The IMO site shows that 21 observers submitted data with observations made between 12 and 30 November. A total of 272 Leonids were reported. Figure 1 shows the “on the fly” curve based on data reported to IMO.
It is clearly visible that the highest activity according to this curve occurred in the night of 16/17 November over Europe. Furthermore, it also appears that this is only the data of Kai Gaarder from Norway, the weather for most European meteor observers was bad that night. The author also obtained data from observers who did not report to IMO.
After the data was stored in the ZHR spreadsheet it turned out that there is hardly overlap between the observations. That is very unfortunate, because that us the only way to check if there are some outliers. The fact that few observers were active in November 2017 may have to do with the fact that we are now in the off season period for the Leonids and that the weather hardly cooperated in 2017.
The data included in the ZHR spreadsheet met the following known requirements: the limiting magnitude should not be less than rounded off to 5.9, the minimum radiant height is 25 degrees and only data from observers with a known CP determination are used. In the end, 306 Leonids were used for ZHR calculations. This number is higher then reported to IMO, because some observers only sent data to the author.
3 Leonids 2017: Zenital Hourly Rate
The ZHR was determined using the method of Peter Jenniskens as described in [5 & 6] with the gamma being set to 1.0 instead of 1.4 in order to make a comparison with the IMO curve. Because very little data was available, no reliable calculation could be made for the population index r. Therefore, a value of 2.50 [7] has been assumed. The result is presented in Figure 2.
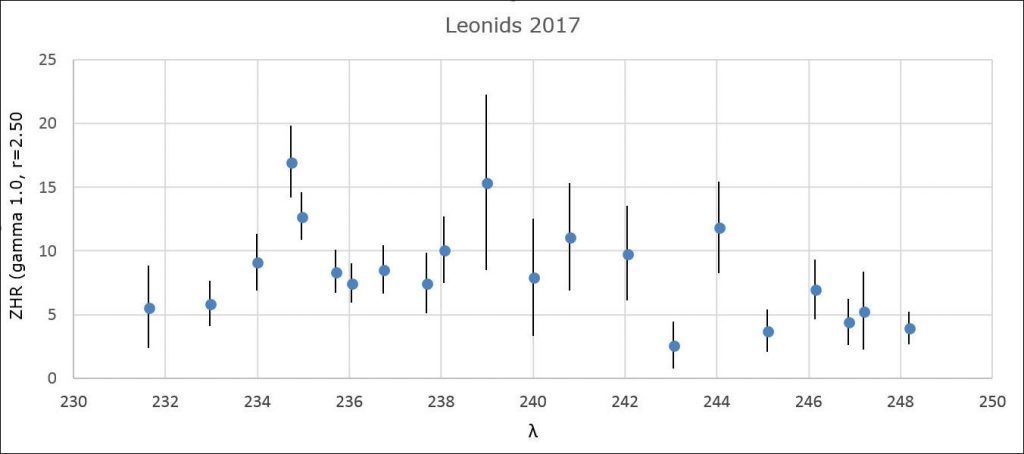
Figure 2. ZHR Leonids in 2017, based on 306 Leonids.
According to the IMO 2017 Meteor Shower Calendar [7] the nodal maximum of the Leonids was predicted at λ 235.27 (17 November 2017 at 16:30 UT) with a ZHR of 10. This time is very unfavorable because the maximum was above the Pacific ocean. Indeed and unfortunately there is no data available for the period November 17, 2017, between 10:00 and 20:05 UT.
The maximum activity of the Leonids as found in Figure 2 is visible on November 17 above Europe (λ 234,8). This is entirely and solely based on data from Kai Gaarder. Furthermore, a relatively high activity is visible near λ 239, but this ZHR point has a large deviation and is probably an outlier caused by a relatively low radiant level (30 degrees in this case) and this is data from one single observer. The points after λ 239,0 also have the same problems.
Furthermore, it is emphasized again that the ZHR graph was compiled on the basis of few data. Graph 3 is the same graph as in Figure 2, but now the colors of the ZHR points indicate how many count periods have been used for that particular ZHR point. This gives us a little insight into how reliable the ZHR points are. It is clear that a ZHR point based on 3 or (better) more periods is more reliable than a graph point based on only 1 period.
In Figure 4 a comparison with the on the fly curve of the IMO is presented. Note, the parameters of the IMO curve are different from those used by the author. The most important is that IMO uses a minimum limiting magnitude of 5.0 compared to the 5.9 used by the author. As a result, part of the data that is used in the IMO curve is not used. In addition, the CP ’s of the observers is also taken into account. As a result, the ZHR values of this analysis is slightly lower than those of the IMO.
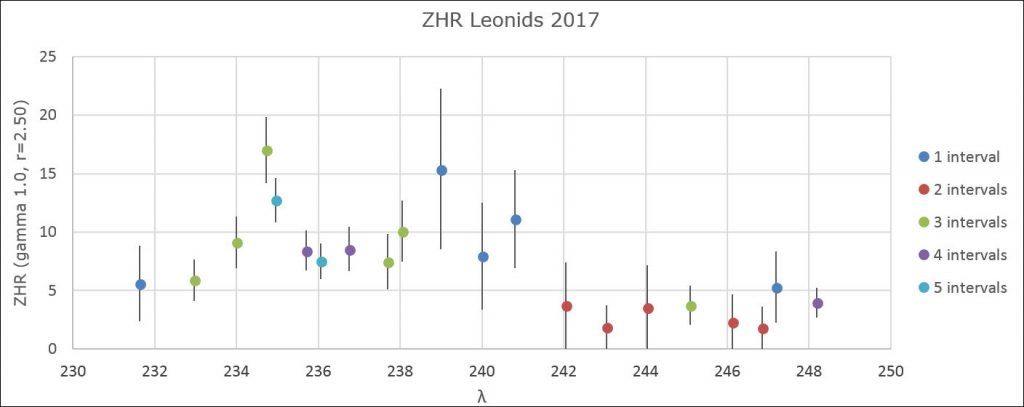
Figure 3. The same graph as from Figure 2, but now the ZHR points are in different colors to indicate the number of periods used for each ZHR point.
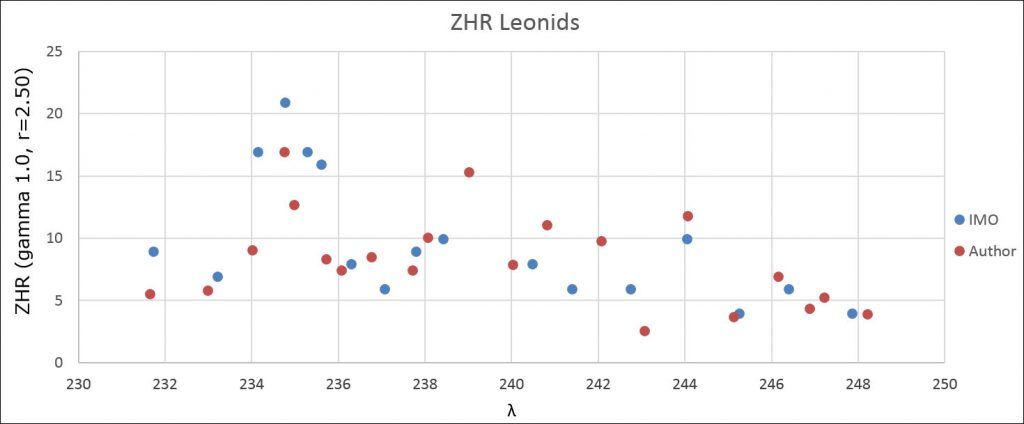
Figure 4. Comparison between the ZHR curve of the author and the on the fly curve of the IMO.
4 The observations of Kai Gaarder
Because Kai mentioned in his report in [1]; “a lot of bright Leonids and later more weak Leonids”, the author extensively analyzed his data once again. His data is summarized in Tables 1 and 2.

Table 1. Magnitude distribution of Leonids by Kai Gaarder on 17 November 2017 between 01:45 and 05:15 UT.

Table 2. ZHR Leonids 17 November 2017 based on hourly counts.
The magnitude distribution and the (uncorrected) average magnitude are striking. These drop by 2 magnitudes in the last hour. This is indeed a strange phenomenon. Kai Gaarder also reports in his report that the last bright Leonid of -2 appears almost immediately at the beginning of his last period, followed by an increase of weak Leonids. This activity also decreases at the end of his session.
A ZHR of 17 during his observational window is rather high, also taking into account that the maximum would take place 14 hours later with a maximum ZHR expected to be around 10. Table 2 also shows that there appears to be a constant ZHR with a ZHR of 17 for the entire period. Because Kai Gaarder’s report mentioned rapid changing activity, it was decided to do a ZHR analysis in much smaller intervals. At the request of the author, Kai sent his data in 5 minutes intervals. From his 5 minute counts 15 minute counts were made and these were used for ZHR calculations. A ZHR determination is then made every 5 minutes and based on the 15-minute counts. As r value, 2.00 was now adopted, this because of the bright Leonids. The result is very interesting despite the fact that this is a small amount of data! In Figure 5 the result is shown.
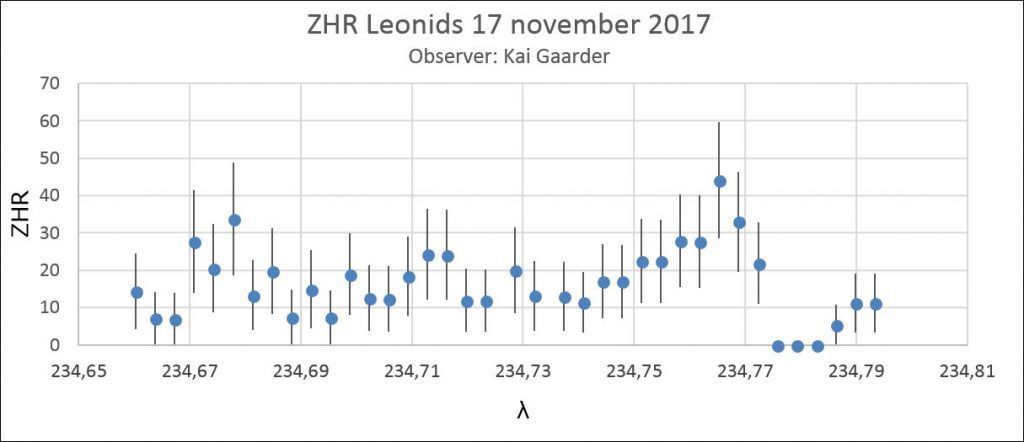
Figure 5. ZHR Leonids November 17, 2017 based on visual data from Kai Gaarder.
A cautious conclusion is that there seems to be a maximum around λ 234.68 (November 17, 2017 02:18 UT) with a ZHR of 34 (~ 15). This peak consists of mostly bright Leonids (magnitude between -2 and +3). A second peak is found at λ 234.77 (November 17, 2017 04:22 UT) with a ZHR of 43 and which consists of more weak Leonids (magnitudes between +2 and +5.). Between the two peaks, the ZHR is variable between 8 and 23 with still bright Leonids, but this activity decreases rapidly as the 2nd peak approaches. After the second peak, the activity collapses rapidly. Attention: the amount of data is not that big and may have a negative effect on this analysis.
A possible cause for this small outburst has been given by Mikhail Maslov [7 & 8]: an old dust trail of comet 55P Tempel-Tuttle from 1300. The maximum he predicted on 16 November 17:07 UT (λ 234,292) with a ZHR of 10 and bright meteors. It seems that Kai Gaarder has observed (part of) this outburst, although his observation session begins 6 hours later. The occurrence of the peak with weaker meteors does not fit with Maslov’s story. It is not clear how wide this expected peak would be, nothing is mentioned in the 2017 Meteor Shower Calendar [7] or in a Maslov publication from 2007 [8]. Also in the book by Peter Jenniskens [9] there is nothing to found for 2017, not for expected dust trails and not for any filament.
If we look at the well-known radio graphs of the Japanese based on worldwide radio data from the RMOB (Figure 6), we indeed see the highest (radio) activity of the Leonids close to Maslov’s time in 2017. The peak observed by Kai Gaarder is somewhat later than the radio peak. The radio data is converted to a visual ZHR, but it is not clear how this is done exactly.
The nearest visual observation at the time of Maslov’s prediction for the 1300 dust trail is next to that of Kai Gaarder, as well as that of Terrence Ross (Texas, USA) from November 16, 2017 from 07:53 to 10:00 UT (λ 233,905 to 233,994), which is 7 hours earlier. It is striking that half of the 8 observed Leonids are of magnitude 0 and -1.
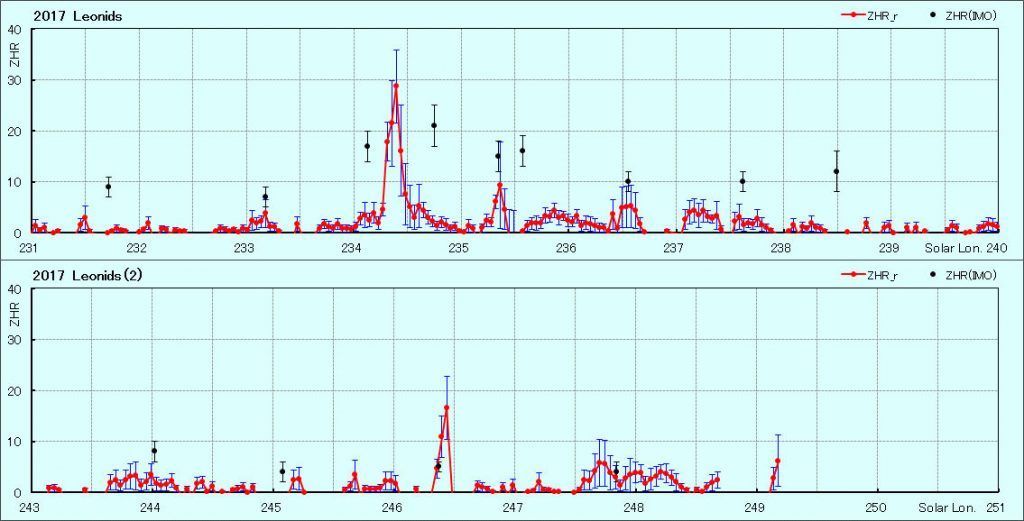
Figure 6. Activity curve of the Leonids 2017 based on radio data from the RMOB.
5 The observations of George Gliba
In the early morning of November 20, 2017, George Gliba witnessed nice Leonid activity from Mathias, West Virginia, US. He counted 11 Leonid’s between 09:42 and 10:42 UT (resulting in a ZHR of 13), including a number of bright Leonids. This took place around λ 238.038. The Japanese radio curve (Figure 6) hardly shows any Leonid activity around that sun length.
Subsequently, we looked in detail at data from other observers who were active in the same night, e.g. Robert Lunsford (from El Cajon, California, US) and Terrence Ross (from Alpine, Texas, US). Table 3 gives an overview of their data (including the data of George Gliba).

Table 3. Data from 3 observers for the night November 20, 2017 (UT).
Note: in the ZHR calculation only the data from Robert Lunsford is taken from the period 12:00-13:00 UT.

Table 4. Individual ZHR values on November 20, 2017 (US only).
Altogether, the observational data shows a hint of increased activity, especially taking into account that it was observed on November 20. Neither in the article by Maslov [8] nor in the book by Peter Jenniskens [8] have we found anything that may have caused this possible outburst.
6 Conclusions and recommendations
The Leonids of 2017 have been moderately observed. The nodal maximum expected to fall above the Pacific has not been observed. The observation of Kai Gaarder for the night of 16/17 November 2017 shows an increased activity with nice bright Leonids up to -3. According to Maslov [7 & 8], the cause could be an old dust trail from comet 55P Tempel-Tuttle from 1300. The radio data from RMOB matches better with the prediction of Maslov than the observations of Kai Gaarder.
There may also have been some increased activity observed by George Gliba and Terrence Ross on November 20, 2017 at ~ 10 UT. A possible explanation for this is not yet known. The activity is not confirmed by the RMOB radio data. It is known that enhanced Leonid activity has been observed more often around and after 20 November. A good example is 22/23 November 2015 when some activity was observed from a dust trail from 636. The observations of Gliba and Ross therefore clearly show that the period (far) after the Leonid maximum may still be full of unexpected surprises. The modelers should take a look at old dust traces of comet 55P Tempel-Tuttle after November 18th.
Therefore it is advisable for observers to continue observing (far) after the Leonid’s maximum. Go observing from a dark location where the limiting magnitude is at least 5.9. Watch preferably in the last hours of the night when the Leonid radiant is high. Also ensure that there is sufficient sporadic data from the period 25 July to the end of August between 0 and 4 am local time. Then a reliable CP can be calculated and the analysis becomes more robust.
Acknowledgments
A very big thank you goes out to all observers who observed the Leonids of 2017. These are: Pierre Bader, Kavita Bandivadekar, Katie Demetriou, Kai Frode Gaarder, George Gliba, Prayang Gore, Gabriel Hickel, Glenn Hughes, Paul Jones, Khaty Prajakta, Pete Kozich, Sneha Kulkarni, Robert Lunsford, Meghan Mohite, Ina Rendtel, Jurgen Rendtel, Terrence Ross, Talekar Dnyaneshwari, Shigeo Uchiyama, Roland Winkler, Michel Vandeputte, Frank Wächter, Sabine Wächter and Geng Zhao.
A special thanks to Kai Frode Gaarder and George Gliba for sending additional Leonid data and their heads-up about these two events. And last but not least, a word of thanks to Michel Vandeputte, Paul Roggemans and Carl Johannink for the critical reading of this article. Thanks to Paul for checking my English.

