An overview of the radio observations during April 2018 is given.
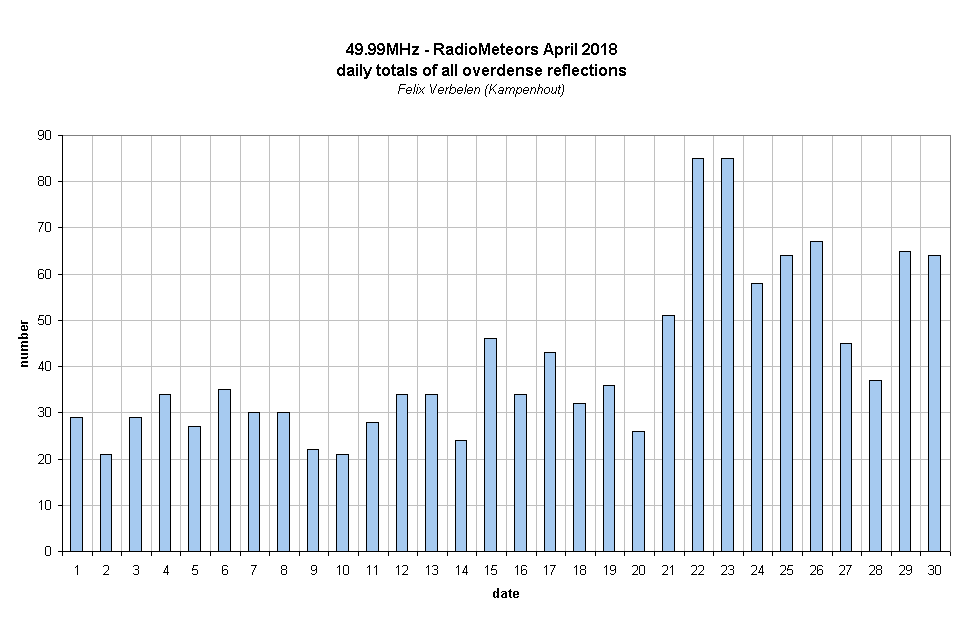
The graphs show both the daily totals (Figure 1) and the hourly numbers (Figure 2) of “all” reflections counted automatically, and of manually counted “overdense” reflections, overdense reflections longer than 10 seconds and longer than 1 minute, as observed here at Kampenhout (BE) on the frequency of our VVS-beacon (49.99 MHz) during April 2018.
The hourly numbers, for echoes shorter than 1 minute, are weighted averages derived from:
N(h) = n(h-1)/4 + n(h)/2 + n(h+1)/4
As expected the Lyrids shower peaked on 22/23 April.
If you are interested in the actual figures, please send me an e-mail: felix.verbelen at skynet.be
Figure 1 – The daily totals of “all” reflections counted automatically, and of manually counted “overdense” reflections, overdense reflections longer than 10 seconds and longer than 1 minute, as observed here at Kampenhout (BE) on the frequency of our VVS-beacon (49.99 MHz) during April 2018.
Figure 2 – The hourly numbers of “all” reflections counted automatically, and of manually counted “overdense” reflections, overdense reflections longer than 10 seconds and longer than 1 minute, as observed here at Kampenhout (BE) on the frequency of our VVS-beacon (49.99 MHz) during April 2018.
