Koen Miskotte (1) and Michel Vandeputte (2)
1 Dutch Meteor Society
k.miskotte@upcmail.nl
2 Dutch Meteor Society and Vereniging voor Sterrenkunde
michel.vandeputte@hotmail.com
Enhanced Perseid activity had been predicted for 2016 as a result of a sequence of encounters with some dust trails as well as the effect of perturbations by Jupiter which made Earth crossing the main stream deeper through more dense regions. Visual observations resulted in a detailed activity profile and population index profile, the observed features in these profiles could be matched with the predicted passages through the different dust trails. The 4 Rev (1479) dust trail in particular produced a distinct peak while the 7 Rev (1079) dust trail remained rather at a somehow disappointing low level. The traditional annual Perseid maximum displayed enhanced activity due to the 12 Rev (441) dust trail.
1 Introduction
Since a few years it was known that the 2016 Perseids could produce an exceptional display. Several outbursts were expected due to the presence of a number of dust trails from the parent comet 109/P Swift-Tuttle, thanks to the perturbations caused by the planet Jupiter. The very same perturbations would cause the background component (the annual activity) to produce a better than usual display as Earth would pass through the more dense parts of the meteor stream.
And yes, we did not get disappointed! During the night of 11 on 12 August the Perseids performed full strength above Europe and America. This analysis presents the calculated results for the nights 11–12 and 12–13 August, completed with a few impressions from the field.
2 The predictions
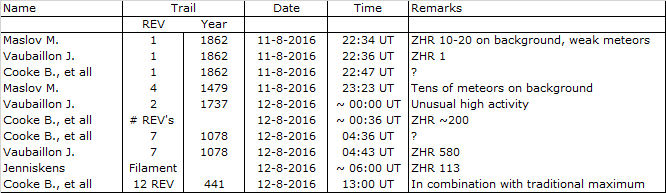
An overview of the different predictions is presented in Table 1.
Table 1. Perseid predictions
3 Weather circumstances Europe
Unfortunately the weather wasn’t everywhere very cooperative: 11–12 August happened to be totally cloudy for the BeNeLux. That was very unfortunate as we had liked to have CAMS data for this night. The next night was a perfect clear night and Jos Nijland was able to observe the Perseids from Drenthe. Both authors stayed in the famous hamlet Revest du Bion. Although cirrus clouds were predicted, the circumstances were better than expected and we had a nice clear night. The night 12–13 August happened to be clear as well. The group at Petnica couldn’t observe that night due to clouds and rain. This was a great pity as this group includes several good and active observers. The next night Petnica had clear sky.
The group at La Palma included Klaas Jobse, Carl Johannink, Sietse Dijkstra, Felix Bettonvil, Thomas Weiland and photographer Casper ter Kuile. They suffered in first instance from Calima, but 11–12 and especially 12–13 August were clear nights. Peter van Leuteren could very well observe the night of 11–12 August from the island Madeira in spite of large forest fires.
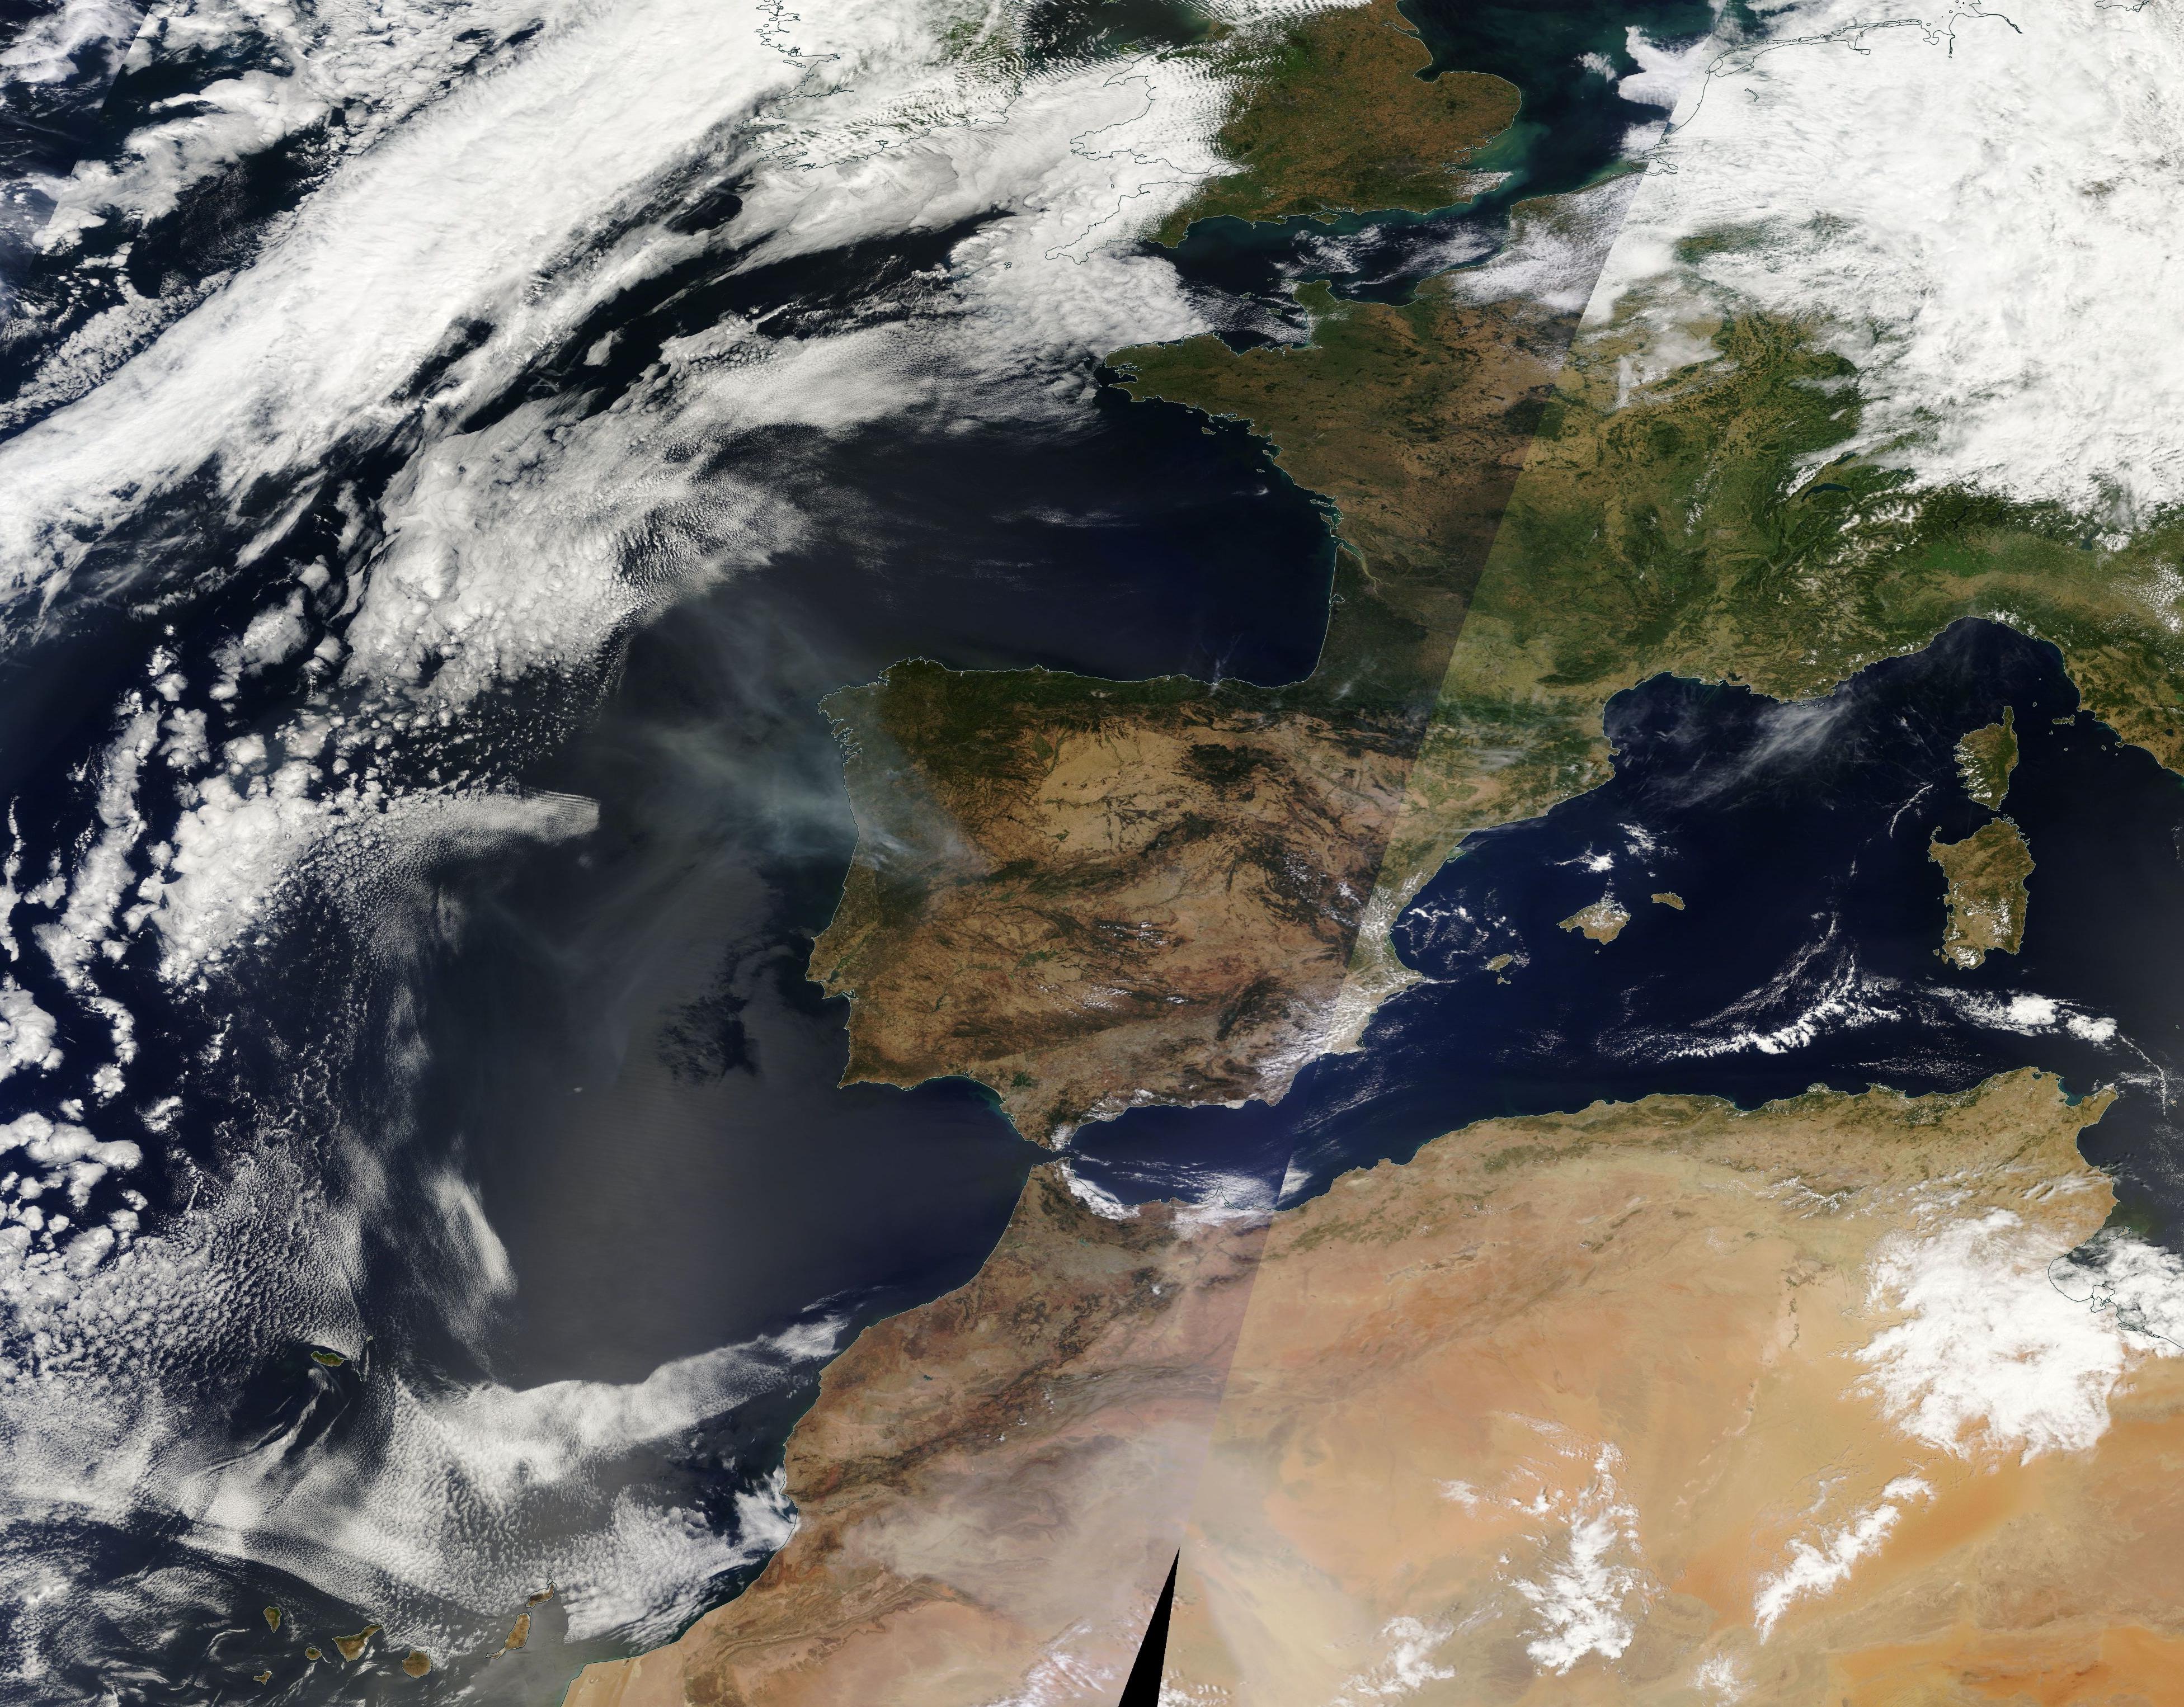
Figure 1 – Terra Modis picture of 11 August 2016 of Southern France, North Africa, Madeira and La Palma.
4 Collecting data, which data to use?
A large number of observations were provided through IMO. The number of Perseids used for the analyses totals 20946 and can be found on the IMO website(*1). In the IMO ZHR profile a population index of 2.0 and a radiant elevation correction of 1.0 have been assumed. For this reason we cannot compare this analysis with our work.
Collecting the data happened in a slightly different way than during previous analyses. First of all we looked for observers for who we already had a reliable perception coefficient (Cp). For this purpose we used the list of the 2015 global Perseid analyses (Miskotte, 2015). Then, we searched for data provided by these observers for the period 10–13 August. Additional selection criteria for data included the radiant elevation (minimal 25° or higher) and the limiting magnitude (lm minimal 5.9 or better). Unfortunately many observations did not pass this quality control, only 50% of the data survived the selection criteria. Especially the bad weather above South-East Europe was responsible for the loss of a lot of data: especially the absence of data from the large group in Petnica, Serbia, had a great effect. There was also a large group of new and occasional meteor observers which did not qualify due to the lack of a reliable Cp value. We checked for people in this group who observed at least 15 to 20 hours during August 2016 in order to obtain a Cp coefficient, but unfortunately this was not the case.
It was striking that a considerable number of observers were active in China, but also in this case it concerned people with only few hours of observations. There is a great observing potential in China and it would be very helpful if these people would make some more observations end of July or during August.
The complete list of observers who reported Perseid data can be found on the IMO website (*2).
*1 http://www.imo.net/members/imo_live_shower?shower=PER&year=2016
*2 http://www.imo.net/members/imo_live_shower?shower=PER&year=2016
5 Methodology
First of all, the data on the IMO website has been screened and checked on the perception coefficient Cp and the limiting magnitude. When the criteria were fulfilled the data was downloaded. This data was imported into the ZHR and magnitude distribution checking spreadsheet. For the magnitude distributions the following rule has been applied (Miskotte, 2016): The difference between the average limiting magnitudes should be smaller than 4.5 magnitudes. Normally we keep this limit at 4 magnitudes, but because the Perseids were on average brighter than usual we choose to set the limit at 4.5 magnitudes.
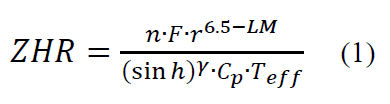
The remaining magnitude distributions allowed calculating the r-values. These r-values were imported into the ZHR spreadsheet with the meteor counts. Next all data were sorted on solar longitude while data with too low radiant elevation (until 25° elevation) and a couple of outliers were removed. The ZHR was computed according to the formula of Peter Jenniskens (Jenniskens, 1994; Miskotte and Johannink, 2005a):
6 11–12 August 2016: Europe and America
We decided to use shorter intervals for the ZHR analyses because of the rapidly fluctuating activity during the night of 11–12 August 2016. Periods of 15–20 minutes have been used calculated as a sliding mean for every 5 minutes. The ZHR was calculated using the available r-values and the result is displayed in a graph (Figure 2). Data has been used for the period 11 August 2016, 21h UT until 12 August 2016 12h UT. The entire analyses and Figures 2 to 8 are based on the data of 11610 observed Perseids.
To have a better view on the activity pattern above Europe we zoom in on the graph of Figure 2 in Figure 3.
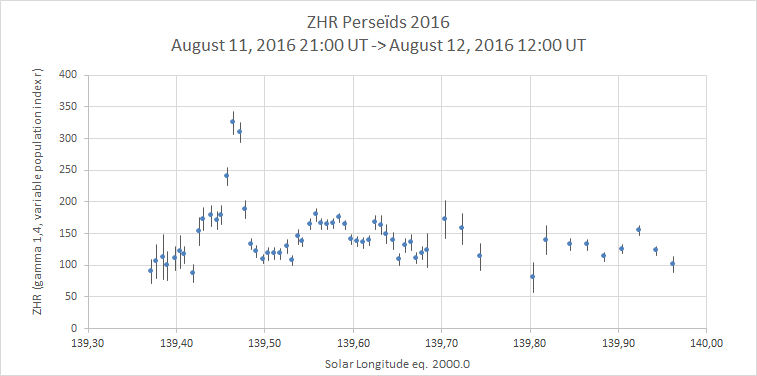 Figure 2 – ZHR profile for the Perseids 2016 from 11 August 2016 21h UT until 12 August 2016 12h UT.

Figure 3 – ZHR profile for 11–12 August 2016, between 11 August 21h UT and 12 August 07h UT.
The orange dots are computed with American data. See also the description in Section 6.
Both graphs show very clearly that the ZHR was enhanced over the entire period, when we compare with what a normal ZHR used to be at these solar longitudes. Unfortunately there exist no ‘standard ZHR profile’; therefore we looked at the DMS data from 2007, 2010 and 2012. The years 2004 and 2008 were not taken into account because these were years with outbursts (Johannink et al., 2008; Miskotte and Johannink, 2005b; 2005c). The result is displayed in Figure 4. The trend line obtained for the years 2007, 2010 and 2012 has been used in Figure 5. Figure 6 displays the time when peaks occurred.
When we pay attention to the ZHR profile of 11–12 August 2016 (Figure 6), it is obvious that the ZHR was already enhanced at the start of the night with ZHRs of about 100 while 60–70 are ‘normal’ values. The next feature is a sharp increase of the activity around 22h20m UT reaching ZHR values of 150. The activity remains stable at this level until 23h00m UT when a spectacular increase occurs with peak ZHR values of 320 at 23h17m UT. The display around this time was most impressive. The activity quickly drops to a ZHR of 185 at 23h36m UT and another 10 minutes later the ZHR had been lowered to 130.
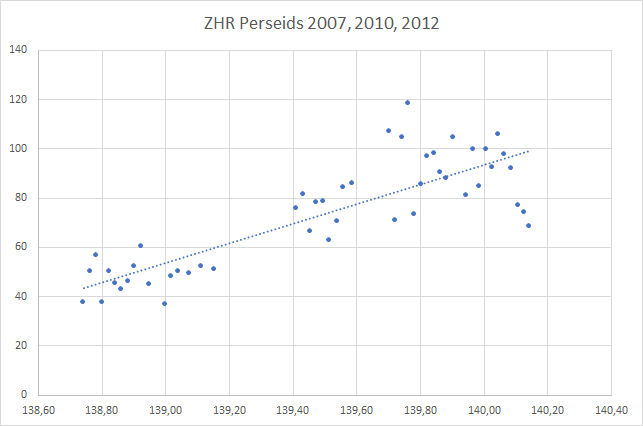
Figure 4 – ZHR values calculated from the years without Perseid outbursts, 2007, 2010 and 2012.
This trendline was used in Figure 5. Source: DMS electronic visual archive.
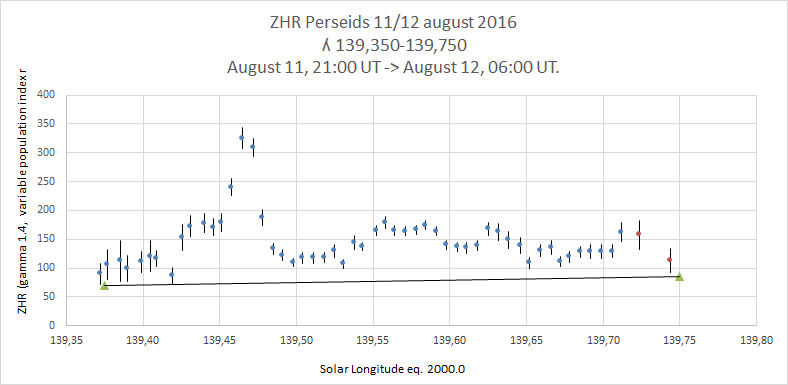
Figure 5 – The ZHR profile 2016 for 11 August, 21h00m UT to 12 August, 06h00m UT, 139.350°< λ < 139.750°with the trend line for 2007, 2010 and 2012 added. It is obvious that the activity remained at a significant higher level all the time, compared to the reference years.
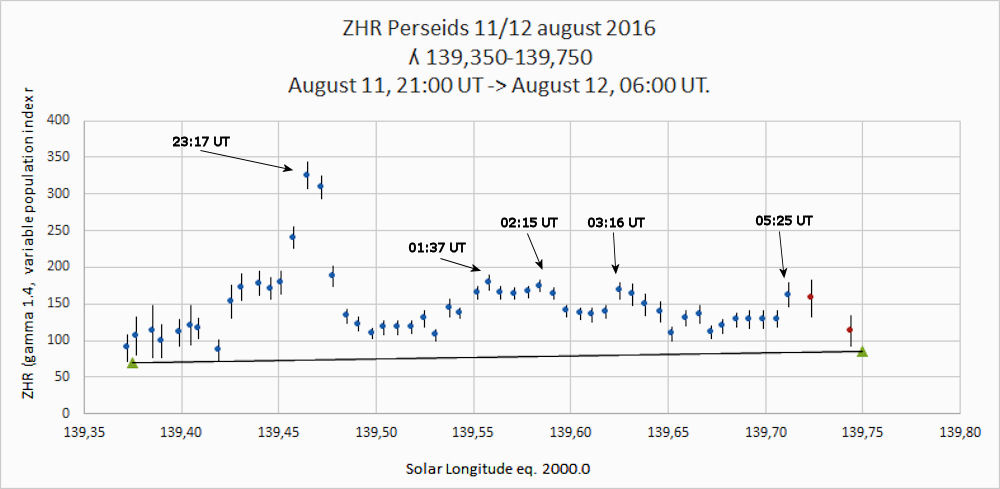
Figure 6 – The same ZHR profile as Figure 5, but with the timing of the different peaks.
Michel Vandeputte describes the display very well (Vandeputte, 2016):
“A nice –4 and a –3 started the top activity. Perseus spews literary meteors hither and thither across the sky, sometimes with 3 meteors at once! It was difficult to keep track at some moments to record everything correctly, such a high rate. This peak activity lasted for a quarter of an hour in the period 23h15m–23h30m UT with the strongest concentration shortly after 23h20m UT. This was completely in line with the expected peak of the 4 revolution old dust trail from 1479 (Maslov with peak time 23h23m UT!). The activity fluctuated a lot during this crazy time lapse, but on average 5 meteors per minute were counted during these insane 15 minutes of observing time with perhaps moments with 7-8 meteors per minute! All this appeared with the radiant at only 36° above the horizon. The decrease after the peak was even more impressive. Just like they appeared out of nothing, they were suddenly gone, followed by awful silence at the dark sky. Wow and wow again! Both observers were strongly impressed by the intensity of this display!”
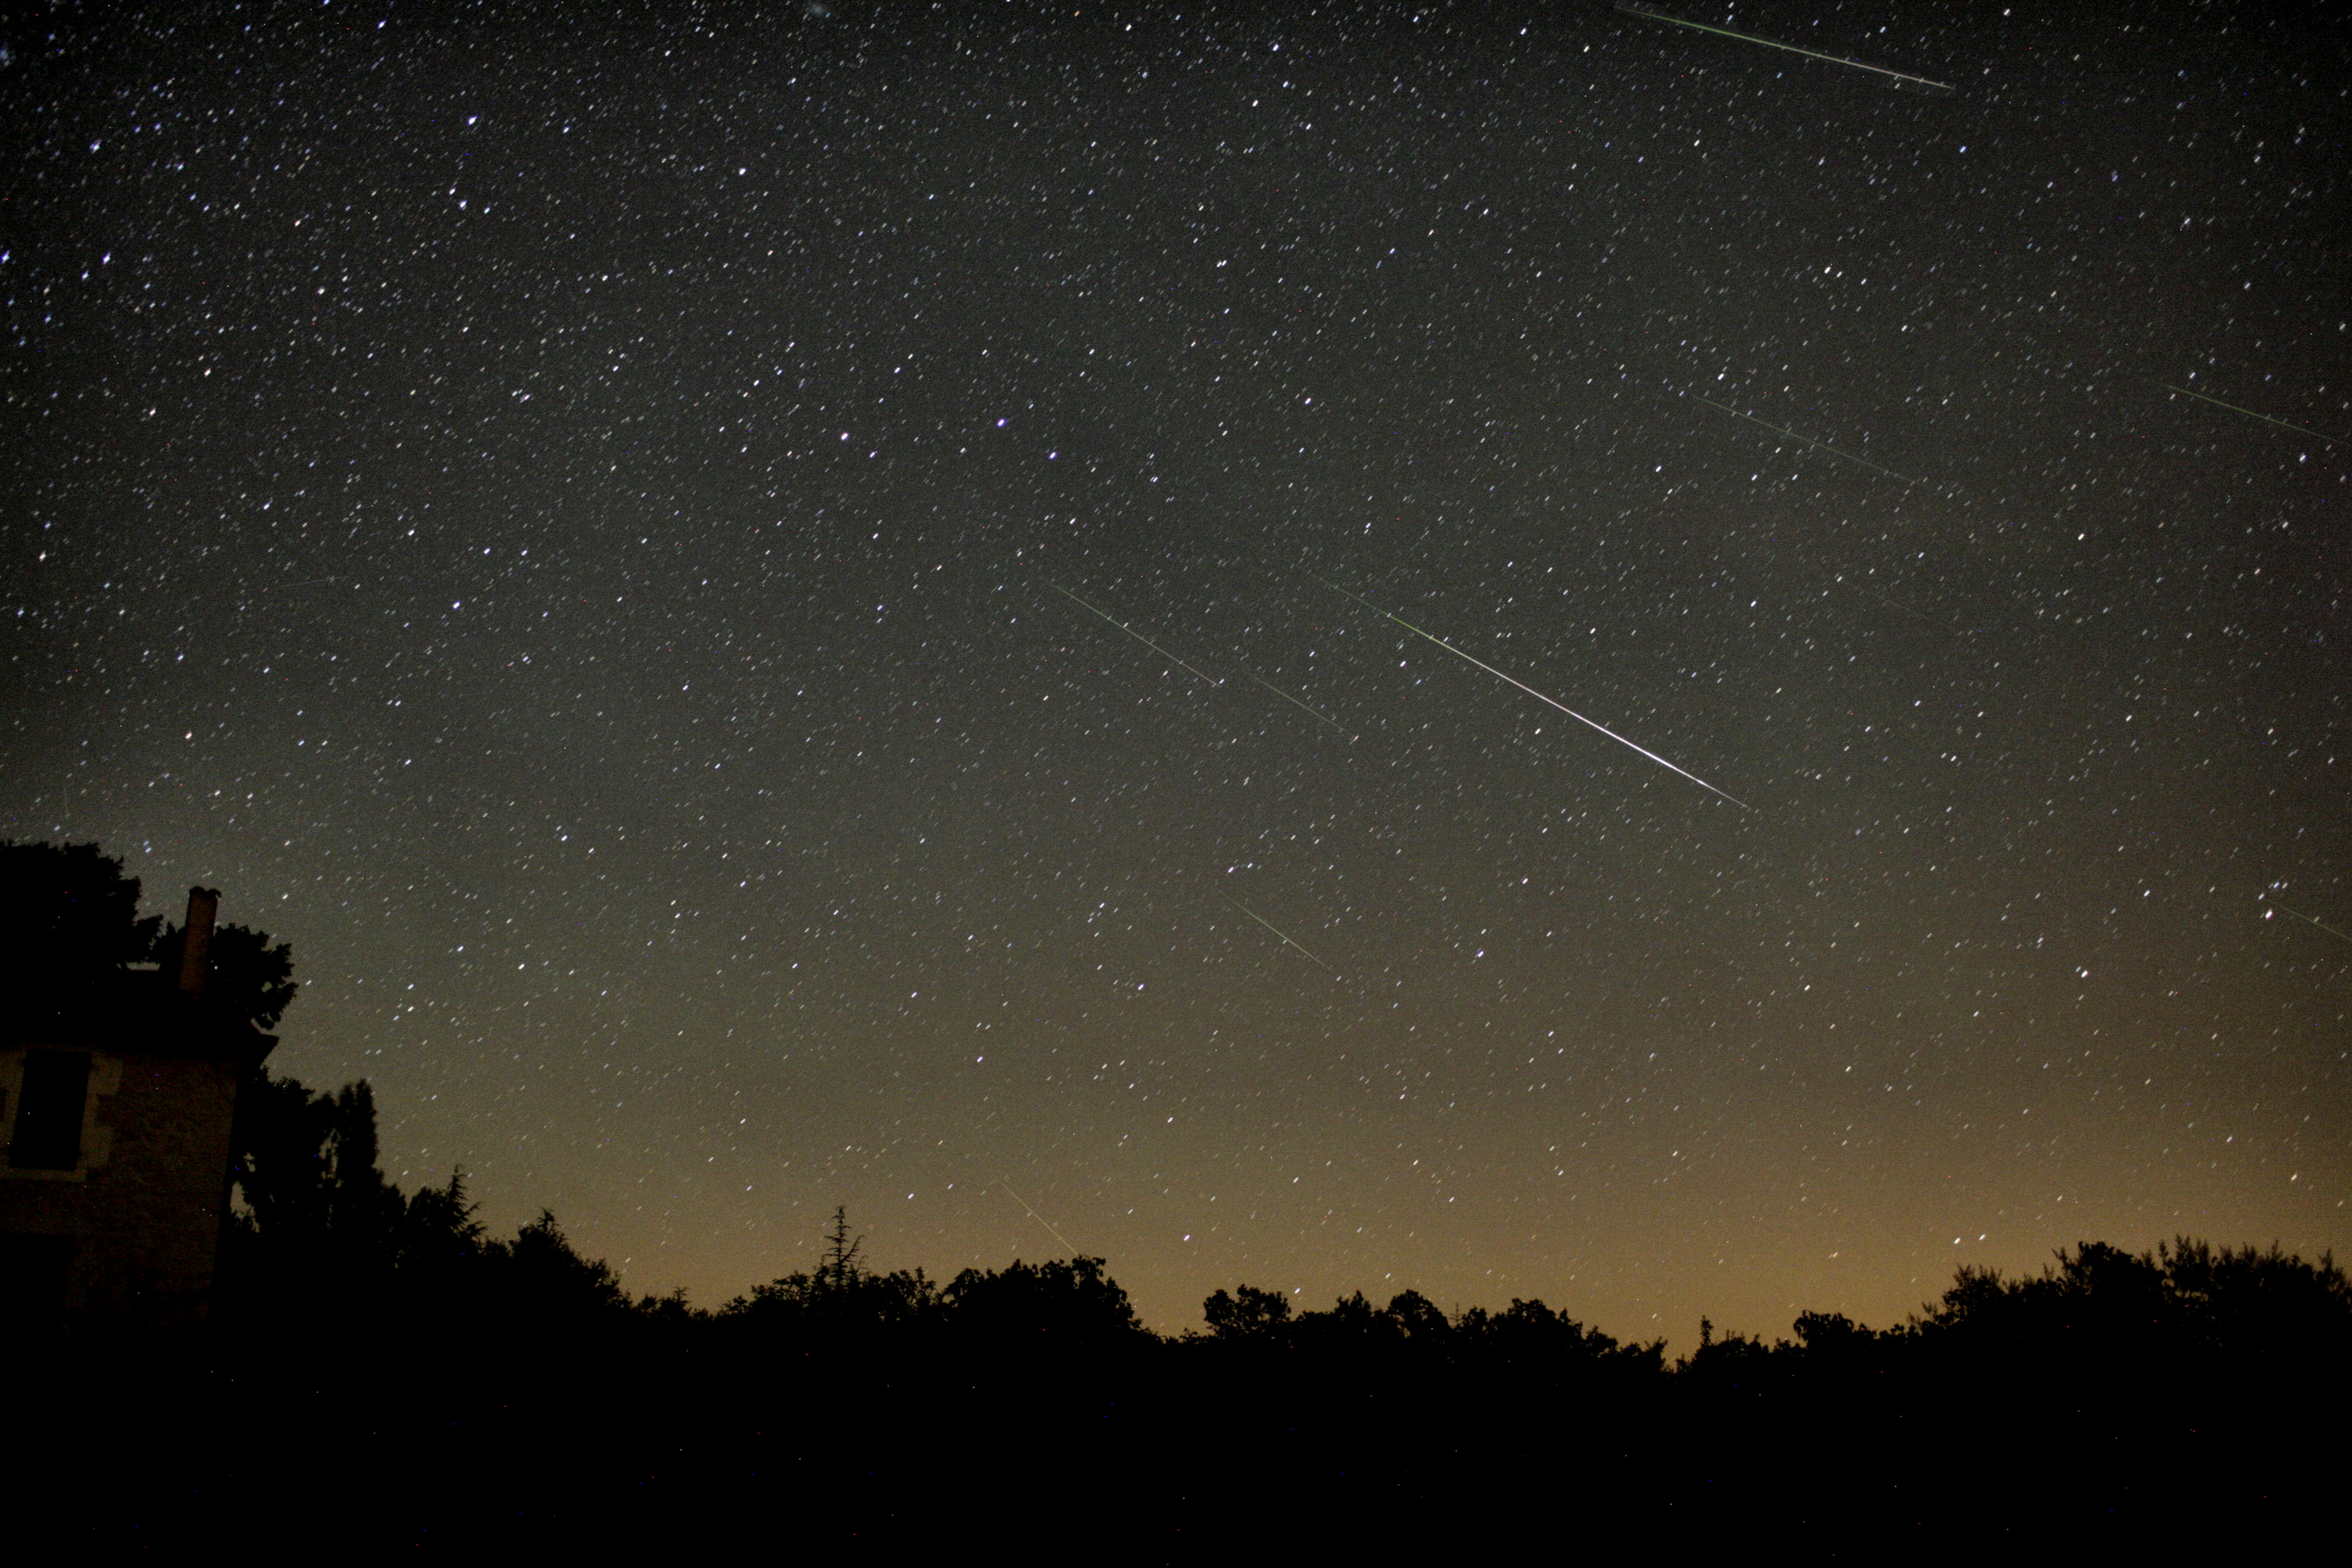
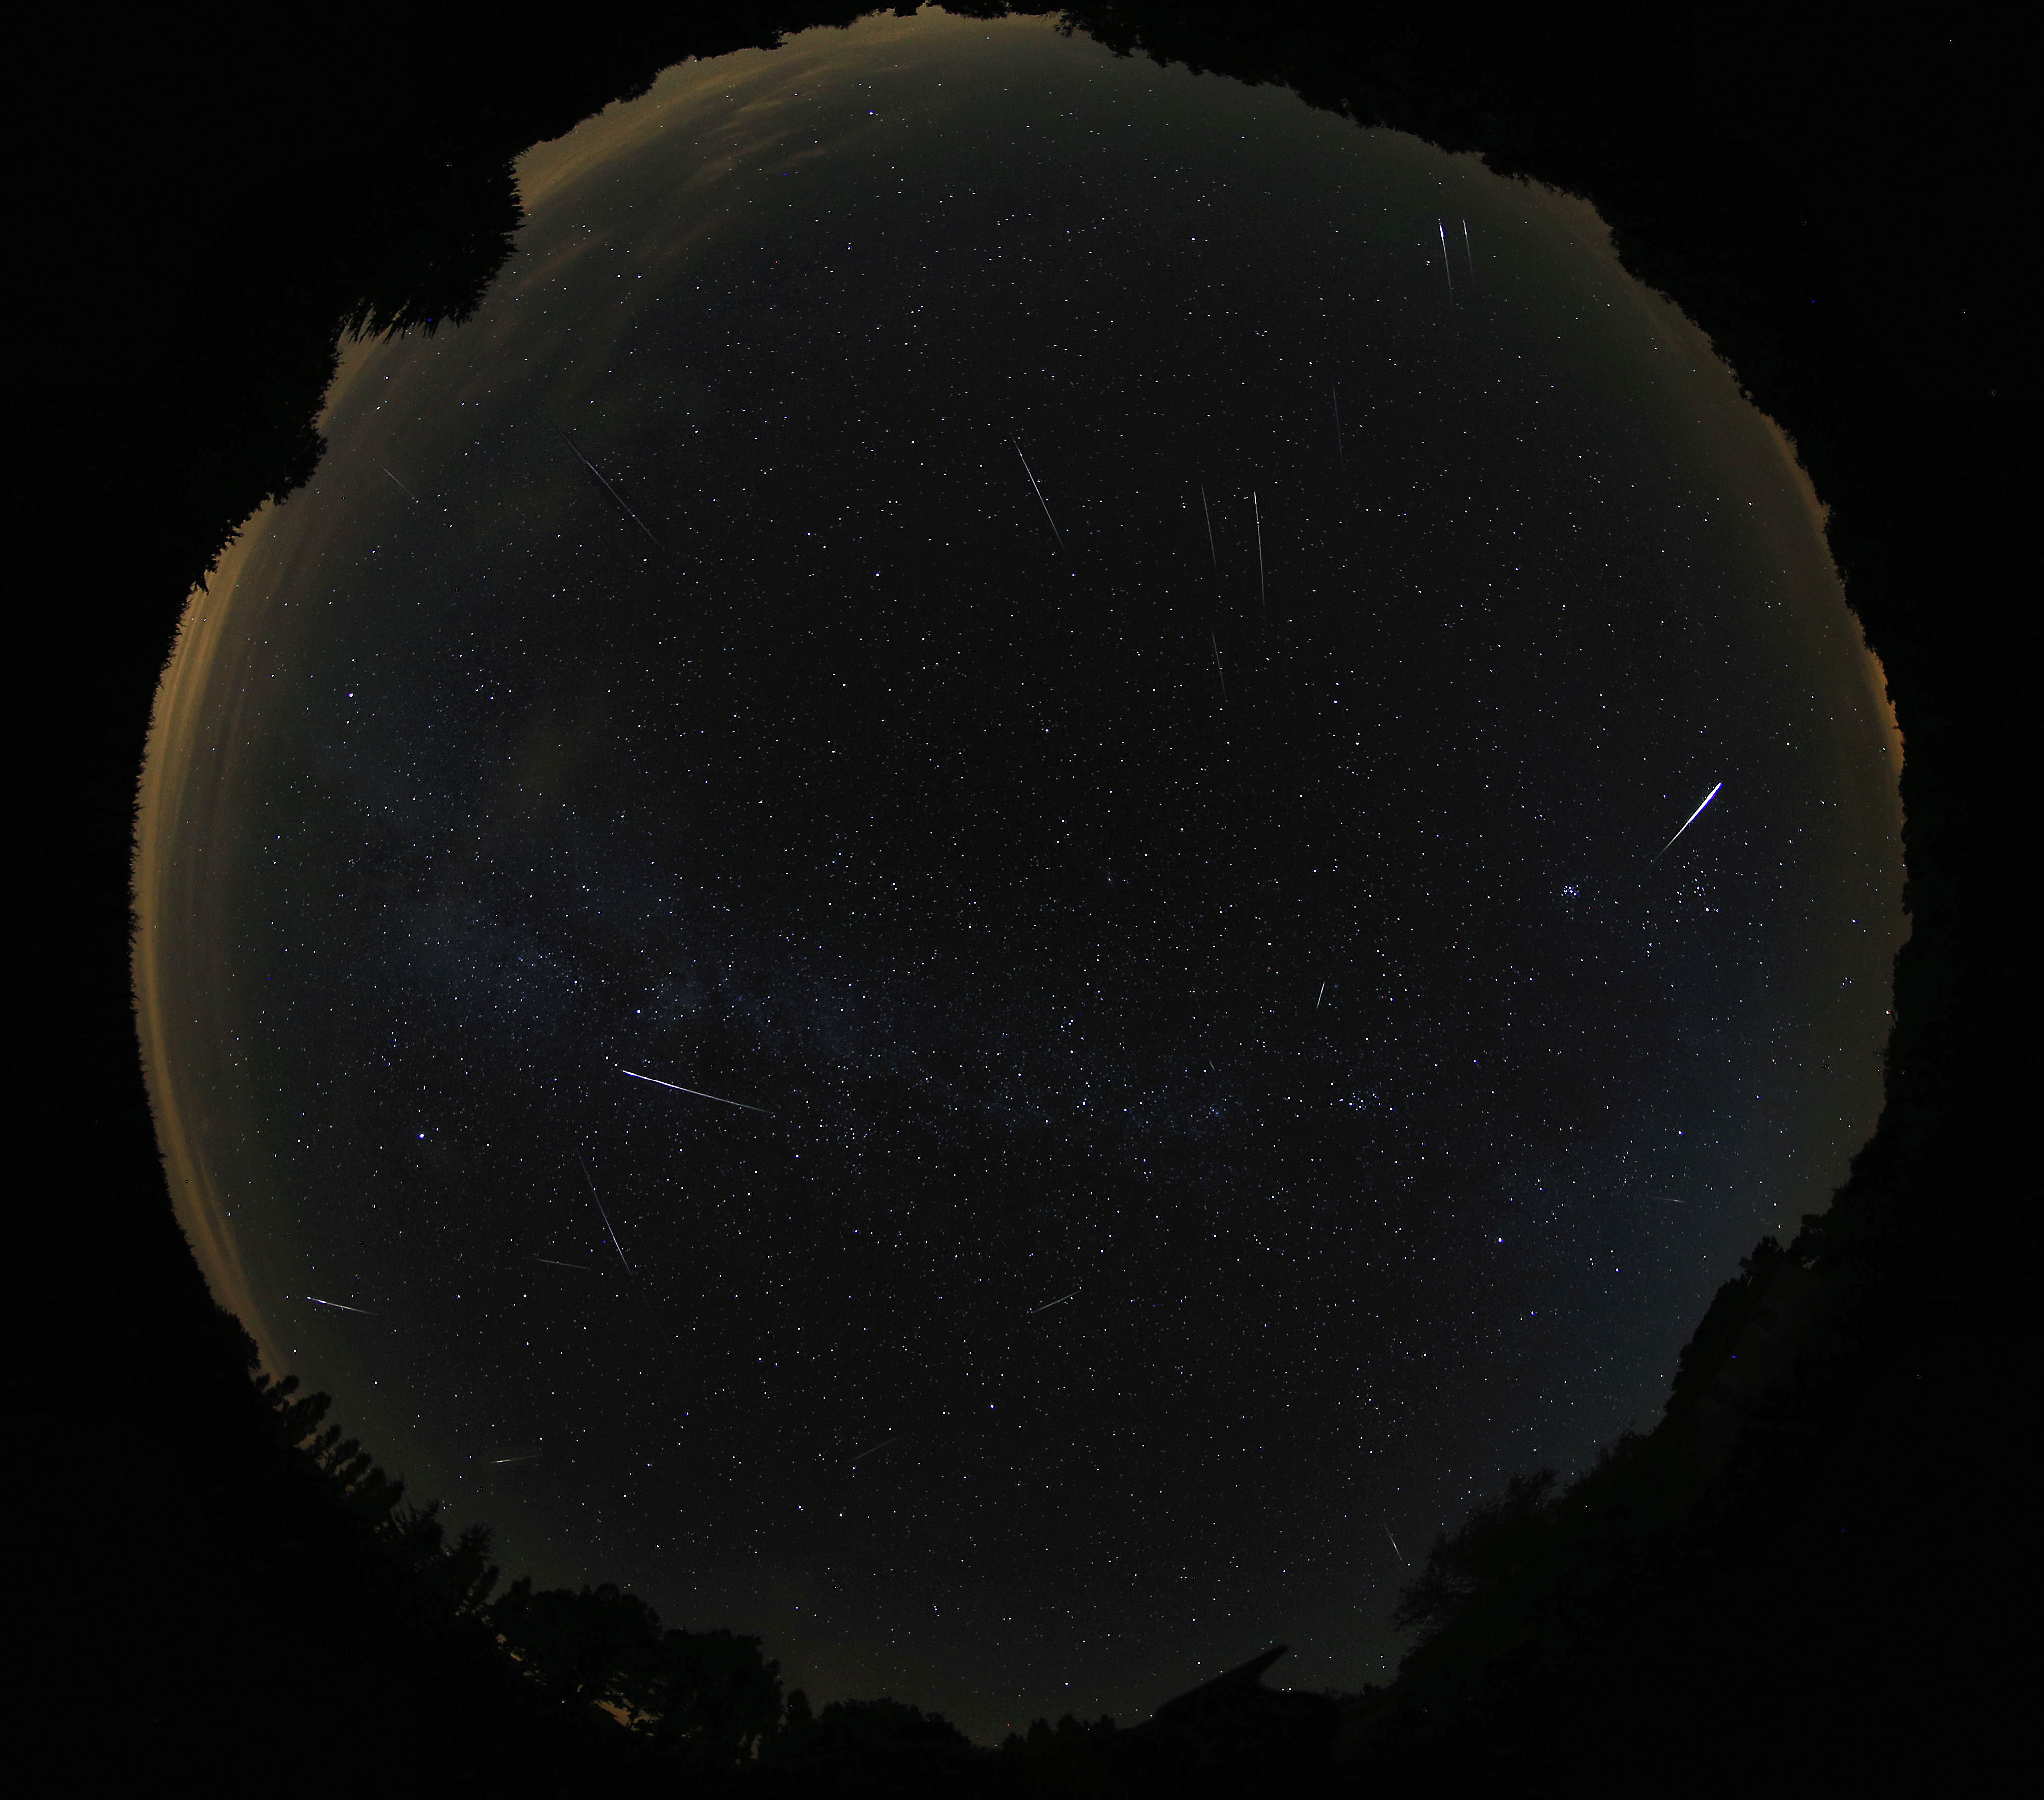
Figure 7 – Composition picture of 11 August 2016 taken during the peak related to the 4 Rev dusttrail. The interval covers 23h17m–23h25m UT. 10 Perseids are visible, the brightest –3 Camera: Canon 5D with Canon EF 35 mm F 1.4 (F=1.8), ISO 1250, exposuretime 29 s. Location: Revest du Bion, Povence, France.
Thereafter the ZHR remained for a while around 110–120. During this time a number of nice fireballs up to magnitude –8 were observed. From 01h00m UT the ZHR increases again to culminate at peak values at 01h37m UT and 02h15m UT (ZHR ~ 170–180). Then more bright Perseids appeared, within a few minutes around 02h15m UT a number of events of magnitude –4, –5, –6 and –8 were seen from Revest du Bion. After a drop in the activity level another peak was observed one hour later around 03h16m UT. Twilight had started in France but still an impressive activity is being observed. Also this peak was accompanied with a fireball with a –8 end flare. The observers at La Palma and Madeira were perfectly positioned for this peak. After this peak the activity dropped back to a ZHR of 130, but the observers at La Palma saw again a rapidly increasing activity in the last 15 minutes. The observations during this period have overlap with the American observations reported by George Gliba and Paul Jones. They report many bright Perseids while the radiant is still low above the horizon, observations that concur very well with the reports from La Palma.
The last two (orange) dots in Figures 3, 5 and 6 are based on data from George Gliba. Unfortunately we couldn’t include the data of Paul Jones due to the presence of 25% cirrus clouds and the reporting in one hour intervals (too long).
Paul Jones wrote:
“The first couple of hours were somewhat slow as the moon sank and the cirrus dissipated. Still, we were able to catch several long-pathed early Perseids streaking up from the radiant which was grazing the northeast horizon at that time. We saw them all over the sky, even in the west and SW – many bright and colorful, leaving spreading trains behind them”.
In spite of the 25% cloud cover, a number of calculations were done with the data of Paul Jones. Based on these hourly counts a ZHR of about 180–200 could be obtained for this period. For reasons of clarity, this data has not been taken into account for the final ZHR calculations because of the too large portion of obscured sky. This calculation was done to check if his observations confirm the increased activity reported by George Gliba.
Thereafter we notice a decrease in activity to an almost normal level after the peak at 05h25m UT above America, followed by a new increase in activity up to ZHR values of 150 on 12 August around 10h45m UT. After this peak, activity decreases again to a normal level with a ZHR of 100 at 11h45m UT.
7 The r-values during the outburst
A nice population index r profile could be reconstructed. According to IMO the normal r-value for the Perseids is 2.2 (Vandeputte, 2016). The r-value remained inferior to this value for most of the time of the outburst. Table 2 lists the computed values.
Table 2 – The calculated r-values, based on the magnitude interval of [–2,+5].
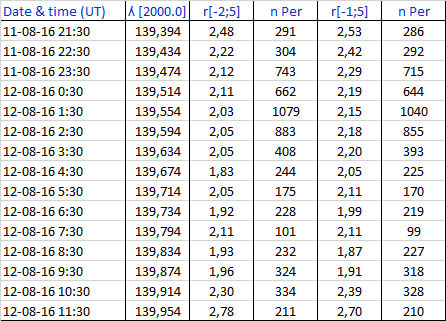
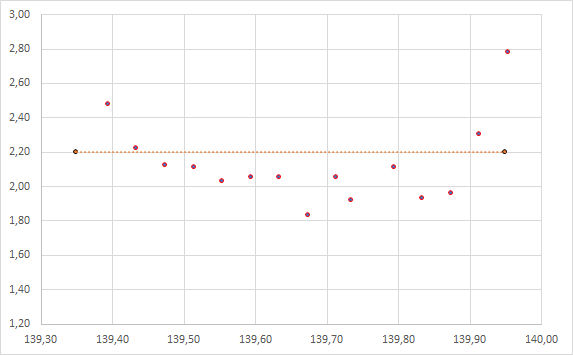
Figure 8 – The population index r for the Perseids during the outburst, August 11, 2016 at 21h00m UT until August 12, 2016 at 12h00m UT. This graph is based on Table 2 (in total 6229 Perseids). De line (orange) marks the standard r-value of 2.20.
Observers at Revest du Bion, France (the authors) and in Poland (e.g. Jürgen Rendtel and Sirko Molau) mentioned several bright Perseids just before the major peak at 23h17m UT. This had no effect on the r-value. A possible explanation follows in a next section. During this peak the population index r had a normal value of 2.2, see also Figure 9.
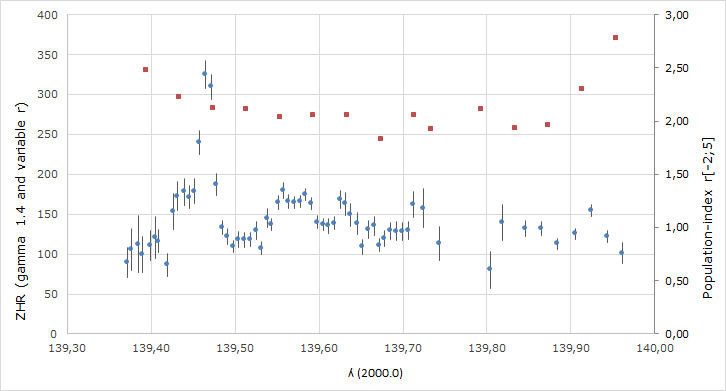
Figure 9 – ZHR and population index r combined in a single graph in function of solar longitude λ, covering 11 August 2016 20h30m UT until 12 August 2016 12h00m UT, or 139.370°< λ < 139.715°.
8 What did we see?
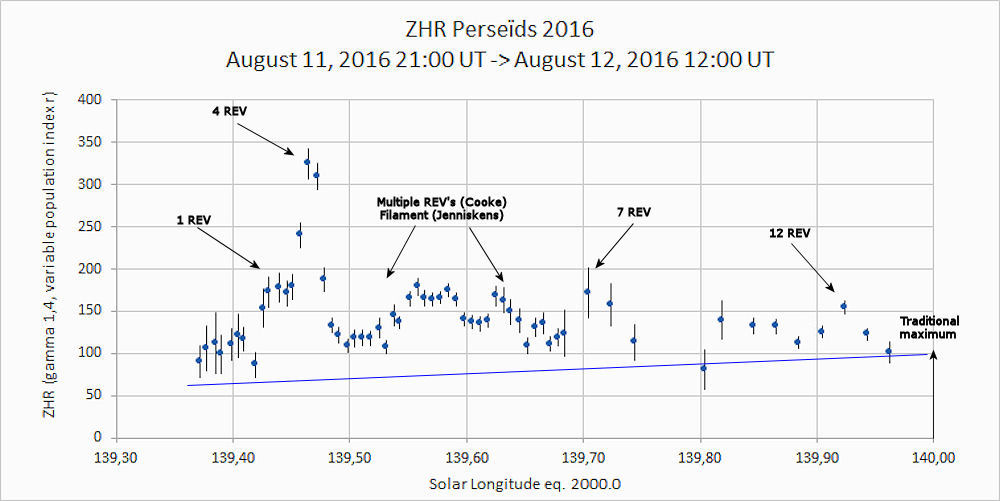 Figure 10 – The ZHR profile for the Perseids 2016 with a possible explanation for the peaks.
The annual recurrent peak was predicted at solar longitude 140°. The blue line represents the averaged annual activity.
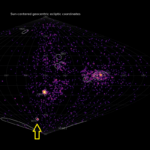
The 1 (1862) and 4 Rev (1479) dust trails
In Figure 10 we can see that a first indication of enhanced activity occurred around λ = 139.4°, or about 22h UT, according to a number of observers, more rich in bright events. This does not show up in our calculations of the population index r, see also Figures 8 and 9. The IMO video data shows this very well with a dip of 1.8 while the r-value remains for the rest of the night at 2.0 (Molau et al., 2017). However it is unclear to us how the r-value has been calculated from all the different video systems being used.
At about λ = 139.43° we see a bulging increase towards the 4 Rev. This is the 1 Rev which is interweaved within the 4 Rev. The 1 Rev occurred half hour later than predicted, but its activity was wider and higher than expected, it is visible between λ 139.4° and 139.5°. The sharp 4 Rev peak follows exactly at the predicted time at λ = 139.460° with an even more spectacular decrease. When we got through this dust trail, we also got through the 1 Rev. This Rev 1 dust trail was less striking as seen from the Provence in France due to its large proportion in faint meteors. There was still some moonlight involved and the radiant was a little bit lower at the sky. The 4 Rev dust trail appeared very pronounced in the visual observations.
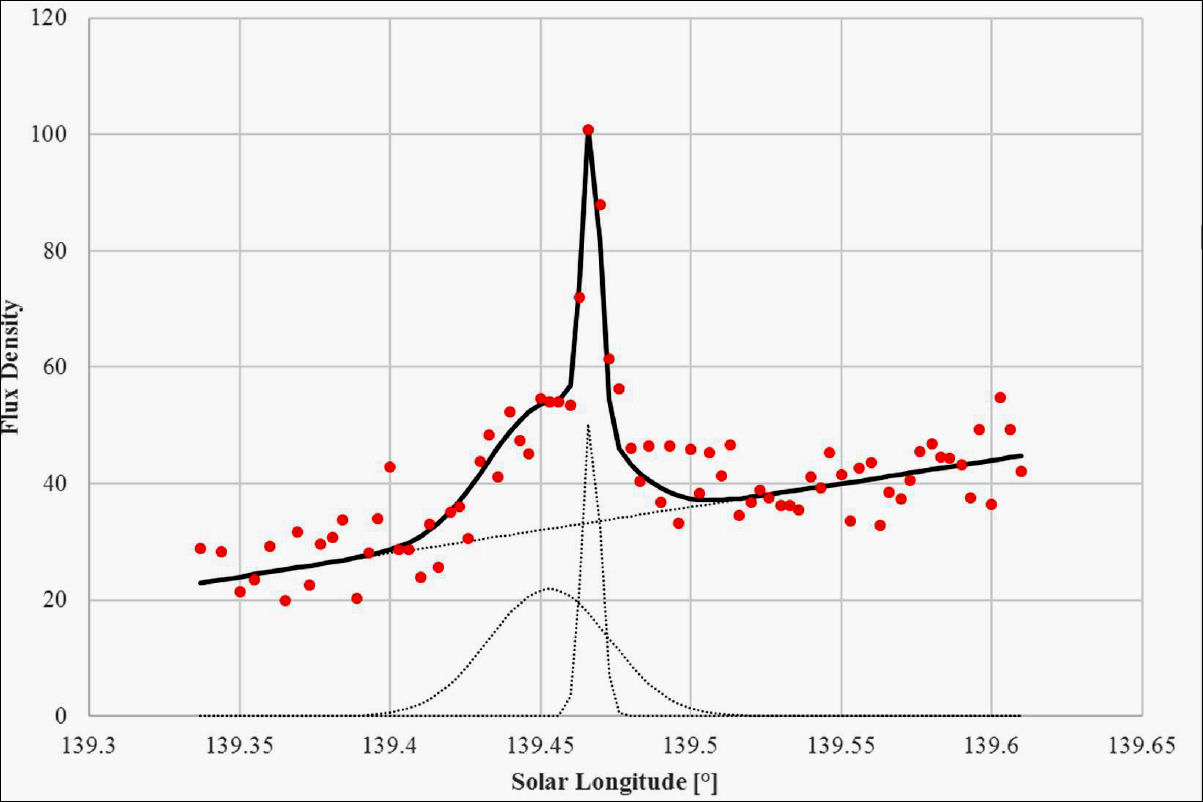
Figure 11 – The IMO video profile for the Perseids (Molau et al., 2017), represented by red dots. The black curve presents the theoretical profile based on two Gaussian curves, the first for the 1 Rev dust trail, the second for the 4 Rev dust trail. The linear line marks the average annual activity. The video activity profile fits very well with the theoretical profile (black line), especially during the passage through the dust trail.
The visual ZHR profile found from our analyses matches very well with the video Flux Density profile of the IMO (Molau et al., 2017), see also Figure 11. However we cannot compare these results straight forward as calculations have been done using different parameters. For the visual analyses we used a variable population index r and a radiant elevation correction exponent (γ) of 1.4. In the video analyses these parameters were respectively a constant population index r of 2.2 and γ = 1.5.
We believe that our computation of the r-values allow to claim the presence of the 1 Rev dust trail, partly interweaved in the 4 Rev peak. We notice significant higher, up to normal r-values before and during this period compared to later that night. Higher r-values indicate more faint Perseids. The fact that we obtain no lower r-values in spite of the brighter meteors shortly before 23h UT can be explained from the calculation method for the population index which is limited to meteors in the magnitude range of –2.0 until +5.0. The bright meteors in this period were to a large extent in the magnitude –2.0 or brighter magnitude classes. Furthermore these bright meteors may belong to the 4 Rev peak or perhaps they marked the start of this dust trail.
The fact that we are dealing with a relative young dust trail (1 Rev) means that it still contains a large number of small meteoroids and thus faint meteors. That was also the picture for the passage through the 1 Rev trail in 2004 (Miskotte and Johannink, 2005b; 2005c). A short lived outburst with a ZHR of 200 with mainly faint meteors (+2 to +5) has been observed at this occasion. In 2004 we obtained from German and Dutch DMS observations respectively r values of 3.01 and 2.40 for this 1 Rev peak (Miskotte and Johannink, 2005b; 2005c). That the r value with 2.20 obtained for 2016 is a bit lower can be explained as “pollution” by the older 4 Rev dust trail. This contains larger meteoroids which mean more bright meteors.
This means that we have effectively observed at this solar longitude what we had expected. First a bit higher r-value due to the 1 Rev trail followed by a decreasing r-value due to the increasing influence of the 4 Rev trail. This decline continues further after the passage through the 4 Rev peak, caused by the influence of still older trails (the filament) later that night.
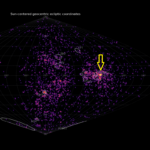
The filament, several old dust trails
After a dip in the activity, but with the ZHR still at an enhanced level, follows a build-up towards a broader plateau of enhanced activity with several peaks from solar longitude 139.60°. This includes the peaks with many bright events around 01h37m, 02h15m and 03h16m UT. What could be responsible for this?
It is rather difficult to resolve this, but thanks to the MSFC model (Cooke) we find some suspect elements such as the 10 Rev (698), 11 Rev (569), 5 Rev (1348) and 2 Rev (1737). This is a cluster of old dust trails, hence it is logic that it contains a lot of brighter stuff. Peter Jenniskens (2017) believes that this was the “filament”, a collection of old dust trails containing only large meteoroids and thus more bright meteors. The calculated r-values confirm this picture as these were the lowest for this time interval until the peak of the 7 Rev dust trail. The description as the filament is the same story as in the MSFC model of Bill Cooke, here it is listed as older dust trails (e.g. the 5, 10 and 11 Rev dust trails).
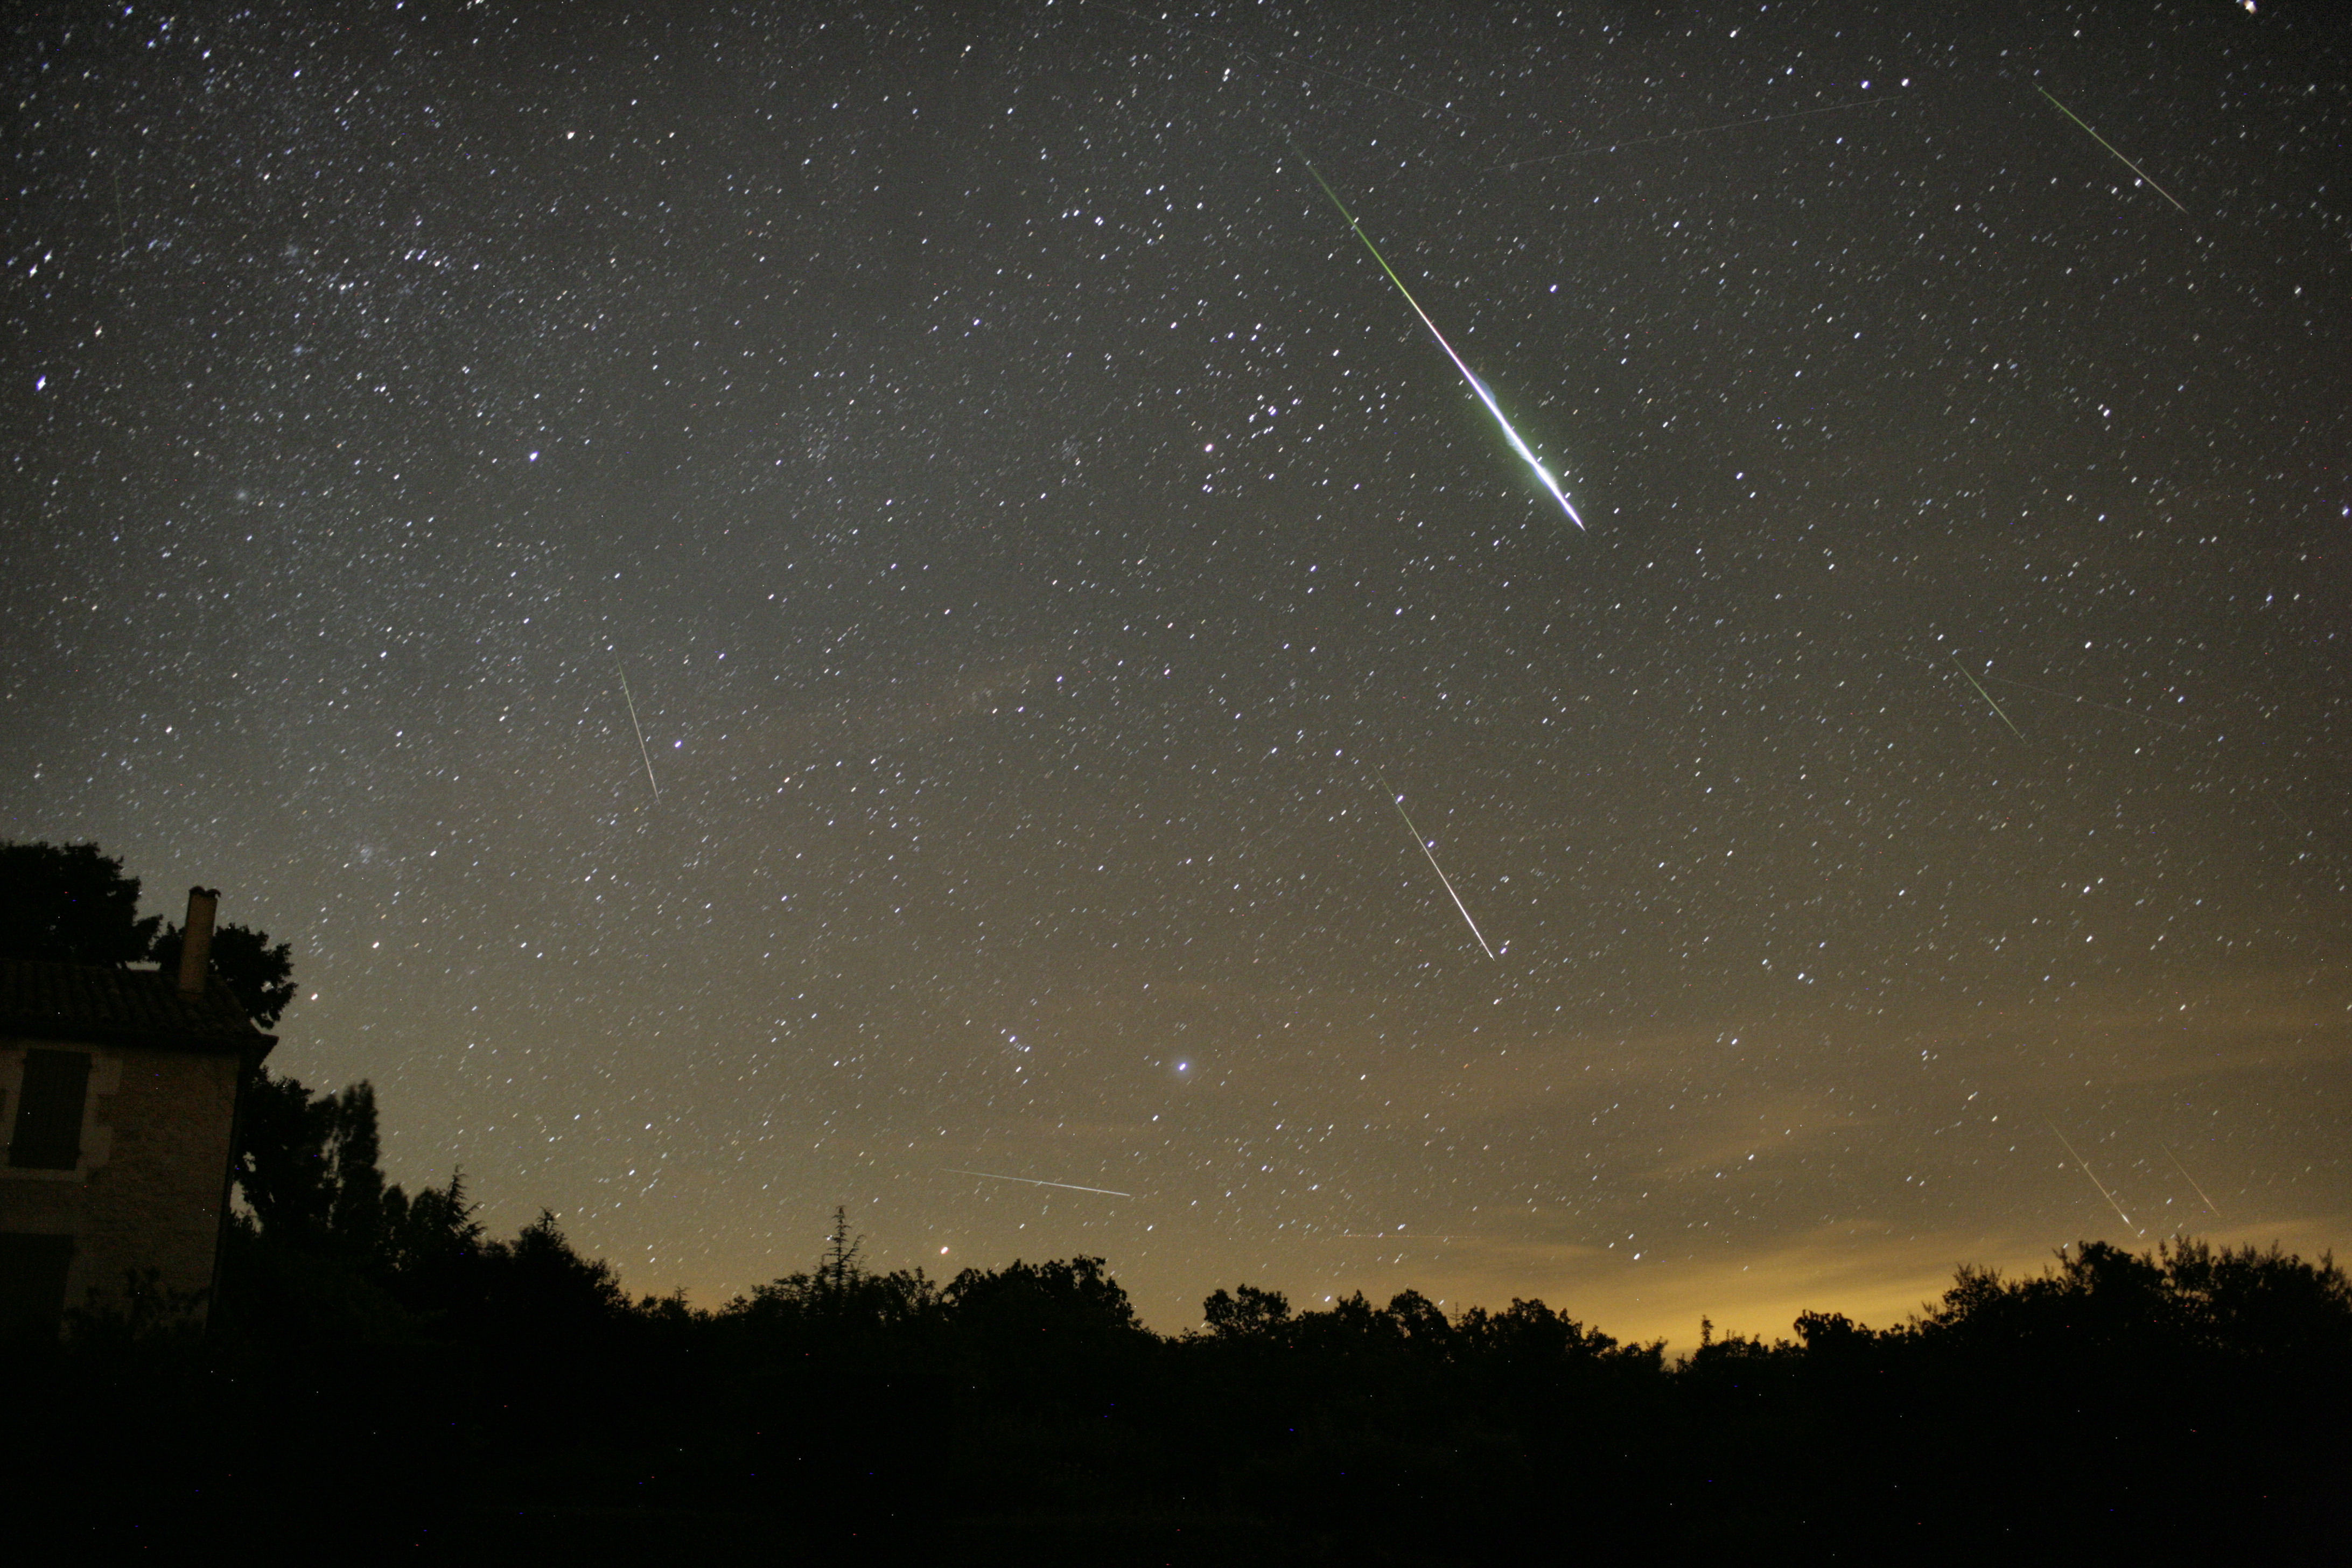
Figure 12 – Photo composition of August 12 between 02h14m and 02h24m UT. This photo shows 7 Perseids with a very bright eye catching Perseid of –8. Camera: Canon 5D with Canon EF 35 mm F 1.4 (F=1.8), ISO 1250, exposuretime 29 s. Location: Revest du Bion, Povence, France.
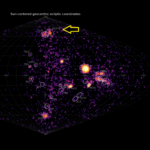
The disappointing 7 Rev (1079) peak
And then there is also the peak in the activity profile at solar longitude 139.7°, beyond doubt the contribution of the 7 Rev (1079) dust trail although this did not perform as intensely as what had been predicted by Jérémie Vaubaillon (ZHR 580). In the MSFC model it can be seen that the cluster of the 7 Rev remains at a larger distance while in the model of Vaubaillon the Earth orbit literary crosses though the trail. Peter Jenniskens concluded from the disappointing activity produced by older dust trails, that the dust particles disintegrate little bit by little bit (Jenniskens, 2016; 2017). This could also be a possible explanation for the disappointing activity of the 7 Rev trail. The calculated r-value also confirms the picture of an old dust trail, the r-value was rather low in this time interval.
Traditional maximum and the 12 Rev (441) dust trail
The peak at 139.93° is most likely the traditional maximum. However, with a ZHR of 150 also this part was far above the normal level of activity. If we assume that the model of Cooke is correct, we may assume that this was a combination of the traditional maximum at solar longitude 140.0°–140.1° with some contribution from the 12 Rev (441) dust trail. We know this dust trail from the unexpected outburst in 2008 during the night 12–13 August (Johannink et al., 2008). This dust trail from 441 also produced a strong outburst in 2009 with a ZHR of 200 which has been observed above the USA (Miskotte et al., 2009).
The r-value was normal (2.20) around this peak, while the contribution from the 12 Rev (441) dust trail would suggest to have more bright meteors. However as said above a rather small contribution had been predicted from the 12 Rev dust trail.
We presented our conclusions to Peter Jenniskens (2017) and he confirms our picture of the Perseid activity during this night.
9 12–13 August 2016: Europe
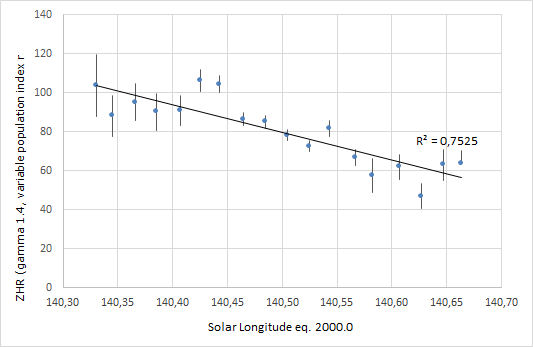 Figure 13 – The ZHR of the Perseids during the night of 12–13 August 2016 between 20h00m and 05h00m UT.
This profile is based on 5115 Perseids.
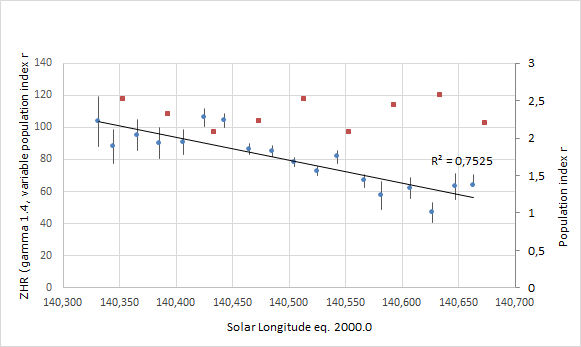
Figure 14 – The same graph as in Figure 13, but now with the r values added. It is remarkable that the r-value displays a dip at the small peaks at solar longitude 140.43° and 140.55°. It isn’t clear if this is just by accident or if it is relevant.
In this analysis we restrict our attention for this night to Europe. In total 5115 Perseids could be used for this night for this analysis. It was good to see that data from the group in Petnica (Serbia) could be used for this night. This night clearly shows the decline in activity during the night. This was in line with the expectation since the regular Perseid maximum was expected at solar longitude 140.0°–140.1° while the European observing window covered the period in solar longitude from 140.33° (Eastern Europe) until 140.67° (La Palma).
The calculated r-values display a rather scattered picture with values between 2.07 up to 2.52. Luckily this did not make much difference with the ZHR calculations done for a standard r-value of 2.2 (Vandeputte, 2016). The differences remained well within the error margins.
Based on the calculated population index r the ZHR values were computed. As expected a declining activity occurred during this night. On 12 August 2016 between 20h and 23h UT a ZHR around 90–100 was found, declining towards the morning from 90 to 60 by 5h UT. The result is shown in Figure 13.
10 Conclusion
The Perseids displayed an impressive activity in 2016. This analysis allowed identifying different peaks of the activity profile with a number of dust trails of comet 109P/Swift-Tuttle from 1862, 1479 and 1079. On top of this the regular annual maximum displayed enhanced activity as the Earth passed deeper through the meteoroid stream due to perturbations by planet Jupiter.
All in all we can look back at a magnificent Perseid return. The next interesting display is planned for 2028.
Acknowledgment
The authors thank all observers who reported data to the IMO or to the authors in person. Thanks to Carl Johannink and Paul Roggemans for their critical reading of this article, to Peter Jenniskens for a number of valuable suggestions and to Paul Roggemans for the translation of this article in English.
References
Jenniskens P. (1994). “Meteor stream activity, I. The annual streams”. Astronomy and Astrophysics, 287, 990–1013.
Jenniskens P. (2016). Asteroids IV.
Jenniskens P. (2017). Private communication.
Johannink C., Vandeputte M. and Miskotte K. (2008). “Resultaten van de Perseïden actie 2008”. eRadiant, 4, 135–142.
Miskotte K and Johannink C. (2005a). “Analyse Perseïden & Geminiden 2004”. eRadiant, 1, 9–12, 14–19.
Miskotte K. and Johannink C. (2005b). “DMS results 2004 Perseids”. eRadiant, 1, 15–21.
Miskotte K. and Johannink C. (2005c). “DMS results 2004 Perseids”. WGN, Journal of the IMO, 33, 151–154.
Miskotte K., Johannink C. and Vandeputte M. (2009). “Perseïden 2009: een spectaculaire terugkeer! Maar slechts de kruimels voor Europa…”. eRadiant, 4, 80–86.
Miskotte K. (2016). “Perseïden 2015: een globale analyse”. eRadiant, 12, 23–33.
Molau S., Crivello S., Goncalves R., Saraiva C., Stomeo E. and Kac J. (2017). “Results of the IMO Video Meteor Network – August 2016”. WGN, Journal of the IMO, 45, 13–17.
Vandeputte M. (2016). “Perseïden 2016 vanuit Revest du Bion”. eRadiant, 12, 103–113.