By Lorenzo Barbieri, Gaetano Brando, Giuseppe Allocca, Fabio Balboni and Daniele Cifiello
The Newcomb-Bedford law describes a very strange behavior for “natural” data distributions: looking at the first significant digit if that is not random but follows a logarithmic behavior. We have examined if the meteors mass index measured by RAMBo follows this law and what it means about our data.
1 Introduction
Mathematics has sometimes extraordinary mysterious or difficult explanations that make it one of the most fascinating sciences. One of these is the Newcomb-Bedford’s law. The Newcomb-Bedford law, or Newcomb-Bedford distribution, also known as Benford‘s law or law of the first digit, examines numerical data collections from physical measurements. This law does not have an intuitive explanation and at a first glance seems to come rather from the esoteric world than from the statistics world. Let’s see what it is.
2 Newcomb-Bedford law
If we extract the first significant digit in each number from a numerical data distribution, we will get a distribution of numbers ranging from 1 to 9. Table 1 shows an example.
Table 1 – Example with a distribution of numbers.
| Number | First significant digit |
| 54 | 5 |
| 38 | 3 |
| 361 | 3 |
| 753 | 7 |
| 17 | 1 |
| 76 | 7 |
| 40 | 4 |
| 118 | 1 |
| 521 | 5 |
| 161 | 1 |
| 16749 | 1 |
| 51 | 5 |
| 13 | 1 |
| 74 | 7 |
One would expect from this distribution that the probability to find any of the possible significant first digits is the same for all numbers from one to nine. This probability is:

Where Pn is the probability of a nth number. For 9 numbers with N = 9, Pn = 11.1.
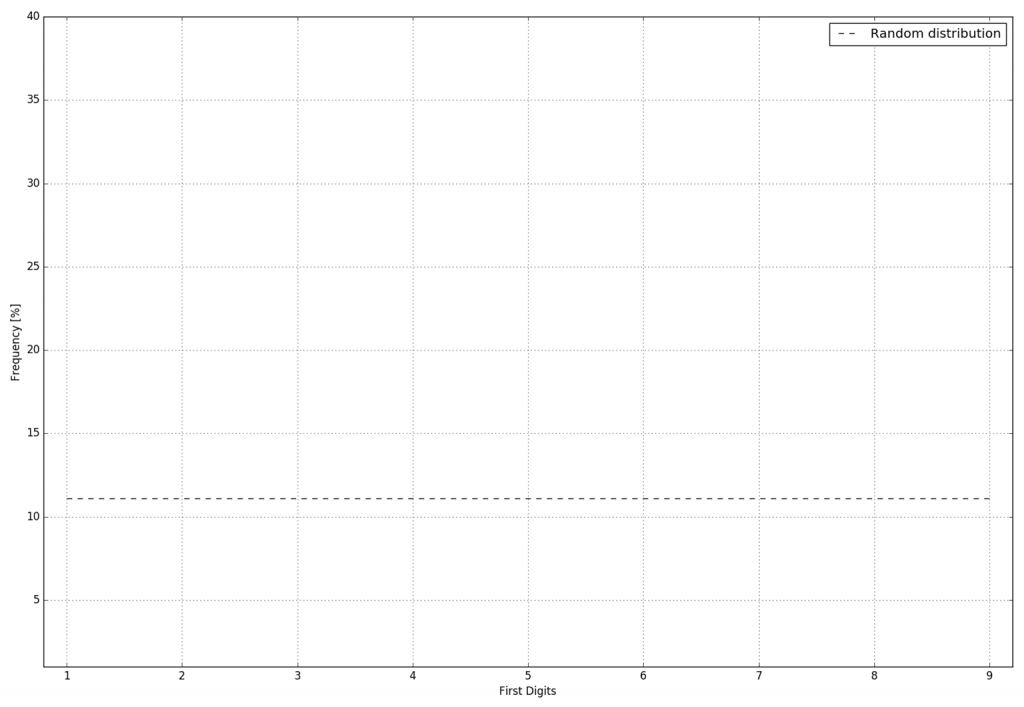
Figure 1 – Random distribution: output probability P_n=11.1.
The surprising reality is that this is not the case, if the distribution under review obeys the following three conditions:
- It is composed of a large amount of real data from a sample of physical quantities (lengths of rivers, pulsar periods, star masses, sports scores, agricultural productions, stock indices, the Fibonacci series or the power series of the two).
- It consists of numbers distributed over several orders of magnitude.
- It represents a unity of samples coming from different origin (Livio, 2003).
The probability to find a “1” as first significant figure is about 30%, to find a “2” is about 17%, while a “3” has a probability of 12% and so on, ending with a miserable 4.6% probability for an output with a “9”.
This logarithmic pattern was first discovered by a US astronomer, Simon Newcomb (1835–1909) (Dragoni et al., 1999). Analyzing the logarithmic charts of naval almanacs, Newcomb noticed that the first pages were much more dirty and worn out than the last ones.
Therefore, the consultation of the first numbers with 1 was far greater than for the numbers starting with 9. When analyzing this behavior in detail he realized that the probability for the output of the first digits corresponded to a logarithmic law as follows:
Where P is the probability and D is the first significant digit in question. By replacing D with the digits from 1 to 9 the nine probabilities Pn become:
- 1 → 30%,
- 2 → 17.6%,
- 3 → 12.5%,
- 4 → 9.7%,
- 5 → 8%,
- 6 → 6.7%,
- 7 → 5.8%,
- 8 → 5%,
- 9 → 4.6%
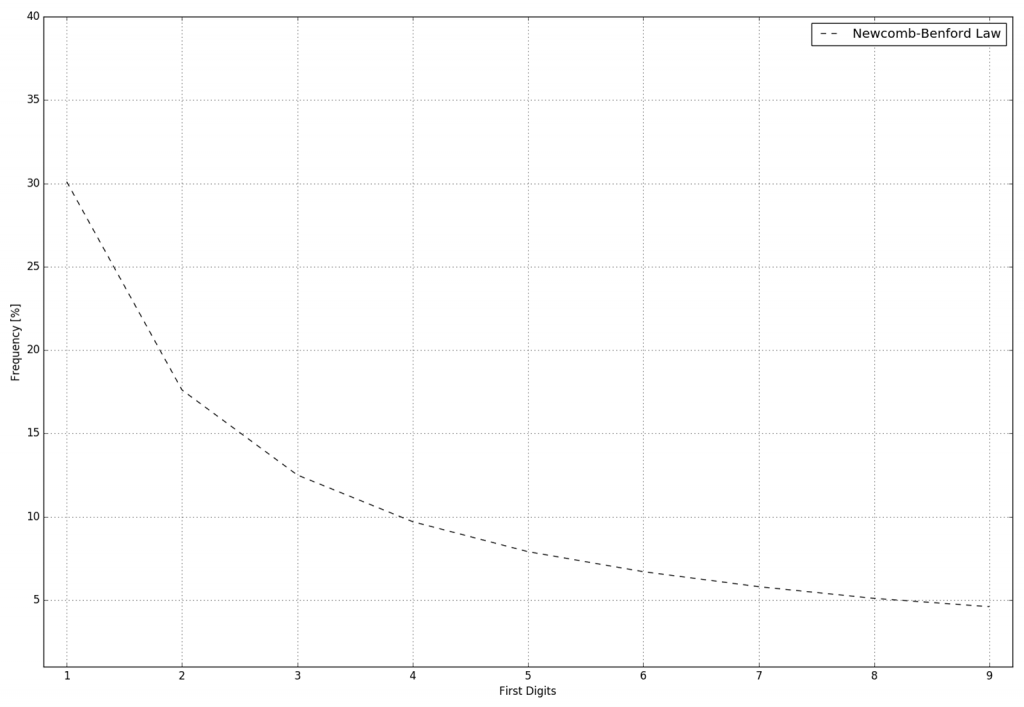
Figure 2 – Actual probability distribution for the first significant digits in a real data sample.
3 Frank Benford’s findings
About 50 years later, Frank Benford, a physician (1883–1948) and General Electric’s employee, rediscovered the curious phenomenon in a completely independent way. However, a singularity is that every sequence of arbitrarily constructed data by humans tends to follow a random distribution and does not follow the Newcomb-Bedford’s law.
Consequently, if we “pollute” a “natural” data distribution with some man-made data, the more of this “pollution” we generate, the more the distribution will deviate from the Newcomb-Bedford law. This fact has been clearly highlighted by Mark Negrini and Ted Hill who were investigating financial fraud and election fraud by analyzing data distributions using the Newcomb-Bedford law. Statistics teach us in which way we can measure how a distribution differs from another distribution taken as a sample. To do this, we have to apply the χ2 equation.
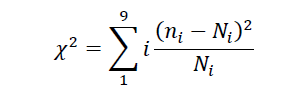
Where:
- χ2 is the “distance” of the examined distribution compared to the sample distribution;
- ni is the frequency of the ith number of the examined distribution;
- Ni is the frequency of the ith number of the sample series.
If χ2 is less than 15, then the distribution is considered to approximate the sample distribution with a high degree of fidelity. χ2 ≤ 15.51 is the situation where both distributions are similar to each other.
4 Newcomb-Bedford and Rambo data
RAMBo is a meteor echoes radio observatory, more information can be found on the website (http://www.ramboms.com). The observatory works continuously since 2014 and it records and measures daily the meteor echo data. Each day about 200 meteors are recorded, hence the data sample in our possession is very large.
Once we knew about the existence of the Newcomb-Bedford law, we wondered if our data fits in a distribution according to the Newcomb-Bedford law or if it follows a random distribution. Our data comes unquestionably from measured physical data and therefore responds to the first condition of Benford. With RAMBo we collect three types of data for each meteor: echo duration, echo amplitude, and the moment (time and date) of appearance. From the multiplication of the amplitude with the duration of the echo, both related to the mass of the meteoroid, RAMBo obtains a third value that we define as the “mass index” from which we estimate the size of the meteoroid that generated the echo. The collection of this data covers 8 magnitude classes and thus satisfies the second condition regarding the Newcomb-Bedford law. Moreover, coming from a combination of two different data collections (duration and amplitude of the meteor echoes) it also satisfies the third condition.
For the reasons outlined above, we decided to use the “mass index” as the data collection for the analyses. Then we took the first significant digit from the “mass index” obtained during the period from January 1 through May 2017. The result follows faithfully close the Newcomb-Bedford law as shown in Figure 3.
The calculation done with the equation of the χ2 method gives a value of χ2 = 0.49, which is much lower than the limit of 15.51. Even more stunning is the examination of the data from 2016, including 806928 meteor echoes analyzed which yield a value of χ2 = 0.74.
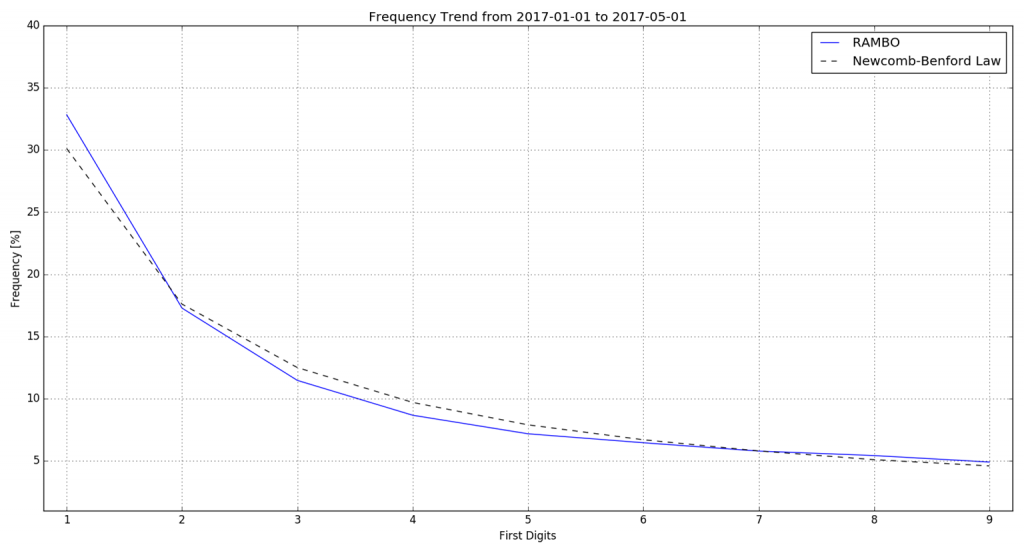
Figure 3 – The solid line is the distribution based on RAMBo data for 2017, the dotted line the Newcomb-Benford Law.
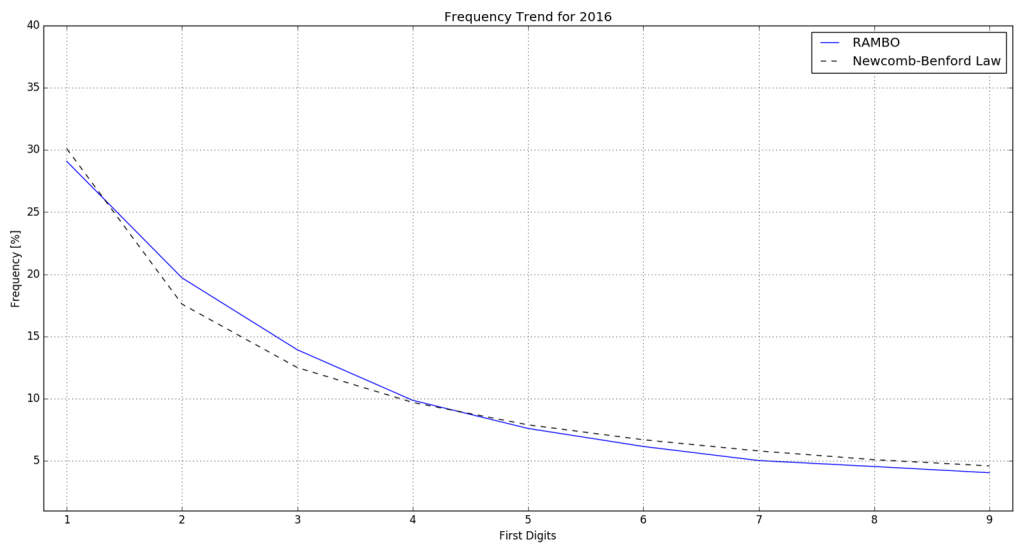
Figure 4 – The solid line is the distribution based on RAMBo data for 2016, the dotted line the Newcomb-Benford Law.
We can conclude that the data measured by RAMBo perfectly follows Newcomb-Bedford’s law. Hence, the data is “natural”, i.e. the data does not contain human or artificial pollution which would have led to a different distribution than the Newcomb-Bedford one. We can assume that the apparatus that we have designed and constructed does not produce artifacts.
It is of great interest to focus on the merits of the second feature of the Newcomb-Bedford law. Its application was able to detect financial fraud to the detriment of a major US tourism and entertainment company. The presence of thirteen false checks from fraudulently collected sums was discovered with this method. The Brooklyn District Attorney’s Office also benefited from the Newcomb-Bedford law proving fraud in seven New York companies (Livio, 2003). Other cases concern the discovery of financial data falsification, company financial statements, tax returns, stock exchange reports, and even electoral frauds (Benegiamo, 2017). Even more interesting is the study by geologists on the geophysical data that preceded the great Sumatra-Andaman earthquake of December 26, 2004, with a magnitude of up to 9. It seems that this data was significantly different from the Newcomb-Bedford’s distribution, while those measured twenty minutes later were back to normal. If such a behavior could be confirmed and found in other occasions, it could open up an important field of investigation in the prevention of seismic phenomena (Benegiamo, 2017).
The question arises whether in a stressful situation or in any exceptional case different from the usual situation, a tendency could appear in measured data to deviate from a normal behavior.
At this point we wondered whether the behavior of the data collected during a meteor shower would deviate from the data collected over a period of time dominated by sporadic meteors. If this condition really occurs, it would be a third indication for the presence of a shower, in addition to the two that we already measure, e.g. the HR (Hourly Rate) and the “mass index” of the meteors ablating in the atmosphere.
We have therefore tried to analyze the data from one of the strongest meteor showers, for example the Quadrantids of 2017. We followed the same procedure as previously used for the calculation of some samples from periods dominated by sporadic meteors only.
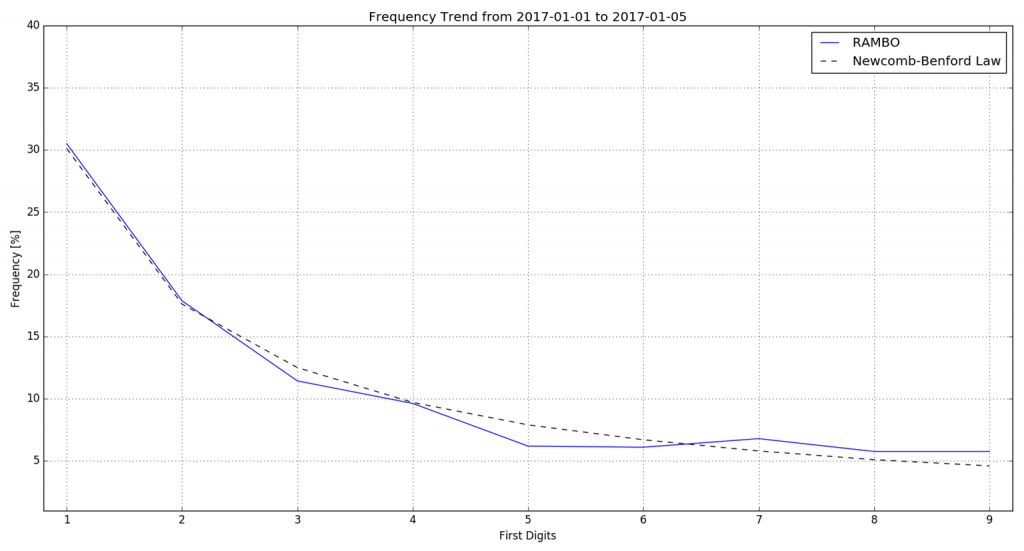
Figure 5 – The solid line is the distribution based on RAMBo data for the 2017 Quadrantids, the dotted line the Newcomb-Benford Law.
The result shows no difference; therefore there is no different behavior in the Newcomb-Bedford analysis between meteor showers and sporadics (Figure 5).
Meteor showers cover very short periods of time, thus the amount of the analyzed data is much smaller and therefore it does not follow the first condition of the Newcomb-Bedford law, but it is probably wiser to say that this hypothesis is unfounded.
References
Dragoni Giovanni, Bergia Silvio and Gottardi Giovanni (1999). “Dizionario Biografico degli scienziati e dei tecnici”. Editrice Zanichelli.
Livio Mario (2003). La sezione aurea. Editore Rizzoli.
Benegiamo Gianfranco (2017). “C’è anche nel cielo la dittatura del numero 1”. Le Stelle mensile, n°163, February 2017.

