Introduction
This year is of special interest for the short lived OCT-shower, because according to the medium long period model, the calculated 1-revolution trail would pass quite close to the same place (relative to the Earth orbit) as in 2005. Unfortunately for us, here in Finland, the expected maximum time was before darkness. However, we paid attention with our Finnish Fireball Network to our fireball camera meteors and we had widely clear skies then. We captured about twenty probable OCT meteors, three of which were multi-station meteors. One of these, in absolute brightness around the fireball magnitude limit was captured by five stations. This will yield a first class solar system orbit. There is still work to do with the calibration of one of these cameras.
Long period model
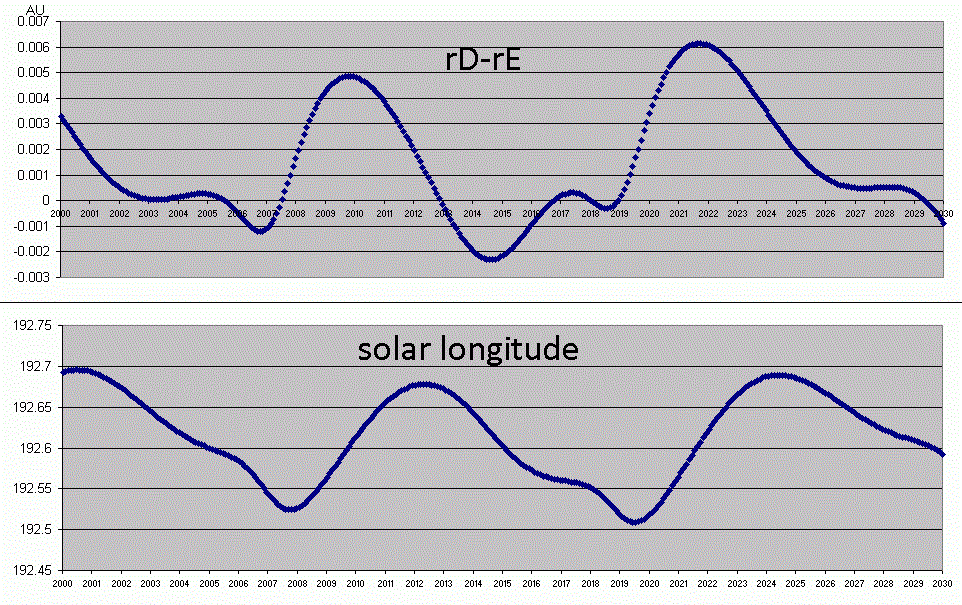
The situation is very interesting for the long period model, because the modeled rD (trail solar distance in the descending node) happens to increase very little progressively in between the years 2005, 2016, 2017 by about (barely) 0.0002 AU in between 2005 and 2016 and with about a similar value (0.0002) in between 2016 and 2017. This situation is a favorable change, because in between these years the trail is far from this situation. The calculated course relative to the Earth orbit is shown in the graph. This calculation is based on an assumed ejection in the year 1255, but the result is only very weakly dependent on the assumed year, if the applied period is more than about 300 years.

The calculated course relative to the Earth orbit.
The 2016 OCT outburst
And there really was an outburst, as seen for example in the Japanese radio results:
https://www.emeteornews.net/2016-october-camelopardalids-radio-results/
And the last graph of 10 minute recordings in this link is of special interest:
http://www5f.biglobe.ne.jp/~hro/Flash/2016/OCT/index.html
Read also: http://www.cbat.eps.harvard.edu/iau/cbet/004300/CBET004329.txt.
A maximum peak with the duration of well less than half an hour appears to have been observed about exactly at the predicted time.
I expect this to be the encounter of the actual core of the 1-revolution trail. Otherwise it is not very clear to me in what degree the more wide peak in this and earlier years has been of the 1-r trail as compared to the filament expected to have formed by a few other trails of previous revolutions.
The exact location of the 1-r core is still not exactly known. In the graph, this was adjusted to fit exactly in this year. But we do not yet know what will happen next year. It could be possible that we encounter an even more strong very short maximum peak or otherwise about the same as in this year or maybe practically none of this. By comparing these three encounters (2005, 2016 and 2017) it is expected that the position of the actual 1r-trail will get more precisely pinpointed. Hence, this repeating situation in these years is very interesting and favorable to study.
Next year and beyond
Next year, the timing is suitable in the evening of Oct. 5, but the Moon will be almost full. In the graph and in the values for the calculated miss-distance, the Earth orbit radius from the Sun ( rE = radii at the encounter position) has been assumed to be the same as in this year. Further checks on this can be made and applied, probably at least with the final analysis of the 2017 results that we hope to obtain.
I also note that in years with no favorable encounter of the actual dense 1-r trail, the filament is also expected to “move” roughly according to the graph and so the best solar longitude for each year can be taken from this graph. The total change in this is quite small.


